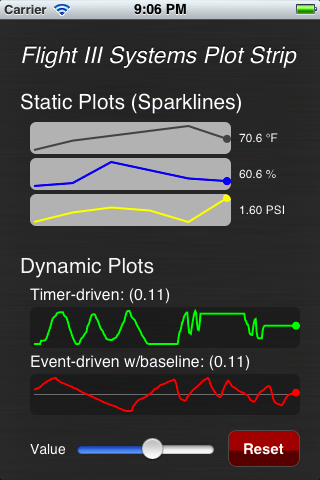
For a recent project, I wanted a small widget which could display a small graph in a dynamic fashion. I found several controls which were close, but lacked the ability to easily add a single value at a time.
The resulting control can be used as a dynamic plot line as well as a more static "sparkline" type of widget. When linked to a UILabel control, it will update the label with the most recent value in a customizable format.
The implementation is reasonably memory efficient, storing the raw values in a contiguous buffer of memory. This is approximately 8x more memory efficient than an NSArray of NSNumber instances for typical (a few hundred) history sizes.
If you find this control of use (or find bugs), I'd love to hear from you! Drop a note to [email protected] with questions, comments, or dissenting opinions.
Adding this control to your XCode project is straightforward:
- Add the F3PlotStrip.h and F3PlotStrip.m files to your project
- Add a new blank subview to the nib, sized and positioned to match what the plot strip should look like.
- In the properties inspector for this subview, change the class to "F3PlotStrip"
- Add an outlet to represent the control
- Update your code to set the value property as appropriate.
See the demo project for examples.
- By associating a UILabel (or derivative) with the plot strip control, you can provide a formatted view of the most recent value in the plot. The label property is used to assign the UILabel instance to the plot strip control, and the labelFormat property provides the format string (see NSString's stringWithFormat: method for details).
- The color and width of the plot line can be customized, and by setting the view's background color, you can provide an attractive representation of a data series.
- If you set the plot strip up with a black background and don't see any plot line showing, either change the background color or the color of the plot line as the default line color is black.
- The most recent value within the data series can be highlighted with a dot; this is controlled by the showDot property and is enabled by default.
- A large number of values can be passed to the plot strip at one time via the data property. When passing data this way, the control expects to receive an NSArray of NSNumber instances. Use this approach when using the plot strip as a static plot / sparkline.
- Values can be added to the plot by a single float at a time through the either the setValue method or the value property. This approach works best when plotting live data and will scroll the plot area as needed.
- The upper and lower limits are determined dynamically by default but may also be specified manually. Again, see the demo for examples.
- Baseline functionality allows a horizontal line to be drawn on the plot for a specific value. The demo code, which is set up to follow the slider control through values between -1.0 and +1.0 uses this feature to show where zero is at on the plot.
Copyright (c) 2012 by Brad Benson All rights reserved.
Redistribution and use in source and binary forms, with or without modification, are permitted provided that the following conditions are met:
- Redistributions of source code must retain the above copyright notice this list of conditions and the following disclaimer.
- Redistributions in binary form must reproduce the above copyright notice, this list of conditions and the following disclaimer in the documentation and/or other materials provided with the distribution.
THIS SOFTWARE IS PROVIDED BY THE COPYRIGHT HOLDERS AND CONTRIBUTORS "AS IS" AND ANY EXPRESS OR IMPLIED WARRANTIES, INCLUDING, BUT NOT LIMITED TO, THE IMPLIED WARRANTIES OF MERCHANTABILITY AND FITNESS FOR A PARTICULAR PURPOSE ARE DISCLAIMED. IN NO EVENT SHALL THE COPYRIGHT HOLDER OR CONTRIBUTORS BE LIABLE FOR ANY DIRECT, INDIRECT, INCIDENTAL, SPECIAL, EXEMPLARY, OR CONSEQUENTIAL DAMAGES (INCLUDING, BUT NOT LIMITED TO, PROCUREMENT OF SUBSTITUTE GOODS OR SERVICES; LOSS OF USE, DATA, OR PROFITS; OR BUSINESS INTERRUPTION) HOWEVER CAUSED AND ON ANY THEORY OF LIABILITY, WHETHER IN CONTRACT, STRICT LIABILITY, OR TORT (INCLUDING NEGLIGENCE OR OTHERWISE) ARISING IN ANY WAY OUT OF THE USE OF THIS SOFTWARE, EVEN IF ADVISED OF THE POSSIBILITY OF SUCH DAMAGE.

