Giter VIP home page Giter VIP logo

mortalitytables.jl's Introduction

MortalityTables

Stable Dev CI codecov lifecycle

A Julia package for working with MortalityTables. Has:

  • Full set of SOA mort.soa.org tables included
  • survival and decrement functions to calculate decrements over period of time
  • Partial year mortality calculations (Uniform, Constant, Balducci)
  • Friendly syntax and flexible usage
  • Extensive set of parametric mortality models.

On this Page:

Examples

Quickstart

Load and see information about a particular table:

julia> vbt2001 = MortalityTables.table("2001 VBT Residual Standard Select and Ultimate - Male Nonsmoker, ANB")
MortalityTable (Insured Lives Mortality):
   Name:
       2001 VBT Residual Standard Select and Ultimate - Male Nonsmoker, ANB
   Fields:
       (:select, :ultimate, :metadata)
   Provider:
       Society of Actuaries
   mort.SOA.org ID:
       1118
   mort.SOA.org link:
       https://mort.soa.org/ViewTable.aspx?&TableIdentity=1118
   Description:
       2001 Valuation Basic Table (VBT) Residual Standard Select and Ultimate Table -  Male Nonsmoker.
       Basis: Age Nearest Birthday. 
       Minimum Select Age: 0. 
       Maximum Select Age: 99. 
       Minimum Ultimate Age: 25. 
       Maximum Ultimate Age: 120

The package revolves around easy-to-access vectors which are indexed by attained age:

julia> vbt2001.select[35]          # vector of rates for issue age 35
 0.00036
 0.00048
 
 0.94729
 1.0
 
julia> vbt2001.select[35][35]      # issue age 35, attained age 35
 0.00036
 
julia> vbt2001.select[35][50:end] # issue age 35, attained age 50 through end of table
0.00316
0.00345
 
0.94729
1.0

julia> vbt2001.ultimate[95]        # ultimate vectors only need to be called with the attained age
 0.24298

Calculate the force of mortality or survival over a range of time:

julia> survival(vbt2001.ultimate,30,40) # the survival between ages 30 and 40
0.9894404665434904

julia> decrement(vbt2001.ultimate,30,40) # the decrement between ages 30 and 40
0.010559533456509618

Non-whole periods of time are supported when you specify the assumption (Constant(), Uniform(), or Balducci()) for fractional periods:

julia> survival(vbt2001.ultimate,30,40.5,Uniform()) # the survival between ages 30 and 40.5
0.9887676470262408

Quickly access and compare tables

This example shows how to develop a visual comparison of rates from scratch, but you may be interested in this pre-built tool for this purpose.

using MortalityTables, Plots


cso_2001 = MortalityTables.table("2001 CSO Super Preferred Select and Ultimate - Male Nonsmoker, ANB")
cso_2017 = MortalityTables.table("2017 Loaded CSO Preferred Structure Nonsmoker Super Preferred Male ANB")

issue_age = 80
mort = [
	cso_2001.select[issue_age][issue_age:end],
	cso_2017.select[issue_age][issue_age:end],
	     ]
plot(
	   mort,
	   label = ["2001 CSO" "2017 CSO"],
	   title = "Comparison of 2107 and 2001 CSO \n for SuperPref NS 80-year-old male",
	   xlabel="duration")

Comparison of 2001 and 2017 CSO \n for 80-year-old male

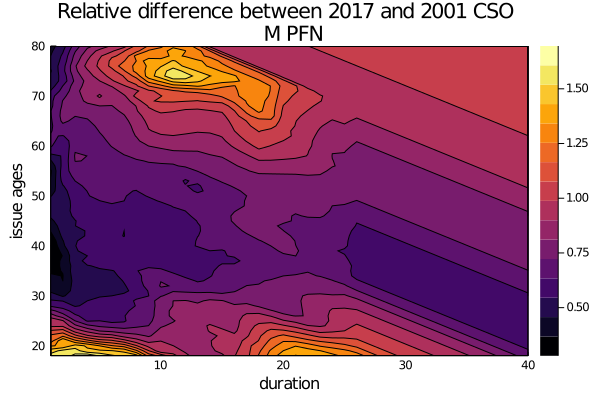
Easily extend the analysis to move up the ladder of abstraction:

issue_ages = 18:80
durations = 1:40

# compute the relative rates with the element-wise division ("brodcasting" in Julia)
function rel_diff(a, b, issue_age,duration)
        att_age = issue_age + duration - 1
        return a[issue_age][att_age] / b[issue_age][att_age]
end


diff = [rel_diff(cso_2017.select,cso_2001.select,ia,dur) for ia in issue_ages, dur in durations]
contour(durations,
        issue_ages,
        diff,
        xlabel="duration",ylabel="issue ages",
        title="Relative difference between 2017 and 2001 CSO \n M PFN",
        fill=true
        )

heatmap comparison of 2017 CSO and 2001 CSO Mortality Table

Scaling and capping rates

Say that you want to take a given mortality table, scale it by 130%, and cap it at 1.0. You can do this easliy by broadcasting over the underlying rates (which is really just a vector of numbers at the end of the day):

issue_age = 30
m = cso_2001.select[issue_age]

scaled_m = min.(cso_2001.select[issue_age] .* 1.3, 1.0) # 130% and capped at 1.0 version of `m`

Note that min.(cso_2001.select .* 1.3, 1.0) won't work because cso_2001.select is still a vector-of-vectors (a vector for each issue age). You need to drill down to a given issue age or use an ulitmate table to manipulate the rates in this way.

Fractional Years

When evaluating survival over partial years when you are given full year mortality rates, you must make an assumption over how those deaths are distributed throughout the year. Three assumptions are provided as options and are based on formulas from the 2016 Experience Study Calculations paper from the SOA, specifically pages 40-44.

The three assumptions are:

  • Uniform() which assumes an increasing force of mortality throughout the year.
  • Constant() which assumes a level force of mortality throughout the year.
  • Balducci() which assumes a decreasing force of mortality over the year. It seems to be for making it easier to calculate successive months by hand rather than any theoretical basis.

Tables

Bundled Tables

Comes with all tables built in via mort.SOA.org and by using you agree to their terms. The tables were accessed and mirrored as of the date documented in the JuliaActuary Artifacts repository

Not all tables have been tested that they work by default, though no issues have been reported with any of the the VBT/CSO/other common tables.

Load custom set of tables

Download the .xml aka the (XTbML format) version of the table from mort.SOA.org and place it in a directory of your choosing. Then call MortaliyTables.read_tables(path_to_your_dir).

Given a table id (for example 60029), you can also use this to get the table of interest:

aus_life_table_female = MortalityTables.table(60029)
aus_life_table_female[0]  # returns the attained age 0 rate of 0.10139

From CSV

If you have a CSV file that is from mort.SOA.org, or follows the same structure, then you can load and parse the table into a MortalityTable like so:

using CSV
using MortalityTables

path = "path/to/table.csv"
file = CSV.File(path,header=false) # SOA's CSV files have no true header
table = MortalityTable(file)

From XTbML

If you have a file using the XTbML format:

using MortalityTables
path = "path/to/table.xml"
table = MortalityTables.readXTbML(path)

Custom Tables

Say you have an ultimate vector and select matrix, and you want to leverage the MortalityTables package.

Here's an example, where we first construct the UlitmateMortality and then combine it with the select rates to get a SelectMortality table.

using MortalityTables

# represents attained ages of 15 through 100
ult_vec = [0.005, 0.008, ...,0.805,1.00]
ult = UltimateMortality(ult_vec,start_age = 15)

We can now use this the ultimate rates all by itself:

q(ult,15,1) # 0.005

And join with the select rates, which for our example will start at age 0:

# attained age going down the column, duration across
select_matrix = [ 0.001 0.002 ... 0.010;
                  0.002 0.003 ... 0.012;
                  ...
                ]
sel_start_age = 0
sel = SelectMortality(select_matrix,ult,start_age = 0)

sel[0][0] #issue age 0, attained age 0 rate of  0.001
sel[0][100] #issue age 0, attained age 100 rate of  1.0

Lastly, to take the SelectMortality and UltimateMortality we just created, we can combine them into one stored object, along with a TableMetaData:

my_table = MortalityTable(
              s1,
              u1,
              metadata=TableMetaData(name="My Table", comments="Rates for Product XYZ")
              )

Parameterized Models

The following parametric models are available:

Gompertz
InverseGompertz
Makeham
Opperman
Thiele
Wittstein
Perks
Weibull
InverseWeibull
VanderMaen
VanderMaen2
StrehlerMildvan
Quadratic
Beard
MakehamBeard
GammaGompertz
Siler
HeligmanPollard
HeligmanPollard2
HeligmanPollard3
HeligmanPollard4
RogersPlanck
Martinelle
Kostaki
Kannisto
KannistoMakeham

Use like so:

a = 0.0002
b = 0.13
c = 0.001
m = MortalityTables.Makeham(a=a,b=b,c=c)
g = MortalityTables.Gompertz(a=a,b=b)

Now some examples with m, but could use g interchangeably:

age = 20
m[20]                 # the mortality rate at age 20
decrement(m,20,25)    # the five year cumulative mortality rate
survival(m,20,25) # the five year survival rate

Other notes

  • Because of the large number of models and the likelihood for overlap with other things (e.g. Quadratic or Weibull would be expected to be found in other contexts as well), these models Are not exported from the package, so you need to call them by prefixing with MortalityTables.
    • e.g. : MortalityTables.Kostaki()
  • Because of the large number of parameters for the models, the arguments are keyword rather than positional: MortalityTables.Gompertz(a=0.01,b=0.2)
  • The models have default values, so they can be called without args like this: MortalityTables.Gompertz().
    • See the help text for what the default values are: ?Gompertz

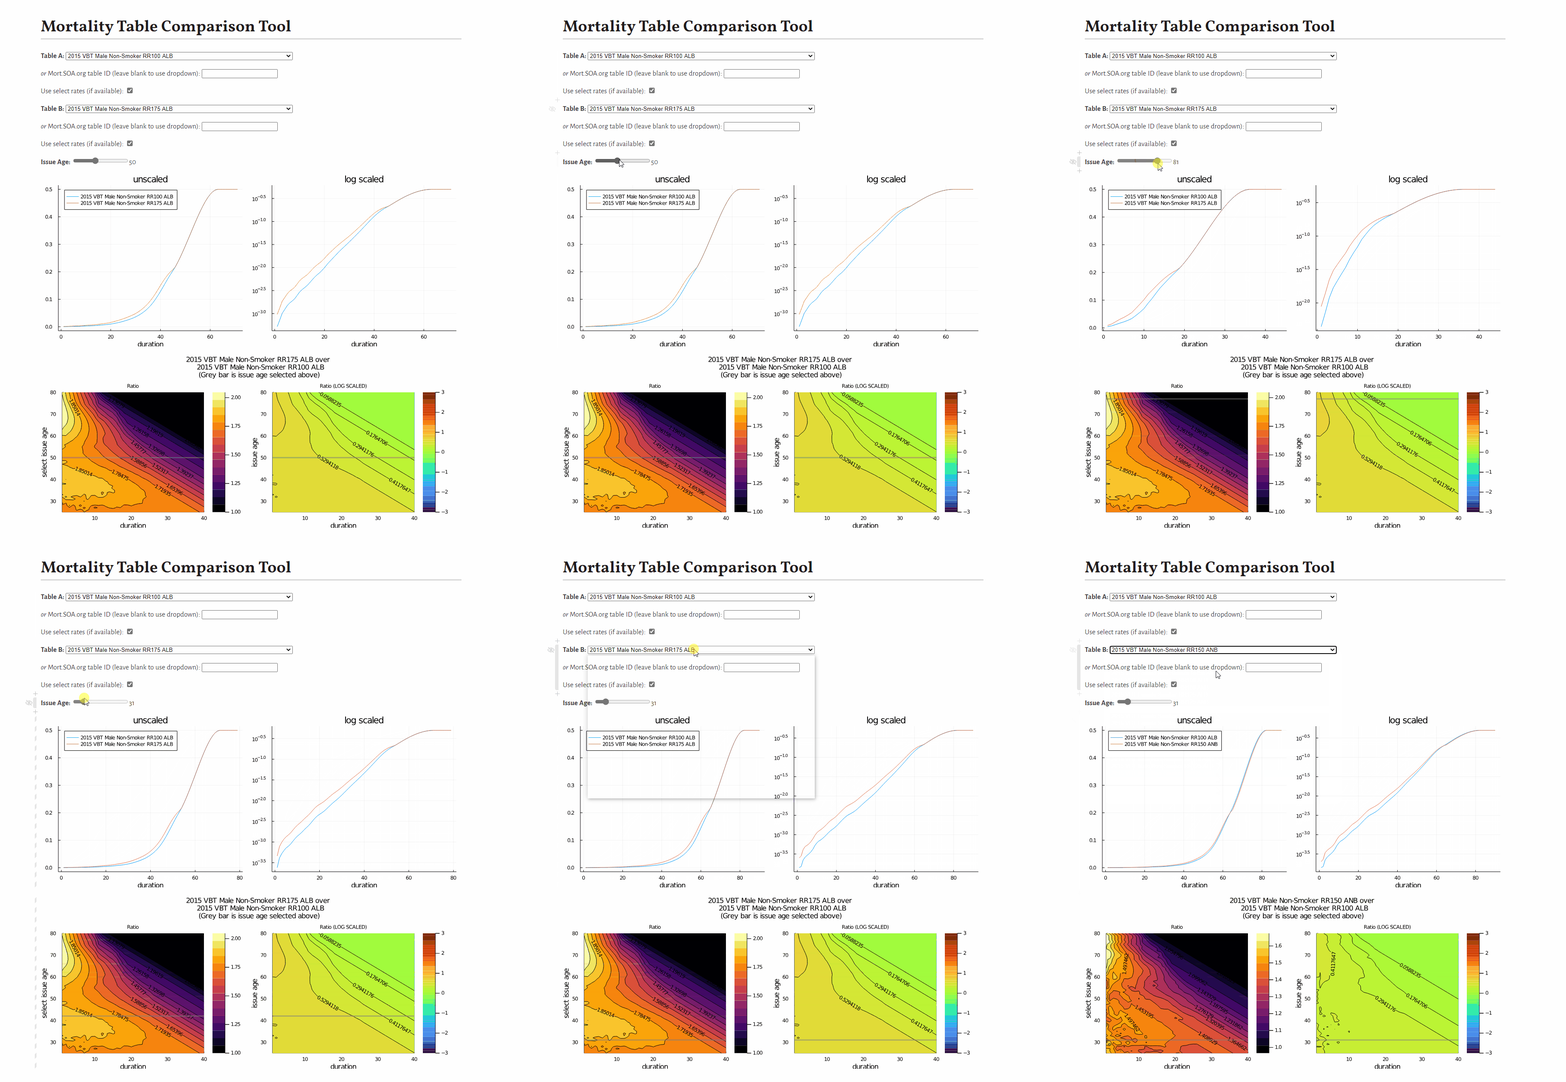
Mortality Table Comparison Tool

You may be interested in this tool to compare mortality tables:

A gif showing a visualization of the differences between two mortality tables

References

Similar Projects

mortalitytables.jl's People

Contributors

alecloudenback avatar chris-b1 avatar github-actions[bot] avatar logankilpatrick avatar matthewcaseres avatar quinnj avatar

Stargazers

 avatar  avatar  avatar  avatar  avatar  avatar  avatar  avatar  avatar  avatar  avatar  avatar  avatar  avatar  avatar  avatar  avatar  avatar  avatar  avatar  avatar  avatar  avatar  avatar  avatar  avatar

Watchers

 avatar  avatar

mortalitytables.jl's Issues

Scaling Factor

Find a table that uses a scalingfactor and test/build compatibility. There's a table attribute for this but I've never seen/used a table that has one. Would like to scale all rates as appropriate when scaling is necessary.

Support for loading collections of tables

Some tables "belong together", they partition the population and these table collections can be used for experience studies.

  • Create a mapping that specifies the tables that are logically grouped.
  • Provide an API for users to retrieve multiple tables.

Currently, I am thinking about some sort of JSON config that specifies the table groupings. Then allow users to retrieve a tidy data set of all the tables in the collection.

Create an iterable interface

Allow for iteration, e.g.

for q in mortalitytable
    '# do something
end

This will also make the logic for LifeContingencies a lot better because we don't have to worry so much about omegas because the iteration interface will handle the termination. Also will make more compatible with Transducers

Refactor of Mortality Table Types

Motivation:

  • It's almost never needed to contiguously access mortality rates across issues ages, almost always attained age or duration.
  • It's been a real pain to try and make a 2D array format because the Issue Age dimension naturally starts at 0. Trying to use OffsetArrays hasn't been pleasant because of the verbose types, lack of support across the whole ecosystem (e.g. DataFrames compatibility, and the begin syntax for array indexing is brand new in Julia 1.4
  • Storing everything in Dictionaries also feels like the wrong answer because it's awkward to try and handle knowing when the table begins and ends

Therefore:

  • Restructure around 1D arrays which have pre-computed select/ultimate vectors for a given issue age:
    MortalityVector[Duration]
  • Store these arrays in a Select and Ultimate DefaultDict indexed by issue age, which is natural for the times when early issue ages aren't defined:
    SelectTable[IssueAge] or UltimateTable[IssueAge]`
  • Enforce that all calls need to specify an issue age and duration - trying to allow indexing by attained age for ultimate rates is complicated:
    • For recursive calcs that depend on the start of the table (e.g. lx), but ultimate rates not defined for early issue ages, it's awkward to handle.

Benefits:

  • The most basic building block for most calculations is very simple - a simple 1D, 1-indexed array
  • Should be performant
  • Easier to rationalize calcs that are recursive or depend on knowing when the table would start or end such as lx

add Constructor to avoid needing to have users add OffsetArrays

E.g. with a slightly customized (e.g. improved) mortality rate, let users create a mort object like:

mortality(vec,start_age=age)

instead of

using OffsetArrays
OffsetArray(vec,age)

Can currently do this with UltimateMortality but it's not clear to user that this is semantically the same as above.

Error when loading table 887 (Annuity 2000)

julia> m2000 = get_SOA_table(887)
ERROR: XMLError: Start tag expected, '<' not found from XML parser (code: 4, line: 1)
Stacktrace:
 [1] throw_xml_error() at C:\Users\AlecLoudenback\.julia\packages\EzXML\ZNwhK\src\error.jl:87
 [2] macro expansion at C:\Users\AlecLoudenback\.julia\packages\EzXML\ZNwhK\src\error.jl:52 [inlined]
 [3] parsexml(::String) at C:\Users\AlecLoudenback\.julia\packages\EzXML\ZNwhK\src\document.jl:80
 [4] parse_xml at C:\Users\AlecLoudenback\.julia\packages\XMLDict\vlQGP\src\XMLDict.jl:60 [inlined]
 [5] xml_dict(::String, ::Type{T} where T; options::Base.Iterators.Pairs{Union{},Union{},Tuple{},NamedTuple{(),Tuple{}}}) at C:\Users\AlecLoudenback\.julia\packages\XMLDict\vlQGP\src\XMLDict.jl:127
 [6] xml_dict(::String, ::Type{T} where T) at C:\Users\AlecLoudenback\.julia\packages\XMLDict\vlQGP\src\XMLDict.jl:127 (repeats 2 times)
 [7] getXML at C:\Users\AlecLoudenback\.julia\packages\MortalityTables\kGPlQ\src\XTbML.jl:11 [inlined]
 [8] get_SOA_table(::Int64) at C:\Users\AlecLoudenback\.julia\packages\MortalityTables\kGPlQ\src\get_SOA_table.jl:20
 [9] top-level scope at REPL[20]:1

Annuity 2012 works:

julia> m2012 = get_SOA_table(2585)
MortalityTable (Annuitant Mortality):
   Name:
       2012 IAM Period Table – Male, ANB
   Fields:
       (:ultimate, :metadata)
   Provider:
       Susie Lee
   mort.SOA.org ID:
       2585
   mort.SOA.org link:
       https://mort.soa.org/ViewTable.aspx?&TableIdentity=2585
   Description:
       2012 Individual Annuity Mortality Period Table – Male. Basis: Age Nearest Birthday. Minimum Age: 0. Maximum Age: 120

Stackoverflow error

julia> survival(MortalityTables.mortality_vector([0.5,0.5],start_age=50),50,50.5)
ERROR: StackOverflowError:
Stacktrace:
 [1] survival(::OffsetArrays.OffsetArray{Float64,1,Array{Float64,1}}, ::Float64) at C:\Users\alecl\.julia\packages\MortalityTables\C27GM\src\MortalityTable.jl:171
 [2] survival(::OffsetArrays.OffsetArray{Float64,1,Array{Float64,1}}, ::Int64, ::Float64) at C:\Users\alecl\.julia\packages\MortalityTables\C27GM\src\parameterized_models.jl:780
 ... (the last 2 lines are repeated 39990 more times)
 [79983] survival(::OffsetArrays.OffsetArray{Float64,1,Array{Float64,1}}, ::Float64) at C:\Users\alecl\.julia\packages\MortalityTables\C27GM\src\MortalityTable.jl:171

Trim Table names for whitespace

e.g. "2001 VBT Select and Ultimate - Male Nonsmoker, ANB " - the trailing whitespace in the source XML makes it harder to refer to the respective table.

trailing missing in mortality table

The table should terminate at attained age 120 instead of having the two trailing missing values and omega = 120

julia>  cso_2001 = tables["2001 CSO Super Preferred Select and Ultimate - Male Nonsmoker, ANB"]
julia> cso_2001.select[98]
25-element OffsetArray(::Array{Union{Missing, Float64},1}, 98:122) with eltype Union{Missing, Float64} with indices 98:122:
 0.31637
 0.33726
 0.35952
 0.37749
 0.39632
 0.41631
 0.43748
 0.45913
 0.48215
 0.50662
 0.53263
 0.56026
 0.58959
 0.62074
 0.6538
 0.68891
 0.72615
 0.76567
 0.80759
 0.85205
 0.89922
 0.94922
 1.0
  missing
  missing

julia> omega(cso_2001.select[98])
122

MortalityTables.table return type is any?

I would like to press ctrl+space after writing the following code:

vbt2001 = MortalityTables.table("2001 VBT Residual Standard Select and Ultimate - Male Nonsmoker, ANB")
vbt2001. # Press ctrl + space here

and see that there are select and ultimate rates available to me. The guidance on declaring return types is confusing me. This seems to work fine -

Screen Shot 2021-10-19 at 12 57 49 AM

But this seems to be causing problems -

Screen Shot 2021-10-19 at 1 06 07 AM

Inspecting the return type of a function is not a thing in Julia?

Refine AutoDifferentiability

A few related things:

  • survival(table,from,to) isn't AD'able because that method only operates on integer arguments. Results in a stackoverflow error.
  • At the transition point between partial ages, the deriv goes to zero:

image

Is there a way to generalize decrement and survival to match the integer-age approach at integral ages but avoid the discreteness in the AD? Does it require making the survival curve parametric? An alternative to Balducci/Constant/Uniform?

.table() not defined

I have a few problems with your package;

  1. No help:
    MortalityTables.jl has no docstrings, no help nor methods registered.

  2. Althought the tables are accessible with MortalityTables.tables(), the method table() is not found:

using MortalityTables

table = MortalityTables.table("2001 VBT Residual Standard Select and Ultimate - Male Nonsmoker, ANB")
>> ERROR: UndefVarError: table not defined

I installed the library as follow;

>> julia:  ]
>> julia (pkg): add MortalityTables

Long, tidy version of tables

End goal of #109

Preliminary work completed in example here: https://juliaactuary.org/tutorials/mortalitytablesdataframe/

"""
	long(m::MortalityTable)

Return an array of tuples containing `issue_age`,`attained_age`,`duration`,`select` rate, and `ultimate` rate.

"""
function long(m::MortalityTables.SelectUltimateTable)
	earliest_age = min(firstindex(m.select),firstindex(m.ultimate))
	last_age = max(lastindex(m.select),lastindex(m.ultimate))
	
	table = map(earliest_age:last_age) do issue_age
		map(issue_age:last_age) do attained_age
			# use `get` to provide default missing value
			ultimate = get(m.ultimate,attained_age,missing)
			if issue_age <= lastindex(m.select)
				select = get(m.select[issue_age],attained_age,missing)
			else
				select = missing
			end
			duration = attained_age - issue_age + 1
			(;issue_age,attained_age, duration, select,ultimate)
		end
	end
	
	vcat(table...)
		
	
end

"""
	long(m::MortalityTable)

Return an array of tuples containing `issue_age`,`attained_age`,`duration`,`select` rate, and `ultimate` rate.

"""
function long(m::MortalityTables.UltimateTable)
	earliest_age = firstindex(m.ultimate)
	last_age = lastindex(m.ultimate)
	
	table = map(earliest_age:last_age) do issue_age
		map(issue_age:last_age) do attained_age
			# use `get` to provide default missing value
			ultimate = get(m.ultimate,attained_age,missing)
			select = missing
			duration = attained_age - issue_age + 1
			(;issue_age,attained_age, duration, select,ultimate)
		end
	end
	
	vcat(table...)
		
	
end

To-dos

  • tests
  • is long the right function name?
  • what about irregular tables (#107)

Underyling structure of Mortality Tables

I've considered several different implementations for how to store the underlying data of a Mortality Table.

Some desired characteristics

  • Performant
  • Supports missing values (e.g. table 1118, which is missing young ages/durations) or tables without child rates
  • Tractable error messages
  • Quick calculation of metadata, e.g. omega (ie the last age defined)
  • Pleasant indexing syntax (e.g. be able to return durations 1:30 in one call)
  • Indexed from 0 for age, and from 1 for duration

Implementations considered

OffsetArrays.jl

  • Performant
  • Supports missing values (e.g. table 1118, which is missing young ages/durations) or tables without child rates
  • Tractable error messages
  • Quick calculation of metadata, e.g. omega (ie the last age defined)
  • Pleasant indexing syntax (e.g. be able to return durations 1:30 in one call)

DimensionalData.jl

DefaultDicts (from DataStructures.jl)

Built-in arrays

Built-in Dicts

notes are WIP

Error handling on nonexistent tables

MortalityTables.table("Hello World")

Yields an error like this for me:

ArgumentError: ArgumentError: invalid index: nothing of type Nothing

Stacktrace:
  [1] to_index(i::Nothing)
...

Can this error be handled in a more informative way?

Irregular tables

Errors on some tables

using MortalityTables
MortalityTables.table("2012 IDEC Select Termination Rates - Male, Occ Cl 1, Acc and Sick, 14 day EP")
MortalityTables.table("Guatemala Abridged Life Tables 1980-85 Males")
  • Distinguish between tables that will have a custom mortality-table specific API and those that should not. Tables that cannot be parsed into the existing API will inform the user that they are trying to load a table that is not a supported table.
  • Provide a general API for all tables. When parsing the XTbML the only assumption we are making is that it is a valid XTbML file.

Make loading tables (ie calling `MortalityTables.tables()`) faster

With 250+ tables, it takes up to 10 seconds to load all of the tables into memory.

I haven't profiled the call, but I would speculate that most of the time is spent parsing the whole XML into a dict. The current process:

This happens in the file XTbML.jl, starting with the tables function:

  1. Loop through and open each file
  2. Use XMLDict package to parse the XML into a Dict (I did this so it would be easier to work with than the XML tree)
  3. Populate three other DefaultDicts (with the default being missing) by looping throug the values in the the three DefaultDicts :
    • One for the metadata
    • One for the select values
    • One for the ultimate values
  4. Loop through and create OffsetArrays (so that ages can start at 0) for both the select and ultimate tables, ultimately returning a MortalityTable type for each source file.

Non-monotonicity in `survivorship` for fractional years

This seems slightly odd and like a bug:

using MortalityTables, Plots

tables = MortalityTables.tables()
tab_now = tables["2001 CSO Preferred Select and Ultimate - Female Nonsmoker, ALB"]

p = plot()
for a ∈ 95:0.6:98
    plot!(p, [survivorship(tab_now.ultimate, a, x, MortalityTables.Balducci()) 
        for x ∈ a:0.1:120], label = "$a", xlim = (0,24), xlabel = "Months", 
            ylabel = "Survivorship")
end
p

Produces:
image

I've confirmed that this problem exists for different ages, different mortality tables, and all methods of splitting up the year (Uniform, Constant, and Balducci).

Is this a bug or am I doing something I shouldn't be doing?

Mortality multiples?

Let me start off by saying really nice package, I'm not an actuary but this is really easy to work with!

Are there any thoughts as to the implementation of mortality multiples in the package?

A bit of background: I've got a set of insured lifes with current age and a given life expectancy. This life expectancy is lower than what would be implied by any table (which I do by finding the first survivorship < 0.5).

Googling around a bit it appears that people are actually just multiplying mortality by some constant and capping things at 1.0, which seems a little less than optimal?

Not sure whether this kind of functionality would be a good fit for this package, but thought I'd throw it out there.

As a side note:
One thing I've been doing (not sure how great an idea this is though) is to basically find the age at which life expectancy equals the given life expectancy, and then using the survival probabilities from that age onwards, so basically:

# Objective function
given_LE = [5.9]
obj(x; given_LE = given_LE) = abs(0.5 - survivorship(male_table.ultimate, x, x+given_LE[1], 
                                                    MortalityTables.Uniform()))

# Find age between 60 and 110 at which LE equals the given LE
implied_age = optimize(obj, 60.0, 110.0).minimizer

TagBot trigger issue

This issue is used to trigger TagBot; feel free to unsubscribe.

If you haven't already, you should update your TagBot.yml to include issue comment triggers.
Please see this post on Discourse for instructions and more details.

If you'd like for me to do this for you, comment TagBot fix on this issue.
I'll open a PR within a few hours, please be patient!

Recommend Projects

  • React photo React

    A declarative, efficient, and flexible JavaScript library for building user interfaces.

  • Vue.js photo Vue.js

    🖖 Vue.js is a progressive, incrementally-adoptable JavaScript framework for building UI on the web.

  • Typescript photo Typescript

    TypeScript is a superset of JavaScript that compiles to clean JavaScript output.

  • TensorFlow photo TensorFlow

    An Open Source Machine Learning Framework for Everyone

  • Django photo Django

    The Web framework for perfectionists with deadlines.

  • D3 photo D3

    Bring data to life with SVG, Canvas and HTML. 📊📈🎉

Recommend Topics

  • javascript

    JavaScript (JS) is a lightweight interpreted programming language with first-class functions.

  • web

    Some thing interesting about web. New door for the world.

  • server

    A server is a program made to process requests and deliver data to clients.

  • Machine learning

    Machine learning is a way of modeling and interpreting data that allows a piece of software to respond intelligently.

  • Game

    Some thing interesting about game, make everyone happy.

Recommend Org

  • Facebook photo Facebook

    We are working to build community through open source technology. NB: members must have two-factor auth.

  • Microsoft photo Microsoft

    Open source projects and samples from Microsoft.

  • Google photo Google

    Google ❤️ Open Source for everyone.

  • D3 photo D3

    Data-Driven Documents codes.