Giter VIP home page Giter VIP logo

juliadatascience's Introduction

Julia Data Science

Open source and open access book for data science in Julia.

CI Build CC BY-NC-SA 4.0 Code Style: Blue

You can read the full book on https://juliadatascience.io.

This book was once available on Amazon, but due to an absurd reason, our publishing account was terminated, and our book was removed. Interestingly, all Amazon customer accounts remain functional. It seems that our removal may have been a result of not selling enough books. Nevertheless, the book and its PDF version can still be accessed in their entirety on this website.

LICENSE

This book is licensed under Creative Commons Attribution-NonCommercial-ShareAlike 4.0 International.

CC BY-SA 4.0

Also using an image from the Love pack by Freepik at Flaticon.

juliadatascience's People

Contributors

cormullion avatar dependabot[bot] avatar ederag avatar github-actions[bot] avatar guixinliu avatar harrisonmetz avatar jariji avatar kevindasilvas avatar knuesel avatar lazarusa avatar mo-gul avatar nmlebedev avatar pitmonticone avatar rcqls avatar rikhuijzer avatar simonp0420 avatar storopoli avatar vmikk avatar

Stargazers

 avatar  avatar  avatar  avatar  avatar  avatar  avatar  avatar  avatar  avatar  avatar  avatar  avatar  avatar  avatar  avatar  avatar  avatar  avatar  avatar  avatar  avatar  avatar  avatar  avatar  avatar  avatar  avatar  avatar  avatar  avatar  avatar  avatar  avatar  avatar  avatar  avatar  avatar  avatar  avatar  avatar  avatar  avatar  avatar  avatar  avatar  avatar  avatar  avatar  avatar  avatar  avatar  avatar  avatar  avatar  avatar  avatar  avatar  avatar  avatar  avatar  avatar  avatar  avatar  avatar  avatar  avatar  avatar  avatar  avatar  avatar  avatar  avatar  avatar  avatar  avatar  avatar  avatar  avatar  avatar  avatar  avatar  avatar  avatar  avatar  avatar  avatar  avatar  avatar  avatar  avatar  avatar  avatar  avatar  avatar  avatar  avatar  avatar  avatar  avatar

Watchers

 avatar  avatar  avatar  avatar  avatar  avatar  avatar  avatar  avatar  avatar  avatar  avatar

juliadatascience's Issues

makie.jl: ERROR: LoadError: UndefVarError: Downloads not defined

Hi,

I get an

ERROR: LoadError: UndefVarError: Downloads not defined
Stacktrace:
 [1] top-level scope
   @ o:\Julia\makie.jl:604
in expression starting at o:\Julia\makie.jl:604

Commented out.

And on execution for all demo functions:

ERROR: UndefVarError: Options not defined
Stacktrace:
 [1] custom_plot()
   @ Main o:\Julia\makie.jl:16
 [2] top-level scope
   @ REPL[12]:1

Commented out.

On execution,

custom_plot()

no error, no plot appears.

Add Section "About the Authors"

We should add somewhere a section "About the Authors" with a picture and a brief bio.

It helps to establish a nice connection of the reader to the book and the authors.

Different repo for version 2?

Guys,
probably is too early, but I have some material using Flux that I would like to start putting up. Not revision necessary yet, just starting material (more like notes), but it will be definitely breaking changes. Could we have a different repo within the organisation for that?

Typo at page 69 of the PDF version

As in the web version, where its written:

DataFrame(σ = ["a", "a", "a"], δ = [π, π/2, π/3])

The PDF version reads:

DataFrameσ( = ["a", "a", "a"], δ = π[, π/2, π/3])

page 69 Chapter 4 DataFrames.jl

Add Revise.jl somewhere

In the past, I've been verbal about the fact that Revise.jl isn't promoted enough. So, I should write a bit about the REPL workflow and some pointers to Pluto.jl etc.

Spelling: Mixmatch and Usecases

Fix two spelling confusions:

  • mixmatch to mix and match according to en.wiktionary.org/wiki/mixmatch
  • usecases to use cases according to en.wikipedia.org/wiki/Use_case

Thanks @rikhuijzer!

Add Lazaro Alonso as a Coauthor

  • Package.toml
  • Config.toml
  • metadata.yaml
  • JuliaDataScience org
  • README.md
  • index.md
  • Prepare his Acknowledgements
  • Add him to the Google Analytics

[dataframes_performance] Speed and Memory Allocation

Here some thoughts on this section.

The first sentence of this section shows the word "fast" in bold. Speed is also the first thing I think of in context of performance. Unfortunately there are "only" shown comparisons of memory allocations. Of course this is also an important point (when data are that big that there is not enough memory available to hold it), but even more importantly would be speeeeeeeeed.

Is there a particular reason why you "only" show @allocated and not (also) @time and/or @benchmark from BenchmarkTools.jl (didn't try that package so far)?

A test of using @time instead of @allocated for the given examples showed that there was little to no improvement or even the "better" code (needing less memory) took longer. Maybe this is (only) due to the very small sample data used in the examples.?

From VBA (that is the only language I know a little bit (if you consider that being a programming language)) I heard that it could even be possible that using "non-optimal" types can take longer, although they allocates less memory. To be concrete, that is said to be the case when using Integer compared to Long (corresponding to Int16 and Int32 in Julia). Long should be most efficient, because (modern) processors on current platforms perform operations in that precision. Thus, internally each other type is first converted to the "optimal" type and after the operations back to the input type. When this should be true it is obvious that the two additional conversion steps would take extra time.

From what I have tested so far about this topic in VBA, on my computer I couldn't really find a (big/significant) difference between the calculation times. Any insides regarding that topic in Julia?

Add split-apply-combine

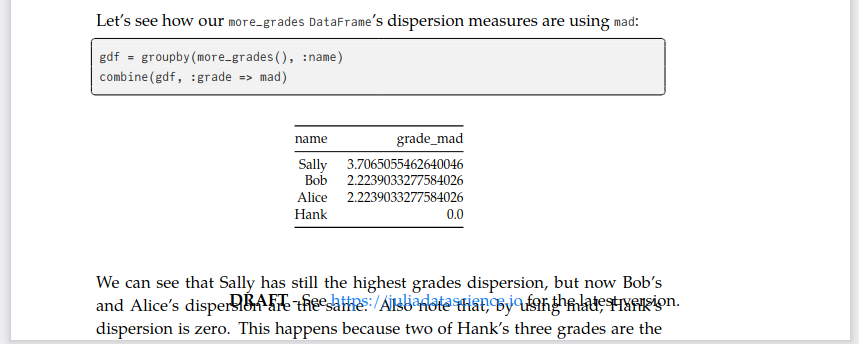
For example, to calculate the score per group for various columns.
To make the example come alive, maybe come up with something about fields with plants.
Note that the dot in the combine is a bit tricky to figure out.

julia> df = DataFrame(group = [:A, :A, :B, :B], X = [1, 2, 3, 4], Y = [5, 6, 7, 8])
4×3 DataFrame
 Row │ group   X      Y
     │ Symbol  Int64  Int64
─────┼──────────────────────
   1 │ A           1      5
   2 │ A           2      6
   3 │ B           3      7
   4 │ B           4      8

julia> gdf = groupby(df, :group)
GroupedDataFrame with 2 groups based on key: group
First Group (2 rows): group = :A
 Row │ group   X      Y
     │ Symbol  Int64  Int64
─────┼──────────────────────
   1 │ A           1      5
   2 │ A           2      6
⋮
Last Group (2 rows): group = :B
 Row │ group   X      Y
     │ Symbol  Int64  Int64
─────┼──────────────────────
   1 │ B           3      7
   2 │ B           4      8

julia> combine(gdf, [:X, :Y] .=> mean; renamecols=false)
2×3 DataFrame
 Row │ group   X        Y
     │ Symbol  Float64  Float64
─────┼──────────────────────────
   1 │ A           1.5      5.5
   2 │ B           3.5      7.5

Justified Text

I think the book should have justified text, right now the text is left-aligned. See pic below for a clarification:

improve typographical stuff

As I already stated in e.g. e8e1d11 it would nice to make some sections unnumbered when there is no second section on that level.

When I have seen this correct, this should be possible by appending the section entry by {-} as e.g. can be seen in

So if you consider it would be nice to have that I'll redo the suggestions in a new PR. Especially if it is that easily doable.


PS:
I am not sure if my newest comments in #217 have been noticed by one of you, since I have added them after the PR was merged. Thank you for your comments!

Packages index

It might be good idea to add a packages index at the back of the book. For example, that way, people who quickly want to know how CSV.jl works can look in the index and jump to the right page.

Issues in the DataFrames section

  • Filter doesn't "remove rows" only filter! does
  • Introduce column selectors and ?select.
  • CategoricalArrays.jl should have a section for itself.
  • transform(df, ...; renamecols=false)
  • example of both filter and subset with multiple conditions, as in:
     filter(row -> row.col1 >= something1 && row.col2 <= something2, df)
     # and:
     subset(df, :col1 => ByRow(>=(something1)), :col2 => ByRow(<=(something2)))
  • cover vector of Symbols as a col selector in the dataframes_select.md

inversion judea and noam

in the file why_julia.md, line 250, there is an inversion between Judea and Noam

That was not what judea as a Linguist type would say to noam, a ComputerScientist type.

Judea is the computer scientist and Noam the linguist. Moreover according to the line before it is Noam who speak to Judea, so I guess the line should be:

That was not what noam as a Linguist type would say to judea, a ComputerScientist type.

Statistics Chapter

A final chapter with basic statistics using both DataFrames.jl and Makie.jl. Each concept we should give the intuition behind it and also get into mathematical details.

We should cover:

  • Statistics: Quick Intro and Importance
  • Central Tendencies Measures: mean, median and mode
  • Dispersion Measures: standard deviation, variance, mean absolute deviation, quartile and IQR
  • Dependence Measures: Correlation and Covariance
  • Distributions
    • Normal vs Non-Normal
    • Discrete vs Continuous
    • PDF
    • CDF
  • Statistical Visualizations
    • Box plots
    • Histograms
    • Density plots
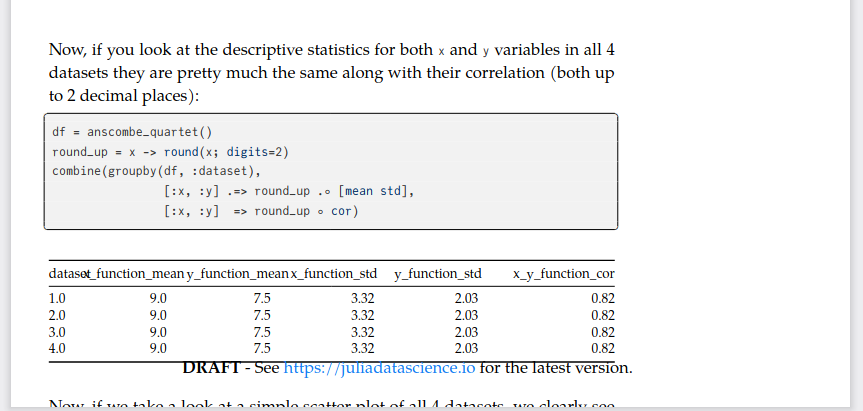
    • Anscombe Quartet

Notation discussion points

Notation discussion points from #20:

  1. Always using : before the start of a code block.
  2. Mentioning functions like DataFrame as DataFrame() or DataFrame(...).
  3. My suggestion: only Julia objects between backticks and filenames and extension names between quotation marks (like Julia's strings).

Incorrect statement on keyword arguments

From the webpage:
image

But defining a function with a keyword argument without default values is no problem:

julia> f(x; y) = x^2+y
f (generic function with 1 method)

julia> f(2, y=10)
14

Am I misunderstanding, or is the statement from the book simply wrong?

[dataframes_select] not the same selection

The lines

Note how `q5` is now the first column in the `DataFrame` returned by `select`.
There is a more clever way to achieve the same using `:`.
The colon `:` can be thought of as "all the columns that we didn't include yet".
For example:
```jl
s = """select(responses(), :q5, :)"""
sco(s, process=without_caption_label)
```

don't give the same result as the previous example ... (where :id is not shown)

I think you need to rephrase the text.

is creating functions to avoid multiple variables really a good choice?

Hello there!

In the 4th chapter we find the comment bellow

NOTE: This works, but there is one thing that we need to change straight away. In this example, we defined the variables name, grade_2020 and df in global scope. This means that these variables can be accessed and edited from anywhere. If we would continue writing the book like this, we would have a few hundred variables at the end of the book even though the data that we put into the variable name should only be accessed via DataFrame! The variables name and grade_2020 where never meant to be kept for long! Now, imagine that we would change the contents of grade_2020 a few times in this book. Given only the book as PDF, it would be near impossible to figure out the contents of the variable by the end. We can solve this very easily by using functions.

Is that really necessary? I think its way more readable to let what is being explained outside a function. I think it would be better for each chapter to have a single Jupyter Notebook. For an example, Ch4_dataframes.ipynb, where every variable would be constrained in this chapter, avoiding the variable to be accessed anywhere.

Usage of `limits!`

Hi,

This is a great introduction book! The Makie part is also the first systematic introduction to the plotting library I've seen so far.

I have a question about the usage of limits! in the examples. I've seen many places where the limits are set without the axis type, e.g. the code for Figure 8

fig, ax, pltobj = scatter(xyvals[:, 1], xyvals[:, 2]; color=xyvals[:, 3],
    label="Bubbles", colormap=:plasma, markersize=15 * abs.(xyvals[:, 3]),
    figure=(; resolution=(600, 400)), axis=(; aspect=DataAspect()))
limits!(-3, 3, -3, 3)
Legend(fig[1, 2], ax, valign=:top)
Colorbar(fig[1, 2], pltobj, height=Relative(3 / 4))

When I tried to run the code locally, I got

julia> limits!(-3., 3., -3., 3.)
ERROR: MethodError: no method matching limits!(::Float64, ::Float64, ::Float64, ::Float64)

and it hinted to me to add the axis type as the 1st argument as

limits!(ax, -3, 3, -3, 3)

I used GLMakie but not CairoMakie for running the code. Is this due to the library version I'm using? GLMakie v0.1.30

Proof-reading

Hi there! I enjoyed reading the PDF of this book, and I think you've done a great job, and it looks impressive.

As I read through, I picked up some typos and grammatical awkwardnesses. Would you prefer me to list them separately in an issue, or make a PR to the source Markdown files? (I don't know whether you can selectively accept and reject various edits in a PR, so I'm not sure what's best...)

[DataFrames] Performance

  • Allocations: functions with a shebang ! versus without (e.g., filter! versus filter)
  • Copying vs not copying: df[!, col] versus df[:, col] (link)
  • CSV.jl reading a lot of .csv files with the new version 0.9 and passing a vector of Strings, details here
  • CSV.File versus CSV.read. Details in the index of the CSV.jl documentation
  • CategoricalArrays.jl compression with compress=true

Clarify our future plans to readers

From some valuable suggestions by Evgeny Pogrebnyak on Twitter (https://twitter.com/PogrebnyakE/status/1435707529137463302). Evgeny argues that a book title "Julia Data Science" should contain more than just plotting and dataframes transformations. We need to clarify to readers that for version 2, we plan to add:

  • Statistics (for example, GLM.jl and HypothesisTests.jl)
  • AlgebraOfGraphics.jl
  • Machine Learning (MLJ.jl)
  • maybe other things?

Text inconsistent with code

Hi. @rikhuijzer .

I found text there can not match up with the following code.

With this, we can add a column saying whether someone was approved by the criterion that all of their grades were above 5.5:
```jl
s = """
pass(A, B) = [5.5 < a || 5.5 < b for (a, b) in zip(A, B)]
transform(leftjoined, [:grade_2020, :grade_2021] => pass; renamecols=false)
"""
sco(s; process=without_caption_label)
```

More specifically, you said all of their grades in the text , but you used boolean OR operator || in the code.
My suggestion is the least change, namely all -> any.

Add an amazon review banner

Hey folks, you all should add a big banner on the book page asking folks to leave a review on Amazon. This will help increase the visibility of the book significantly!

[dataframes_indexing] Not an anonymous function

From what I have learned so far there is no "anonymous function" in

Now, to show **why anonymous functions are so powerful**, we can come up with a slightly more complex filter.
In this filter, we want to have the people whose names start with A or B **and** have a grade above 6:
```jl
s = """
function complex_filter(name, grade)::Bool
interesting_name = startswith(name, 'A') || startswith(name, 'B')
interesting_grade = 6 < grade
interesting_name && interesting_grade
end
"""
sc(s)
```
```jl
s = "filter([:name, :grade_2020] => complex_filter, grades_2020())"
sco(s; process=without_caption_label)
```

When I am correct you declare a function that is then used in filter. The => should be the Pair operator while -> is the operator to define an anonymous function, right?

If I am correct, please rephrase the text or adapt the example code.
If I am wrong, shame on me and I am not a good "student" and sorry for the noise.

Launch the Printed Book at Amazon.com

We need to:

  • Normalize functions and syntax to blue codestyle, also accordingly to DataFrames, Plots, Makie, AoG docs
  • Create a PDF with syntax highlighting (#15)
  • Create an Author Profile at Amazon.com (both @storopoli, @rikhuijzer and @lazarusA )
  • Get a ISBN (Amazon Provides a free one)
  • Adapt the book to Amazon.com format
  • Create cover (#148)
  • Write a summary
  • Tag a "first edition" release on this repository

Finish README.md

Make a README.md for the first edition

  • Add some text from juliadatascience.io homepage without copy-pasting (automated, fool-proof thing)
  • Book cover
  • Link to Amazon.com Book
  • Cheatsheets that @lazarusA created (link the README to the image to the book)

Citation Information

We should provide citation information in index.md and also on README.md with biblatex and APA (psychology, social sciences etc.), IEEE (computer science).

Overview of Plots.jl Chapter

Here is an opinionated version. Feel free to criticize:

Subsections for Plots

Brief overview of the JuliaPlots ecosystem

  • JuliaPlots Organization
  • Plots.jl (what is it good for and what are its limitations)
  • Makie.jl (what is it good for and what are its limitations)
  • AlgebraOfGraphics.jl (what is it good for and what are its limitations) (version 2.0)
  1. What is Plots.jl?

    • plot vs plot!
    • input data
    • Series Types and functions(e.g. line, line!, heatmap, heatmap!)
    • How to save a plot
  2. Attributes

    • Overview (What are attributes, and the whole symbol e.g. :xticks system)
    • Series attributes
    • Plot Attributes
    • Footnote about the extra_kwargs stuff
    • Examples using the most common things that you want to do in a visualization. This could be inserted right after you introduce a specific attribute.
  3. Color and Palettes
    I think we should cover colorbrewer and the ones from matplotlib (inferno, viridis, magma).
    We should cover some stuff from the Claus Wilke Fundamentals of Data Visualization book (Chapters 4 and 19). Also we should cover the three types of color usage:

    1. sequential: continuous stuff, e.g. :blues (only blue)
    2. diverging: continuous stuff, e.g. :RdBu (from red to blue)
    3. distinguishable: discrete stuff, e.g. :Set1_5

    I have a very strong positive bias towards colorbrewer Sets (e.g. palette=:Set1_5).

    We should also mention that the reader should use a colorblinded-friendly palette or colors. Maybe we should include an official statistics regarding the prevalence of any sort of colorblindness or color difficulties in the population. I remember seeing somewhere that it was around 5% of people.

  4. Layouts

    • Overview on several ways to do layouts
    • the layout argument, also cover the grid
    • the @layout macro
    • specific measures with the Plots.PlotMeasures submodule
    • adding subplots incremententally. Define p1, p2, p3; then do a plot(p1, p2, p3; layout=l)

Show roadmap to reader

See #110.

It should be on the front page and somewhere in the PDF which is hidden for the Amazon version.

It should not be in the Amazon book.

DataFrames regex indexing

Add DataFrames regex. From Kevin Bonham on Slack:

I've done this ❤️ before, but Regex column selection in DataFrames... I'm just doing some data wrangling on a table with hundreds of columns with really stupid and inconsistent names... being able to do df[!, r"pattern"i] to just ignore different capitalization and find multiple things saves SO much time

embed mp4 video

These lines of code work. You can embed a video in markdown (html). if one uncomments these lines, then it will work locally. But, it will fail in CI and the pdf generation.
Ideally, it will be good to allow the animation online, and print the first frame into the pdf version(probably too much to ask).

Implement cormullion's suggestions for the front cover

In #148 (comment), cormullion suggested

image

In #148, this was partially implemented. To implement it further, the font could be changed to Barlow (#148 (comment)) which involves ensuring that the font is available locally and in CI and a solution is required for properly placing text. I personally think that Makie isn't the best tool for text placement, but we'll might get it right with lots of fiddling.

Logo for Julia Data Science Organization

We need a logo I will talk to someone who can do that for me at UNINOVE. Any thoughts @rikhuijzer ? We should move anything stats/Bayesian so to not confuse with future endeavors.

Maybe something with Tabular Data or Line Plots. We should definitely use Julia colors.

  • Update JuliaDataScience GitHub Organization Logo
  • Update JuliaDataScience Book favicon site icon

Recommend Projects

  • React photo React

    A declarative, efficient, and flexible JavaScript library for building user interfaces.

  • Vue.js photo Vue.js

    🖖 Vue.js is a progressive, incrementally-adoptable JavaScript framework for building UI on the web.

  • Typescript photo Typescript

    TypeScript is a superset of JavaScript that compiles to clean JavaScript output.

  • TensorFlow photo TensorFlow

    An Open Source Machine Learning Framework for Everyone

  • Django photo Django

    The Web framework for perfectionists with deadlines.

  • D3 photo D3

    Bring data to life with SVG, Canvas and HTML. 📊📈🎉

Recommend Topics

  • javascript

    JavaScript (JS) is a lightweight interpreted programming language with first-class functions.

  • web

    Some thing interesting about web. New door for the world.

  • server

    A server is a program made to process requests and deliver data to clients.

  • Machine learning

    Machine learning is a way of modeling and interpreting data that allows a piece of software to respond intelligently.

  • Game

    Some thing interesting about game, make everyone happy.

Recommend Org

  • Facebook photo Facebook

    We are working to build community through open source technology. NB: members must have two-factor auth.

  • Microsoft photo Microsoft

    Open source projects and samples from Microsoft.

  • Google photo Google

    Google ❤️ Open Source for everyone.

  • D3 photo D3

    Data-Driven Documents codes.