k-phoen / grabana Goto Github PK
View Code? Open in Web Editor NEWUser-friendly Go library for building Grafana dashboards
License: MIT License
User-friendly Go library for building Grafana dashboards
License: MIT License
Hi, in newer versions of Grafana if you want to use the Heatmap from Prometheus histogram you need to set the heatmap to "calculate": true, otherwise it does not work.
Could it be added to the heatmap options? 🙏
Hey @K-Phoen,
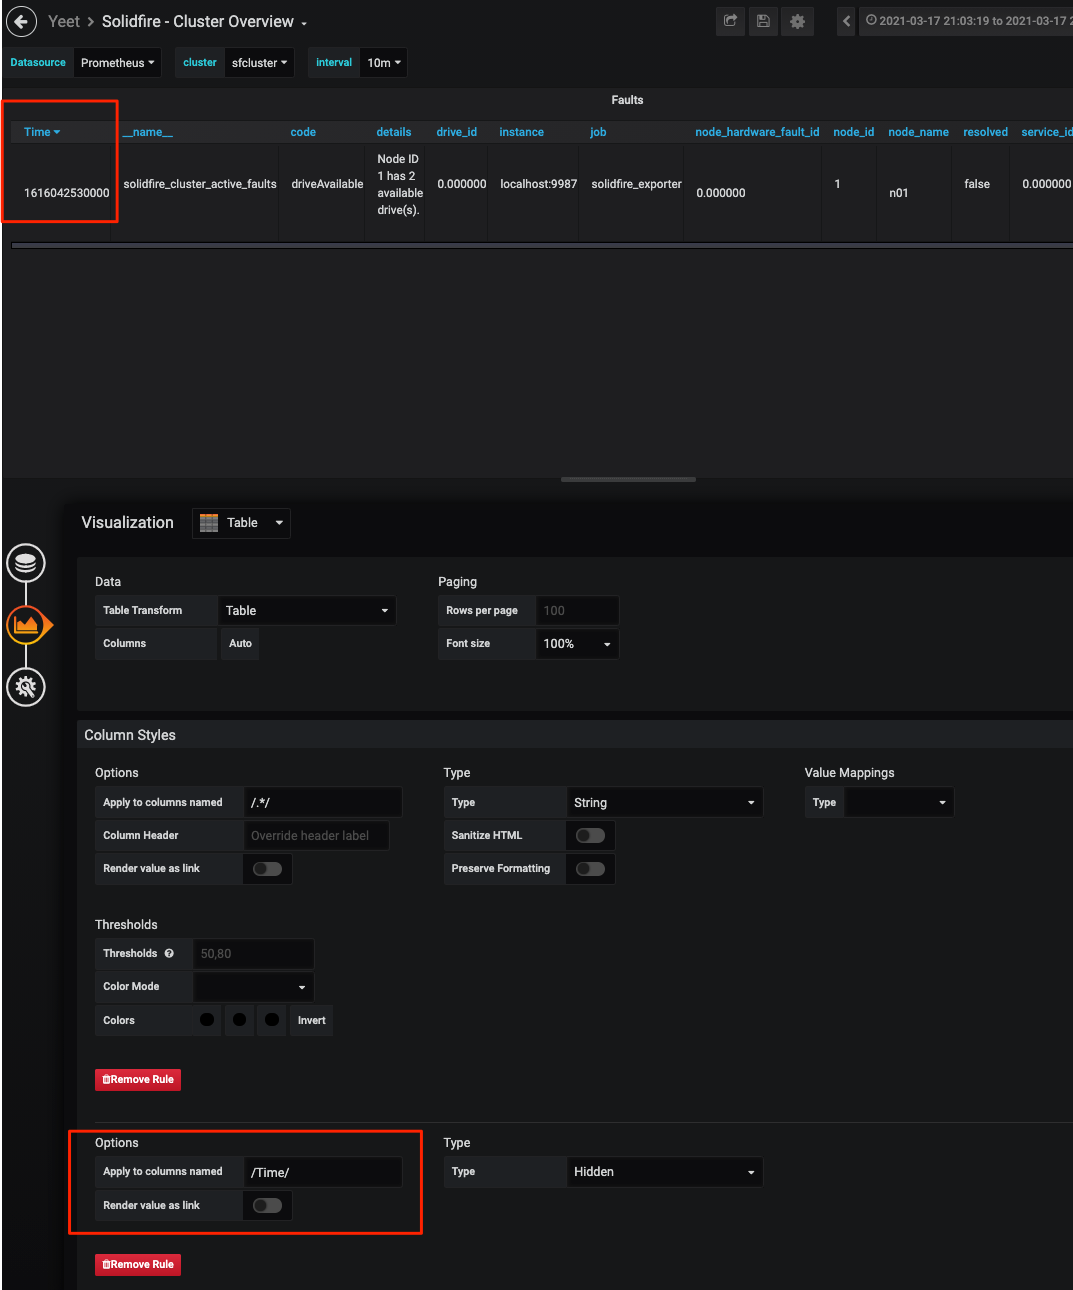
I'm attempting to port some of my existing dashboards to be built using this grabana library and I'm running into an issue with tables.
Expected Behaviour:
table.HideColumn("MyColumn") function, I should be able to hide a table column.Actual Behaviour:
/.*/ "string" rule takes precedence and my column style rule is never evaluated.Additional Details:
Code:
row.WithTable("Faults",
				table.DataSource("$datasource"),
				table.HideColumn(`/Time/`),
				table.WithPrometheusTarget(`solidfire_cluster_active_faults{sfcluster=~"$cluster"}`,
					prometheus.Instant(),
					prometheus.Format(prometheus.FormatTable),
				),
				table.Span(12),
			),
I should note that I'm currently using Grafana 6.5.1 and v0.13.0 of grabana.
I suspect that this behaviour is happening because of the default rule that gets inserted by the New() function in the table package.
// New creates a new table panel.
func New(title string, options ...Option) *Table {
	panel := &Table{Builder: sdk.NewTable(title)}
	empty := ""

	panel.Builder.IsNew = false
	panel.Builder.TablePanel.Styles = []sdk.ColumnStyle{
		{
			Alias:   &empty,
			Pattern: "/.*/",
			Type:    "string",
		},
	}

	for _, opt := range append(defaults(), options...) {
		opt(panel)
	}

	return panel
}
While building the table with the /.*/ default column style matches what Grafana UI gives us 'out of the box', having no way to remove this top-level rule is blocking me from achieving hiding any column in my table.
If there is a way to remove this tableColumnStyle rule that gets auto-inserted please let me know. If there is no way right now, does the library require additional methods to 'reset' the table columns (or similar functionality?).
I'm not 100% sure but am i right in assuming that as of today, Cloudwatch datasource will not work as is?
what would it take to support it? i'm guessing i could follow one of the current datasources as an example to implement this. Does it make sense?
Hi,
I'm trying to query an influxdb datasource with some specific parameters in the targets.
I'm always getting a 500 error. The main difference between using Grabana and other libraries like grafanalib of grafonnet is that at least I need to set up in the target at least 2 parameters (query, and rawQuery)
For instance:
query: 'SELECT value FROM autogen.cpu_idle WHERE value::field > 1 GROUP BY hostName::tag ORDER BY time ASC',
rawQuery: true,
Do you have a working example of using influxdb as a datasource (InfluxQL) in the dashboard YAML definitions? @K-Phoen this is a really nice project!
Thanks!
Hi all,
I tried following the example code but got the following error.
[ykyuen@camus ci-grafana]$ go run main.go
Could not create dashboard: could not prepare deletion of previous alerts for dashboard: invalid character '<' looking for beginning of value
exit status 1
I tried on grafana version 7.3.1 and 6.7.1. Both results in the above error but the dashboard is created correctly.
The following is my main.go.
package main

import (
	"context"
	"fmt"
	"net/http"
	"os"

	"github.com/K-Phoen/grabana"
	"github.com/K-Phoen/grabana/dashboard"
	"github.com/K-Phoen/grabana/row"
	"github.com/K-Phoen/grabana/graph"
	"github.com/K-Phoen/grabana/target/prometheus"
	"github.com/K-Phoen/grabana/variable/interval"
)

func main() {
	const GRAFANA_URL = "http://localhost:3000"
	const GRAFANA_API_KEY = "<GRAFANA_API_KEY>"

	ctx := context.Background()
	client := grabana.NewClient(&http.Client{}, GRAFANA_URL, grabana.WithAPIToken(GRAFANA_API_KEY))
	// Create the folder holding the dashboard for the service
	folder, err := client.FindOrCreateFolder(ctx, "Testing")
	if err != nil {
		fmt.Printf("Could not find or create folder: %s\n", err)
		os.Exit(1)
	}
	builder, err := dashboard.New(
		"Awesome dashboard",
		dashboard.AutoRefresh("5s"),
		dashboard.Tags([]string{"generated"}),
		dashboard.VariableAsInterval(
			"interval",
			interval.Values([]string{"30s", "1m", "5m", "10m", "30m", "1h", "6h", "12h"}),
		),
		dashboard.Row(
			"Prometheus",
			row.WithGraph(
				"HTTP Rate",
				graph.DataSource("prometheus-default"),
				graph.WithPrometheusTarget(
					"rate(prometheus_http_requests_total[30s])",
					prometheus.Legend("{{handler}} - {{ code }}"),
				),
			),
		),
	)
	if err != nil {
		fmt.Printf("Could not build dashboard: %s\n", err)
		os.Exit(1)
	}
	dash, err := client.UpsertDashboard(ctx, folder, builder)
	if err != nil {
		fmt.Printf("Could not create dashboard: %s\n", err)
		os.Exit(1)
	}
	fmt.Printf("The deed is done:\n%s\n", GRAFANA_URL + dash.URL)
}
Any idea on what i have missed? Thanks for working on this project.
Regards,
Kit
Hi, I see there is no support for gridPos for panels, this is not even in the SDK.
Only the old span parameter.
Interesting is that the grafana-tools/sdk supports this, I'm not sure how much is your fork of the SDK different from the original repo, but in some things it looks like the original one is a bit more up to date with the upstream dashboard JSON model.
Is there any particular reason that the fork is used? 🤔
Panel has f.E.: timeseries.Repeat but timeseries.RepeatDirection (v|h) is missing and is also missing at Builder struct
Knowing this is primary a tool for provisioning dashboards, I think it would be also great to also support alerts.
Edit: Seems there can be alerts in the dashboard but I'm getting could not delete previous alerts for dashboard when applying alert
Would it be possible to repeat a panel on a single row, so that we can have cpu per datacenter on one row, memory per datacenter on the next etc.
大佬,你好。我想在创建面板时进行判断要不要创建,但是现在都是在new函数里面创建的,无法进行判断,请问有什么比较好的解决办法嘛?
Legends, draw modes, ...
Hello!
Current behaviour
builder1 := dashboard.New(
    "dashboard 1",
    dashboard.Row(
        "Prometheus",
        row.WithGraph(
            // some data
        ),
    ),
)
builder2 := dashboard.New(
    "dashboard 2",
    dashboard.Row(
        "Prometheus",
        row.WithGraph(
            // some data
        ),
    ),
)

fmt.Printf("%d\n", builder1.Internal().Rows[0].Panels[0].ID)
// 1
fmt.Printf("%d\n", builder2.Internal().Rows[0].Panels[0].ID)
// 2
Expected behaviour
Numbering is independent:
builder1 := dashboard.New(
    "dashboard 1",
    dashboard.Row(
        "Prometheus",
        row.WithGraph(
            // some data
        ),
    ),
)
builder2 := dashboard.New(
    "dashboard 2",
    dashboard.Row(
        "Prometheus",
        row.WithGraph(
            // some data
        ),
    ),
)

fmt.Printf("%d\n", builder1.Internal().Rows[0].Panels[0].ID)
// 1
fmt.Printf("%d\n", builder2.Internal().Rows[0].Panels[0].ID)
// 1
As far as I understand problem is here - https://github.com/K-Phoen/sdk/blob/master/row.go#L33
Possible solution is to extend MarshalJSON/MarshalIndentJSON and mutate ids there, starting them from 1
singlestat panel is deprecated, but the stat panel only supports a small portion of the features.
One thing i am missing is support for mappings.
This is the json from grafana, from such a mapping.
How would you go about adding that?
I guess it would also require changes in the sdk.
"type": "stat",
  "fieldConfig": {
    "defaults": {
      "mappings": [
        {
          "type": "range",
          "options": {
            "from": 0,
            "to": 0.9,
            "result": {
              "text": "DOWN"
            }
          }
        },
        {
          "type": "range",
          "options": {
            "from": 1,
            "to": 1,
            "result": {
              "text": "UP"
            }
          }
        },
Hello,
I really like the dashboard as code concept that Grabana has implemented. I work on a community driven druid datasource. I was wondering how to go about adding support for a new datasource?
-R
https://grafana.com/docs/mimir/latest/operators-guide/reference-http-api/#rulerHi, all works like a charm, but I'm getting error when upserting dashboard. I'm not even using alerts, so maybe the functionality could be at least optional?
error: could not prepare deletion of previous alerts for dashboard: could not query grafana: {"message":"Not found"} (HTTP status 404)
If I try using cURL right on the particular query for rules:
curl -H "Authorization: Bearer xxx" https://foo.bar/api/ruler/grafana/api/v1/rules?dashboard_uid=ygUo8se7k
{"message":"Not found"}
It looks like the alerts cleanup uses Mimir ruler API?
I'm running self-hosted Grafana instance version 8.4.0 and using latest grabana v0.21.9
Thanks for any pointers
Using the client we are able to find if a folder exists. Likewise, It would be great if we could query whether a dashboard already exists.
It could be accomplished with two functions like this:
// This function queries the /api/search endpoint and returns the dashboard if it exists
func (client *Client) getDashboardByTitle(ctx context.Context, title string) (*DashboardQuery, error) {
	// 1. make a request to search for the dash board
	query := fmt.Sprintf("/api/search?query=%s", title)
	resp, err := client.get(ctx, query)

	if err != nil {
		err1 := fmt.Errorf("grafput: getDashboardByTitle %s", err)
		return nil, err1
	}

	// 2. check the status code
	if resp.StatusCode != http.StatusOK {
		body, err := ioutil.ReadAll(resp.Body)
		if err != nil {
			err1 := fmt.Errorf("grafput: getDashboardByTitle: %s", err)
			return nil, err1
		}

		return nil, fmt.Errorf("could not read body after querying dashboard: %s (HTTP status %d)", body, resp.StatusCode)
	}

	defer func() { _ = resp.Body.Close() }()

	// 3. decode json using our Dashboard Query struct
	var dashboard []DashboardQuery
	if err := decodeJSON(resp.Body, &dashboardQuery); err != nil {
		err1 := fmt.Errorf("grafput: getDashboardByTitle: %s", err)
		return nil, err1
	}

	if len(dashboardQuery) == 0 {
		return nil, nil
	}

	// 4. iterate through the list of dashboards until we match title
	for i := range dashboardQuery {
		if strings.EqualFold(dashboardQuery[i].Title, title) {
			return &dashboardQuery[i], nil
		}
	}

	return nil, nil
}
// This function enables us to search Grafana for a dashboard by its title
func (client *Client) CheckIfDashboardExists(ctx context.Context, title string) (string, error) {
	dashboard, err := client.getDashboardByTitle(ctx, title)
	if err != nil {
		err1 := fmt.Errorf("grafput: CheckIfDashboard Exists: %s", err)
		return "", err1
	}

	if dashboard == nil {
		return "", nil
	}

	dashboardUrl := dashboard.Url

       // here we could return the dashboard object or the URL
	return dashboardUrl, nil
}
type DashboardQuery struct {
	Id          int      `json:"id"`
	Uid         string   `json:"uid"`
	Title       string   `json:"title"`
	Uri         string   `json:"uri"`
	Url         string   `json:"url"`
	Slug        string   `json:"slug"`
	Type        string   `json:"type"`
	Tags        []string `json:"tags"`
	IsStarred   bool     `json:"isStarred"`
	FolderId    int      `json:"folderId"`
	FolderUid   string   `json:"folderUid"`
	FolderTitle string   `json:"folderTitle"`
	FolderUrl   string   `json:"folderUrl"`
	SortMeta    int      `json:"sortMeta"`
}
No Field override helper at statfield:
// FieldOverride allows overriding visualization options.
func FieldOverride(m fields.Matcher, opts ...fields.OverrideOption) Option {
	return func(stats *Stat) error {
		override := sdk.FieldConfigOverride{}

		m(&override)

		for _, opt := range opts {
			opt(&override)
		}
		stats.Builder.StatPanel.FieldConfig.Overrides = append(stats.Builder.StatPanel.FieldConfig.Overrides, override)
		return nil
	}
}grabana/timeseries/timeseries.go
Lines 270 to 277 in 092b4d3
Hi and thank you so much for this awesome project! I really like it so far and generating dashboards from scratch is working just fine. Is there any way to obtain the remote dashboard (e.g. in form of dashboard.Builder or DashboardModel) in order to replace some part of it with a part from the dashboard rendered locally and send it back to grafana via client.UpsertDashboard?
The case: I have very complex dashboards with multiple sources of truth (multiple repos) and I would like to detect (maybe using the panel description filed or in any other appropriate way) a subset of panels from the remote board, replace it with locally generated panels and sent the dashboard back to the grafana. Is that in any way possible now?
Thank you in advance! <3
It would be great to be able to configure queries to be refreshed every time the time range changes.
grabana/variable/query/query.go
Line 64 in 36308c0
Based on https://github.com/inconshreveable/go-update maybe?
I want to add support for a dropdown inside a grafana dashboard mainly by updating the templating field like this:
templating": {
  "list": [
   {
    "allValue": ".*",
    "current": {
     "selected": true,
     "text": "All",
     "value": [
      "$__all"
     ]
    },
"datasource": "Prometheus",
includeAll": true,
  ]
}
While I see support to add rows, tags, title, how do i go about adding a dropdown. I have tested the code by pasting it in a json and it does produce a dropdown.
Current behaviour
dashboard.VariableAsCustom(
  "env",
  custom.Values(podEnvsMap),
  custom.IncludeAll(),
  custom.AllValue(".*"),
  custom.Default("$__all"),
)
Expected behaviour
dashboard.VariableAsCustom(
  "env",
  custom.Values(podEnvsMap),
  custom.IncludeAll(),
  custom.AllValue(".*"),
  custom.DefaultAll,
)I see the module currently does not support cloudwatch target. This will be really helpful in creating panels using cloudWatch Metrics Syntax, namespaces, metric names, dimensions, and operators etc
hello @K-Phoen,
I am evaluating grabana and I have to say that in one hour I already saw the advantages (writing Go code, I did not try the YAML). Very nice idea, thanks for sharing!
Now, I would like to configure Null values to Connected for the Timeseries panel.
Do I understand correctly that I would have to add the feature to the timeseries package, in the same way as it is visible in the graph package? I used this search: https://github.com/K-Phoen/grabana/search?q=NullValue
Would you consider a PR?
Thanks
Interval variables are currently not sorted by their duration, which leads to an inconsistent and unexpected user-experience.
Expected Behaviour:
Interval variables should be sorted by their duration value, i.e. 10s, 10m, 10h

Actual Behaviour:
Interval variables are sorted by a regular string sort (pure alphanumeric), i.e. 10h, 10m, 10s

Thx for building this great client. i am currently using the 0.20.17 version and integrate with a grafana 7.3.1 setup. everything works like a charm and i could get the existing notification channel thru the GetAlertChannelByName() call without problem.
But i am stuck on creating a new email notification channel thru the grabana client. Is there any example code which i could refer to? thanks for your help.
Try to convert-go a JSON I get this error.
➜  grabana_0.22.1_darwin_arm64 ./grabana convert-go -i Profile.json
2024-03-18T10:49:31+01:00	WARN	golang/variable.go:39	unhandled variable type found: skipped	{"type": "custom", "name": "env"}
2024-03-18T10:49:31+01:00	WARN	golang/variable.go:39	unhandled variable type found: skipped	{"type": "custom", "name": "platform"}
panic: interface conversion: interface {} is nil, not string

goroutine 1 [running]:
github.com/K-Phoen/grabana/encoder/golang.(*Encoder).encodeQueryVar(_, {{0x1400021b1b0, 0xd}, {0x1400021b268, 0x5}, 0x0, 0x0, 0x1400021e7e0, {0x0, 0x1400021b260}, ...})
	/home/runner/work/grabana/grabana/encoder/golang/variable.go:115 +0x50c8
github.com/K-Phoen/grabana/encoder/golang.(*Encoder).encodeVariable(_, {{0x1400021b1b0, 0xd}, {0x1400021b268, 0x5}, 0x0, 0x0, 0x1400021e7e0, {0x0, 0x1400021b260}, ...})
	/home/runner/work/grabana/grabana/encoder/golang/variable.go:31 +0x74
github.com/K-Phoen/grabana/encoder/golang.(*Encoder).encodeVariables(...)
	/home/runner/work/grabana/grabana/encoder/golang/variable.go:13
github.com/K-Phoen/grabana/encoder/golang.(*Encoder).EncodeDashboard(_, {0x59, {0x140000b84e0, 0x24}, {0x0, 0x0}, {0x1400021b380, 0xb}, {0x0, 0x0}, ...})
	/home/runner/work/grabana/grabana/encoder/golang/encoder.go:31 +0x310
github.com/K-Phoen/grabana/encoder.ToGolang(_, {0x59, {0x140000b84e0, 0x24}, {0x0, 0x0}, {0x1400021b380, 0xb}, {0x0, 0x0}, ...})
	/home/runner/work/grabana/grabana/encoder/golang.go:12 +0x58
github.com/K-Phoen/grabana/cmd/cli/cmd.convertGo(0x0?, {{0x16bae3438?, 0x0?}})
	/home/runner/work/grabana/grabana/cmd/cli/cmd/convertGo.go:54 +0x26c
github.com/K-Phoen/grabana/cmd/cli/cmd.ConvertGo.func1(0x14000126400?, {0x1047ac436?, 0x4?, 0x1047ac43a?})
	/home/runner/work/grabana/grabana/cmd/cli/cmd/convertGo.go:26 +0x2c
github.com/spf13/cobra.(*Command).execute(0x140000a5200, {0x140000e0460, 0x2, 0x2})
	/home/runner/work/grabana/grabana/vendor/github.com/spf13/cobra/command.go:983 +0x840
github.com/spf13/cobra.(*Command).ExecuteC(0x140000a4300)
	/home/runner/work/grabana/grabana/vendor/github.com/spf13/cobra/command.go:1115 +0x344
github.com/spf13/cobra.(*Command).Execute(...)
	/home/runner/work/grabana/grabana/vendor/github.com/spf13/cobra/command.go:1039
main.main()
	/home/runner/work/grabana/grabana/cmd/cli/main.go:32 +0x218
Would it be possible to add more diagnostic info to find the error?
Grafana v10.3.3 (252761264e)
Using export JSON and the grabana convert-go command.
Gist: https://gist.github.com/filiplindqvist-tv4/b18c7fa13c8c8c7a18ca24bf191587f0
It would be great to have support for the logs panel
Running go get on this as a dependency fails:
$ mkdir foo && cd foo/
$ go mod init foo.com/foo
go: creating new go.mod: module foo.com/foo
$ go get -u github.com/K-Phoen/grabana
go: github.com/K-Phoen/grabana upgrade => v0.6.3
go: github.com/grafana-tools/sdk upgrade => v0.0.0-20200326200416-f0431e44c1c3
go: github.com/gosimple/slug upgrade => v1.9.0
# github.com/K-Phoen/grabana/alert
../pkg/mod/github.com/!k-!phoen/[email protected]/alert/alert.go:128:25: cannot use conditionOperator literal (type conditionOperator) as type sdk.AlertOperator in assignment
../pkg/mod/github.com/!k-!phoen/[email protected]/alert/condition.go:57:22: cannot use query literal (type query) as type sdk.AlertQuery in assignment
../pkg/mod/github.com/!k-!phoen/[email protected]/alert/condition.go:58:24: cannot use reducer literal (type reducer) as type sdk.AlertReducer in assignment
../pkg/mod/github.com/!k-!phoen/[email protected]/alert/condition.go:66:22: cannot use query literal (type query) as type sdk.AlertQuery in assignment
../pkg/mod/github.com/!k-!phoen/[email protected]/alert/condition.go:67:24: cannot use reducer literal (type reducer) as type sdk.AlertReducer in assignment
../pkg/mod/github.com/!k-!phoen/[email protected]/alert/condition.go:75:22: cannot use query literal (type query) as type sdk.AlertQuery in assignment
../pkg/mod/github.com/!k-!phoen/[email protected]/alert/condition.go:76:24: cannot use reducer literal (type reducer) as type sdk.AlertReducer in assignment
../pkg/mod/github.com/!k-!phoen/[email protected]/alert/condition.go:84:22: cannot use query literal (type query) as type sdk.AlertQuery in assignment
../pkg/mod/github.com/!k-!phoen/[email protected]/alert/condition.go:85:24: cannot use reducer literal (type reducer) as type sdk.AlertReducer in assignment
../pkg/mod/github.com/!k-!phoen/[email protected]/alert/condition.go:93:22: cannot use query literal (type query) as type sdk.AlertQuery in assignment
../pkg/mod/github.com/!k-!phoen/[email protected]/alert/condition.go:93:22: too many errors
Command-line tool should return non-zero exit code, especially if the apply subcommand fails.
Note sure if it exists - but a yaml schema for validation would be useful for writing dashboards / alerts easily for new users.
That way in editors such as vscode one would get intellisense and errors when the yaml doesn't match the schema.
for reference vscode can pick up the schmea using smthg like:
# yaml-language-server: $schema=https://raw.githubusercontent.com/K-Phoen/grabana/schemas/schema.jsonI see the sdk supports the stacking configuration but unfortunately it's not possible to set it using Grabana
It would be great if this would be possible.
We want to make a dashboard with heatmaps, and one recommendation is to limit the number of data points by setting the "Query option" "Max data points" to a reasonable number.
I can't find a way to do that with Grabana YAML, how difficult would it be to add?
No way to define the option "pql" for prometheus target into generated dashboard.json
...
"targets": [
        {
          "chart": "prefix",
          "expr": "go_memstats_gc_sys_bytes{app=\"$app\", env=\"$env\", dc=\"$dc\"}",
          "format": "time_series",
          "interval": "",
          "legendFormat": "gc sys",
          "refId": "F",
          "size": 100000,

          "pql": true,        <<<<<< here

        }...
It would be useful to produce snapshots similar to the way Grabana provides upserting for dashboards.
I have a panel defined like this:
    {
      "datasource": null,
      "fieldConfig": {
        "defaults": {},
        "overrides": []
      },
      "gridPos": {
        "h": 2,
        "w": 24,
        "x": 0,
        "y": 0
      },
      "id": 2,
      "options": {
        "content": "<center><h1>test overview</h1></center>",
        "mode": "html"
      },
      "pluginVersion": "7.5.5",
      "timeFrom": null,
      "timeShift": null,
      "type": "text"
    },
The resulting part of kubernetes yaml:
            - text:
                title: ""
                span: 12
Content, content type and size are all missing
could build a CLI named grabana, that can deploy YAML to Grafana, just like:
grabana apply -f dashboard.yaml -h grafanaHost -s "such secret, much wow"A declarative, efficient, and flexible JavaScript library for building user interfaces.
🖖 Vue.js is a progressive, incrementally-adoptable JavaScript framework for building UI on the web.
TypeScript is a superset of JavaScript that compiles to clean JavaScript output.
An Open Source Machine Learning Framework for Everyone
The Web framework for perfectionists with deadlines.
A PHP framework for web artisans
Bring data to life with SVG, Canvas and HTML. 📊📈🎉
JavaScript (JS) is a lightweight interpreted programming language with first-class functions.
Some thing interesting about web. New door for the world.
A server is a program made to process requests and deliver data to clients.
Machine learning is a way of modeling and interpreting data that allows a piece of software to respond intelligently.
Some thing interesting about visualization, use data art
Some thing interesting about game, make everyone happy.
We are working to build community through open source technology. NB: members must have two-factor auth.
Open source projects and samples from Microsoft.
Google ❤️ Open Source for everyone.
Alibaba Open Source for everyone
Data-Driven Documents codes.
China tencent open source team.