IBM is an American MNC operating in around 170 countries with major business vertical as computing, software, and hardware. Attrition is a major risk to service-providing organizations where trained and experienced people are the assets of the company. The organization would like to identify the factors which influence the attrition of employees.
Data analysis for the case study follows the following steps:
The data used is stored in Kaggle under the IBM Employee Dataset. The dataset contains information about their education, department, and more.
#Installing the packages
import pandas as pd
import numpy as np

#Data Viz
import matplotlib.pyplot as plt
from matplotlib import style
import seaborn as snsattrition_dataset = pd.read_csv('/kaggle/input/employee/train.csv')attrition_dataset.head() plt.figure(figsize=(10,10))
plt.hist(attrition_dataset['Age'],bins=70)
plt.title("Age Distribution of Employees")
plt.xlabel("Age of Employees")
plt.ylabel("No of Employees")
plt.show()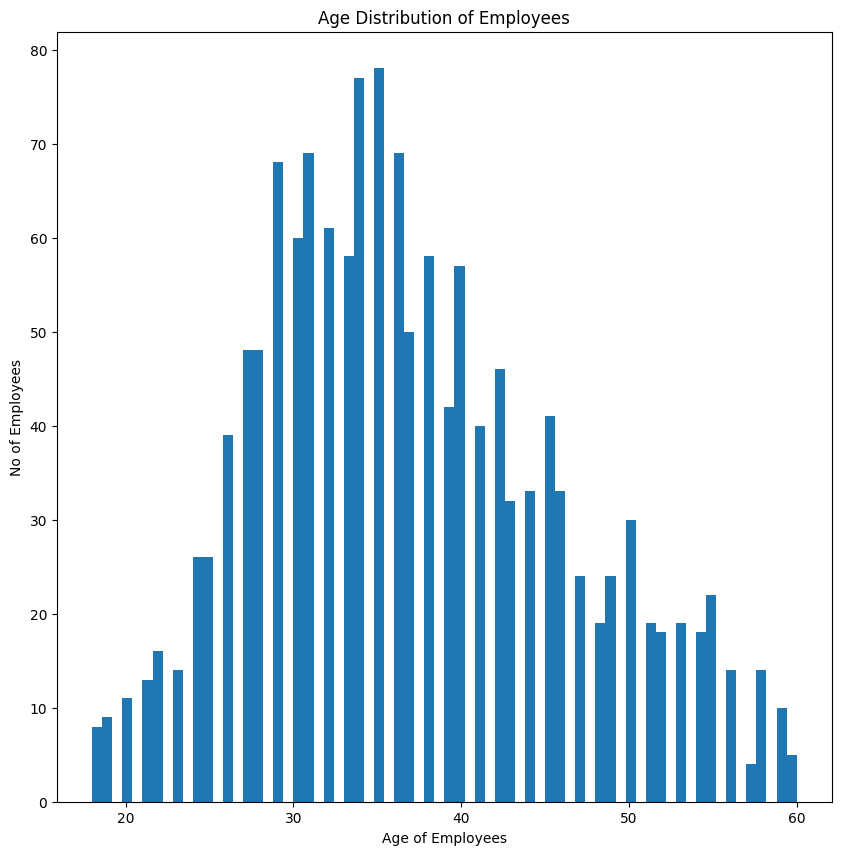
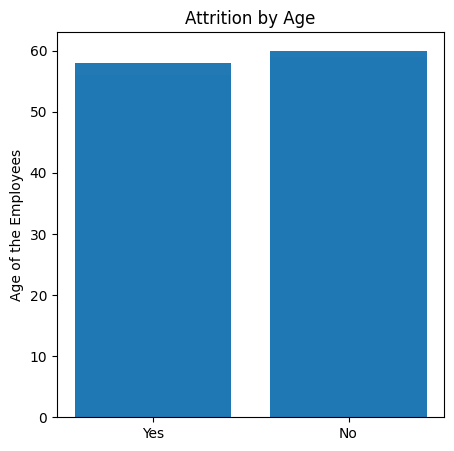
plt.figure(figsize=(5,5))
plt.bar(attrition_dataset.Attrition,attrition_dataset.Age, alpha=.55)
plt.title("Attrition by Age")
plt.ylabel("Age of the Employees")
plt.show()
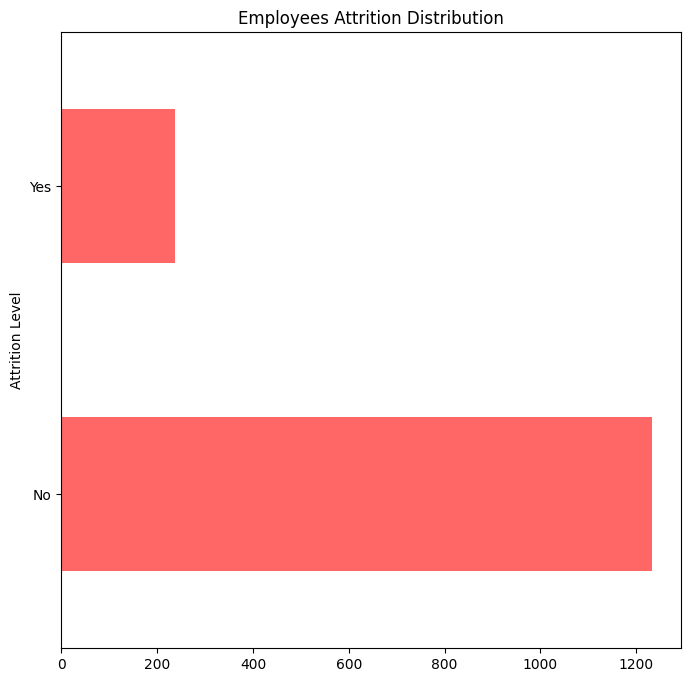
plt.figure(figsize=(8,8))
attrition_dataset.Attrition.value_counts().plot(kind='barh', color='r', alpha = 0.6)
plt.title("Employees Attrition Distribution")
plt.ylabel("Attrition Level")
plt.show()
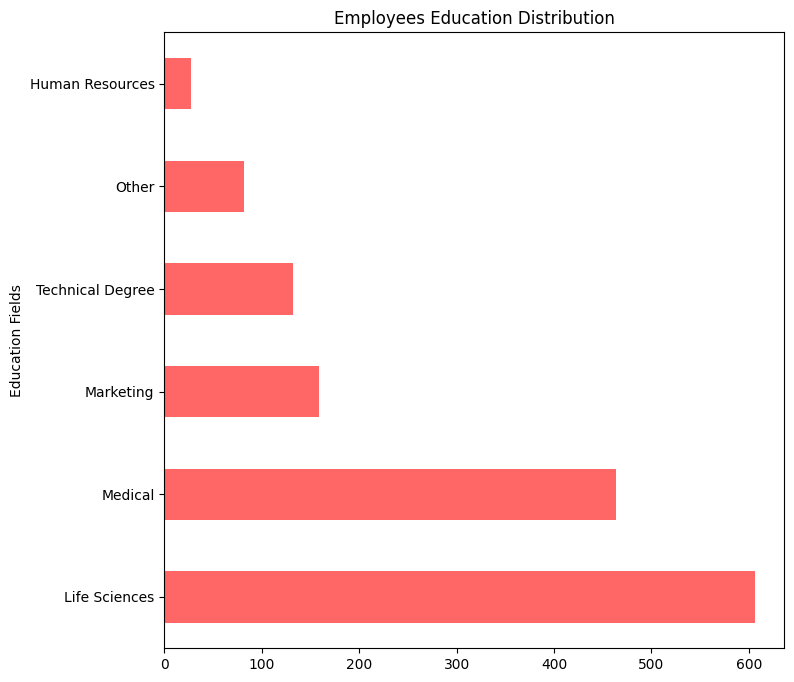
plt.figure(figsize=(8,8))
attrition_dataset.EducationField.value_counts().plot(kind='barh', color='r', alpha = 0.6)
plt.title("Employees Education Distribution")
plt.ylabel("Education Fields")
plt.show()
plt.figure(figsize=(8,8))
attrition_dataset.MaritalStatus.value_counts().plot(kind='barh', color='r', alpha = 0.6)
plt.title("Marital Status")
plt.show()```

