Giter VIP home page Giter VIP logo

reactablefmtr's Introduction

reactablefmtr

CRAN Status CRAN Downloads

The {reactablefmtr} package streamlines and enhances the styling and formatting of tables built with the {reactable} R package. The {reactablefmtr} package provides many conditional formatters that are highly customizable and easy to use.

  • Conditionally format tables with color scales, color tiles, and data bars. Assign icons from Font Awesome with icon assign and icon sets.

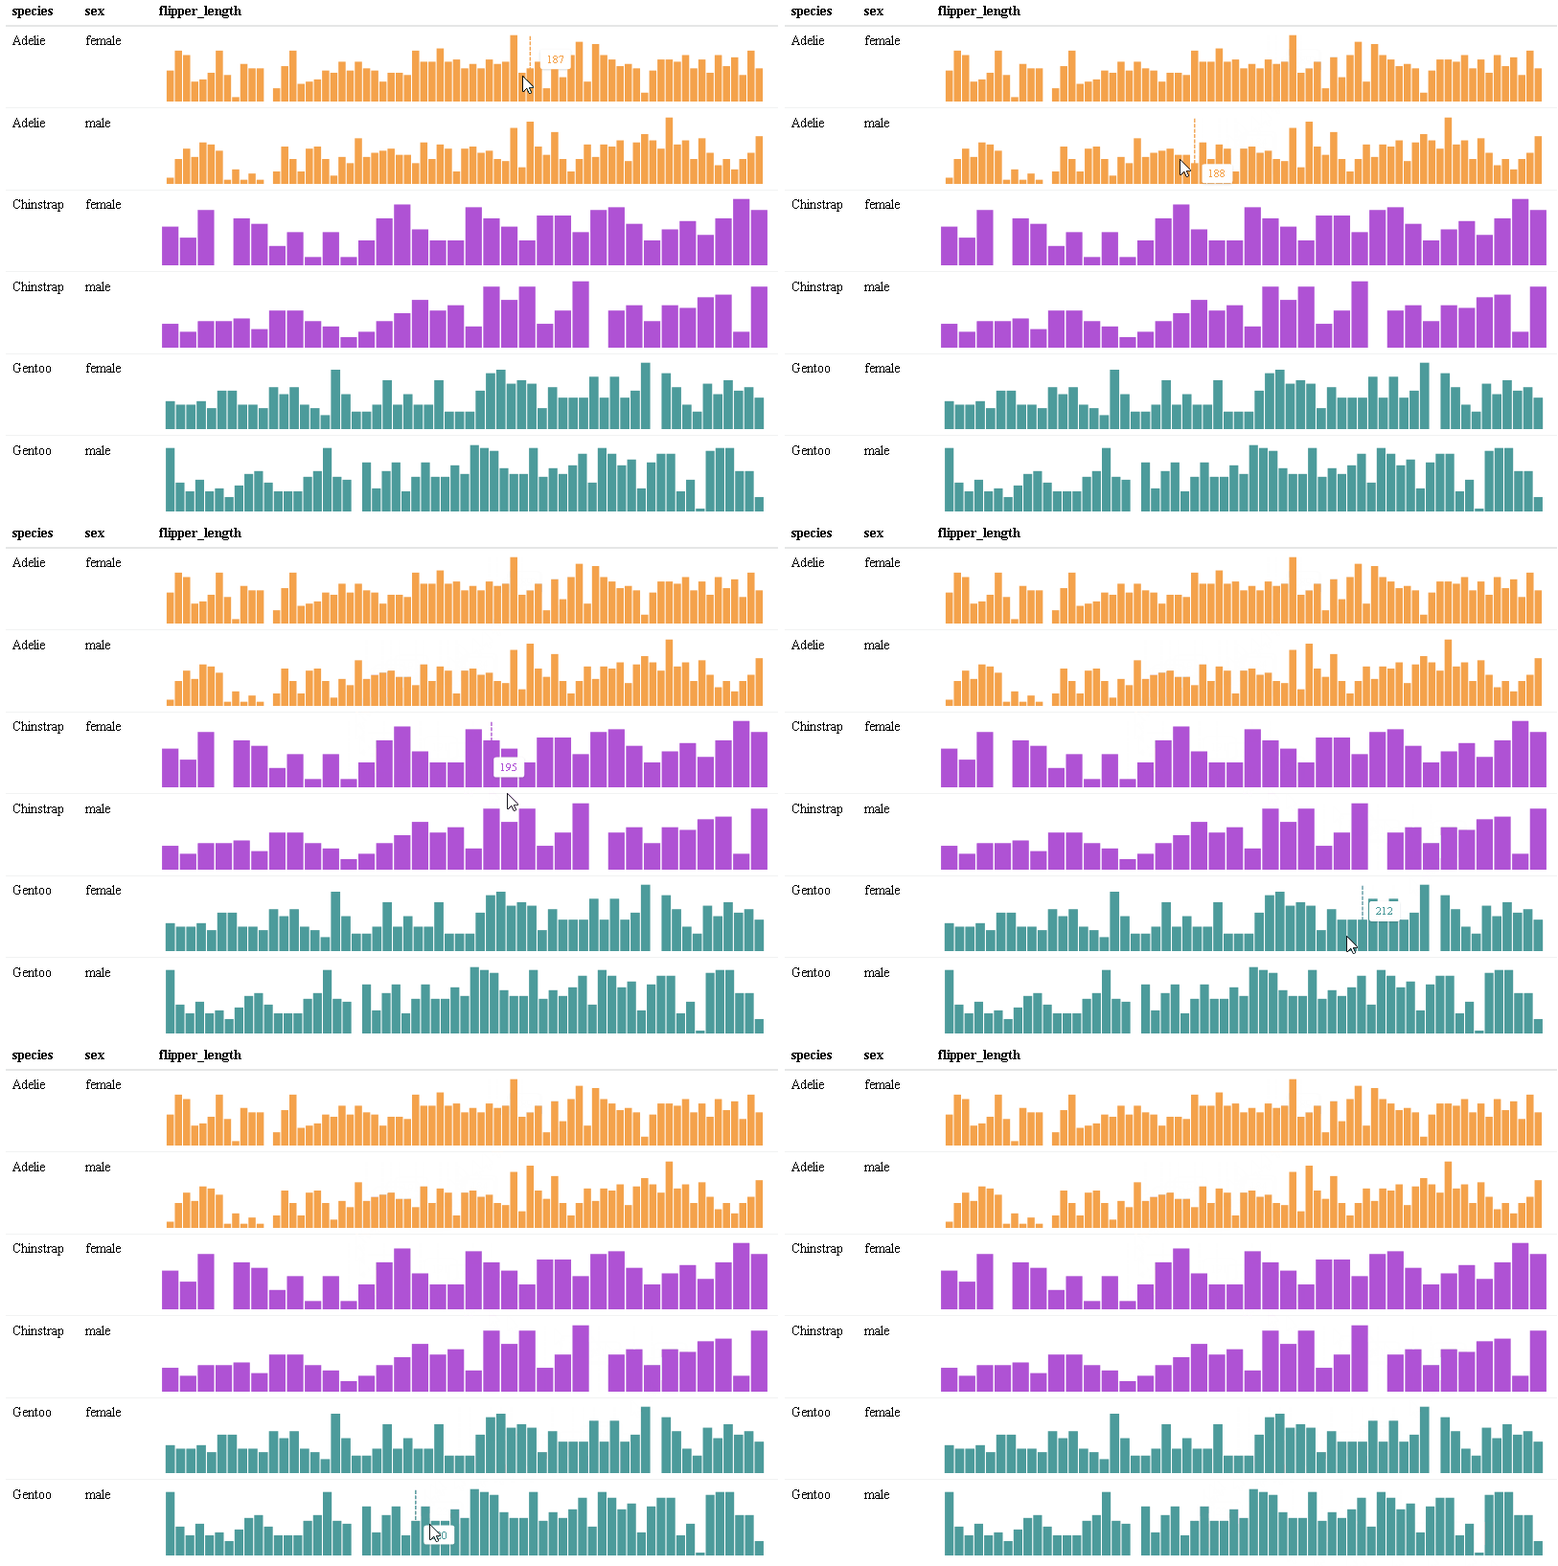
  • Interactive sparklines that are highly customizable and available in line or bar format.

  • Custom table themes that can easily be applied to any {reactablefmtr} or {reactable} table.

  • Embed images directly from the web into your table.

  • Save tables as static PNG files or as interactive HTML files.

For more examples, check out the vignettes. To stay up to date with the latest upgrades to the development version, be sure to follow the package news.

Installation

The {reactablefmtr} package is available from CRAN and can be installed with:

install.packages("reactablefmtr")

Or install the development version of {reactablefmtr} with:

remotes::install_github("kcuilla/reactablefmtr")

Why reactablefmtr?

The {reactable} package allows for the creation of interactive data tables in R. However, styling tables within {reactable} requires a lot of code, can be difficult for many R users (due to the need to understand HTML and CSS), and not scalable. For example, here is the current method of creating bar charts within {reactable}:

library(reactable)
library(htmltools)

data <- MASS::Cars93[20:49, c("Make", "MPG.city", "MPG.highway")]

bar_chart <- function(label, width = "100%", height = "16px", fill = "#15607A", background = "#EEEEEE") {
  bar <- div(style = list(background = fill, width = width, height = height))
  chart <- div(style = list(flexGrow = 1, marginLeft = "8px", background = background), bar)
  div(style = list(display = "flex", alignItems = "center"), label, chart)
}

reactable(
  data,
  columns = list(
    MPG.city = colDef(align = "left", cell = function(value) {
      width <- paste0(value / max(data$MPG.city) * 100, "%")
      bar_chart(value, width = width)
    }),
    MPG.highway = colDef(align = "left", cell = function(value) {
      width <- paste0(value / max(data$MPG.highway) * 100, "%")
      bar_chart(value, width = width)
    })
  )
)

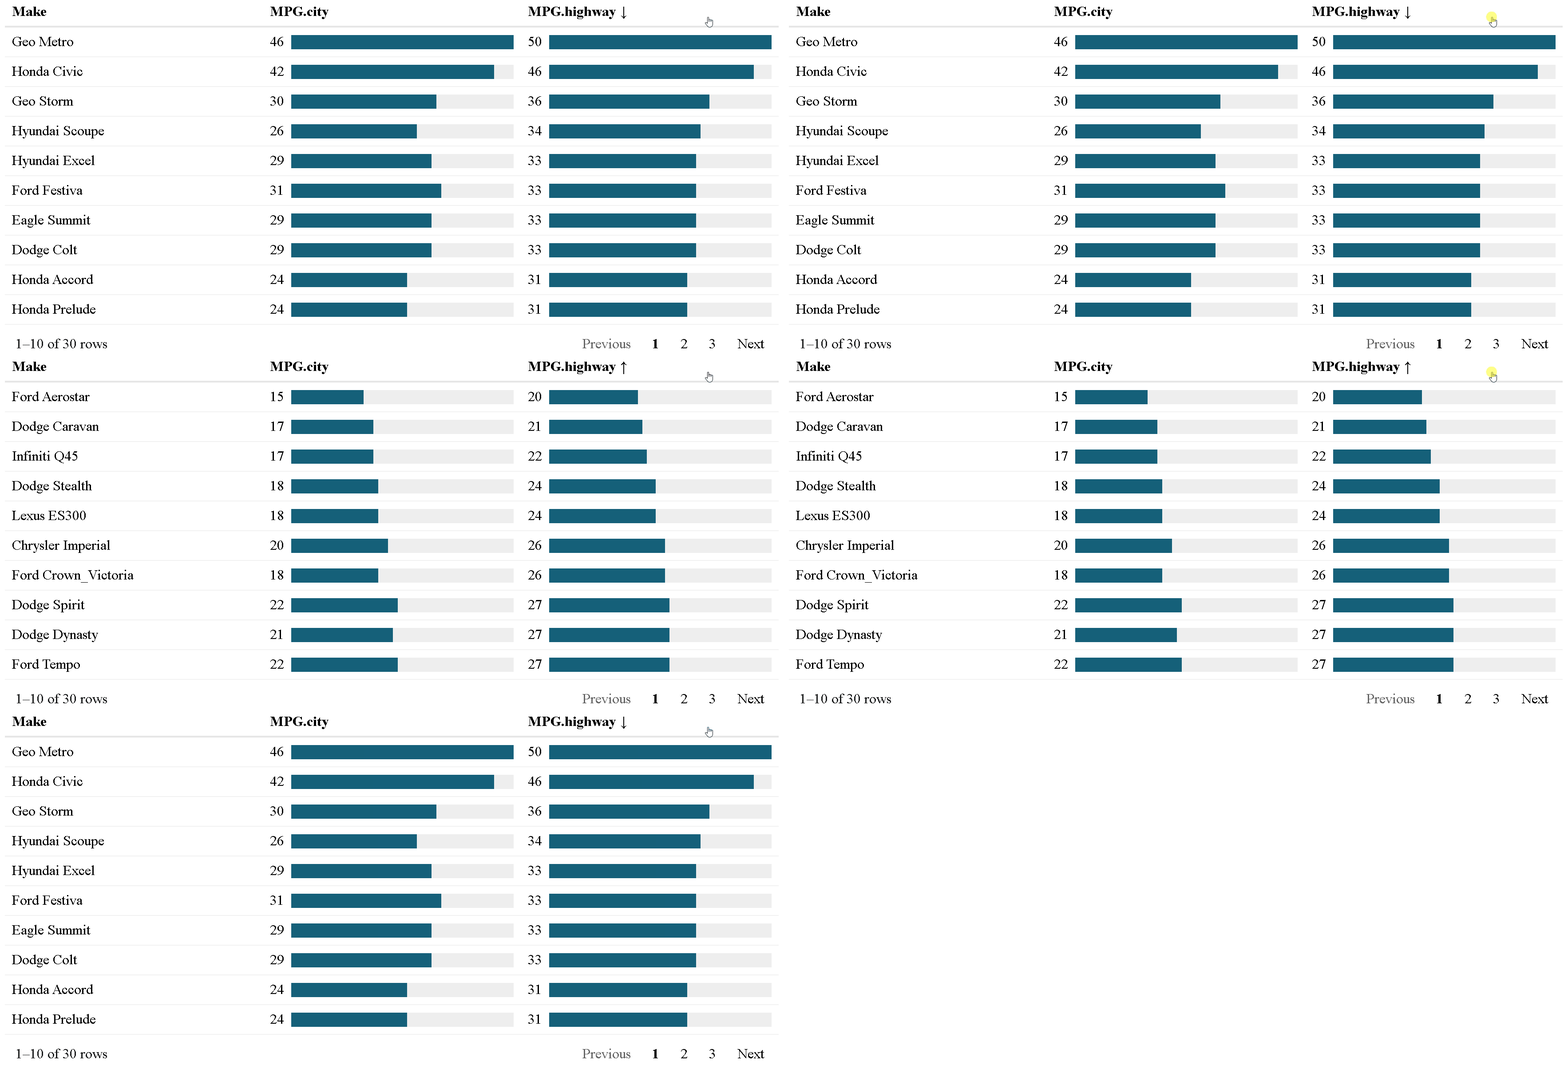
The {reactablefmtr} package presents a much simpler method of creating bar charts with the data_bars() function. In addition to needing far less code, there are also a multitude of customization options available to easily change the appearance of the bar charts, and as an added bonus, the bars animate on sort!

library(reactablefmtr)

reactable(
  data,
  defaultColDef = colDef(
    cell = data_bars(data, text_position = "outside-base")
  )
)

Examples

Data Bars

Use data_bars() to assign horizontal bars to each row. There are many ways to customize the look of data_bars(), including the alignment of the bars, the position of the text labels, and the option to add icons and images to the bars. See the tutorial for customization examples.

Sparklines

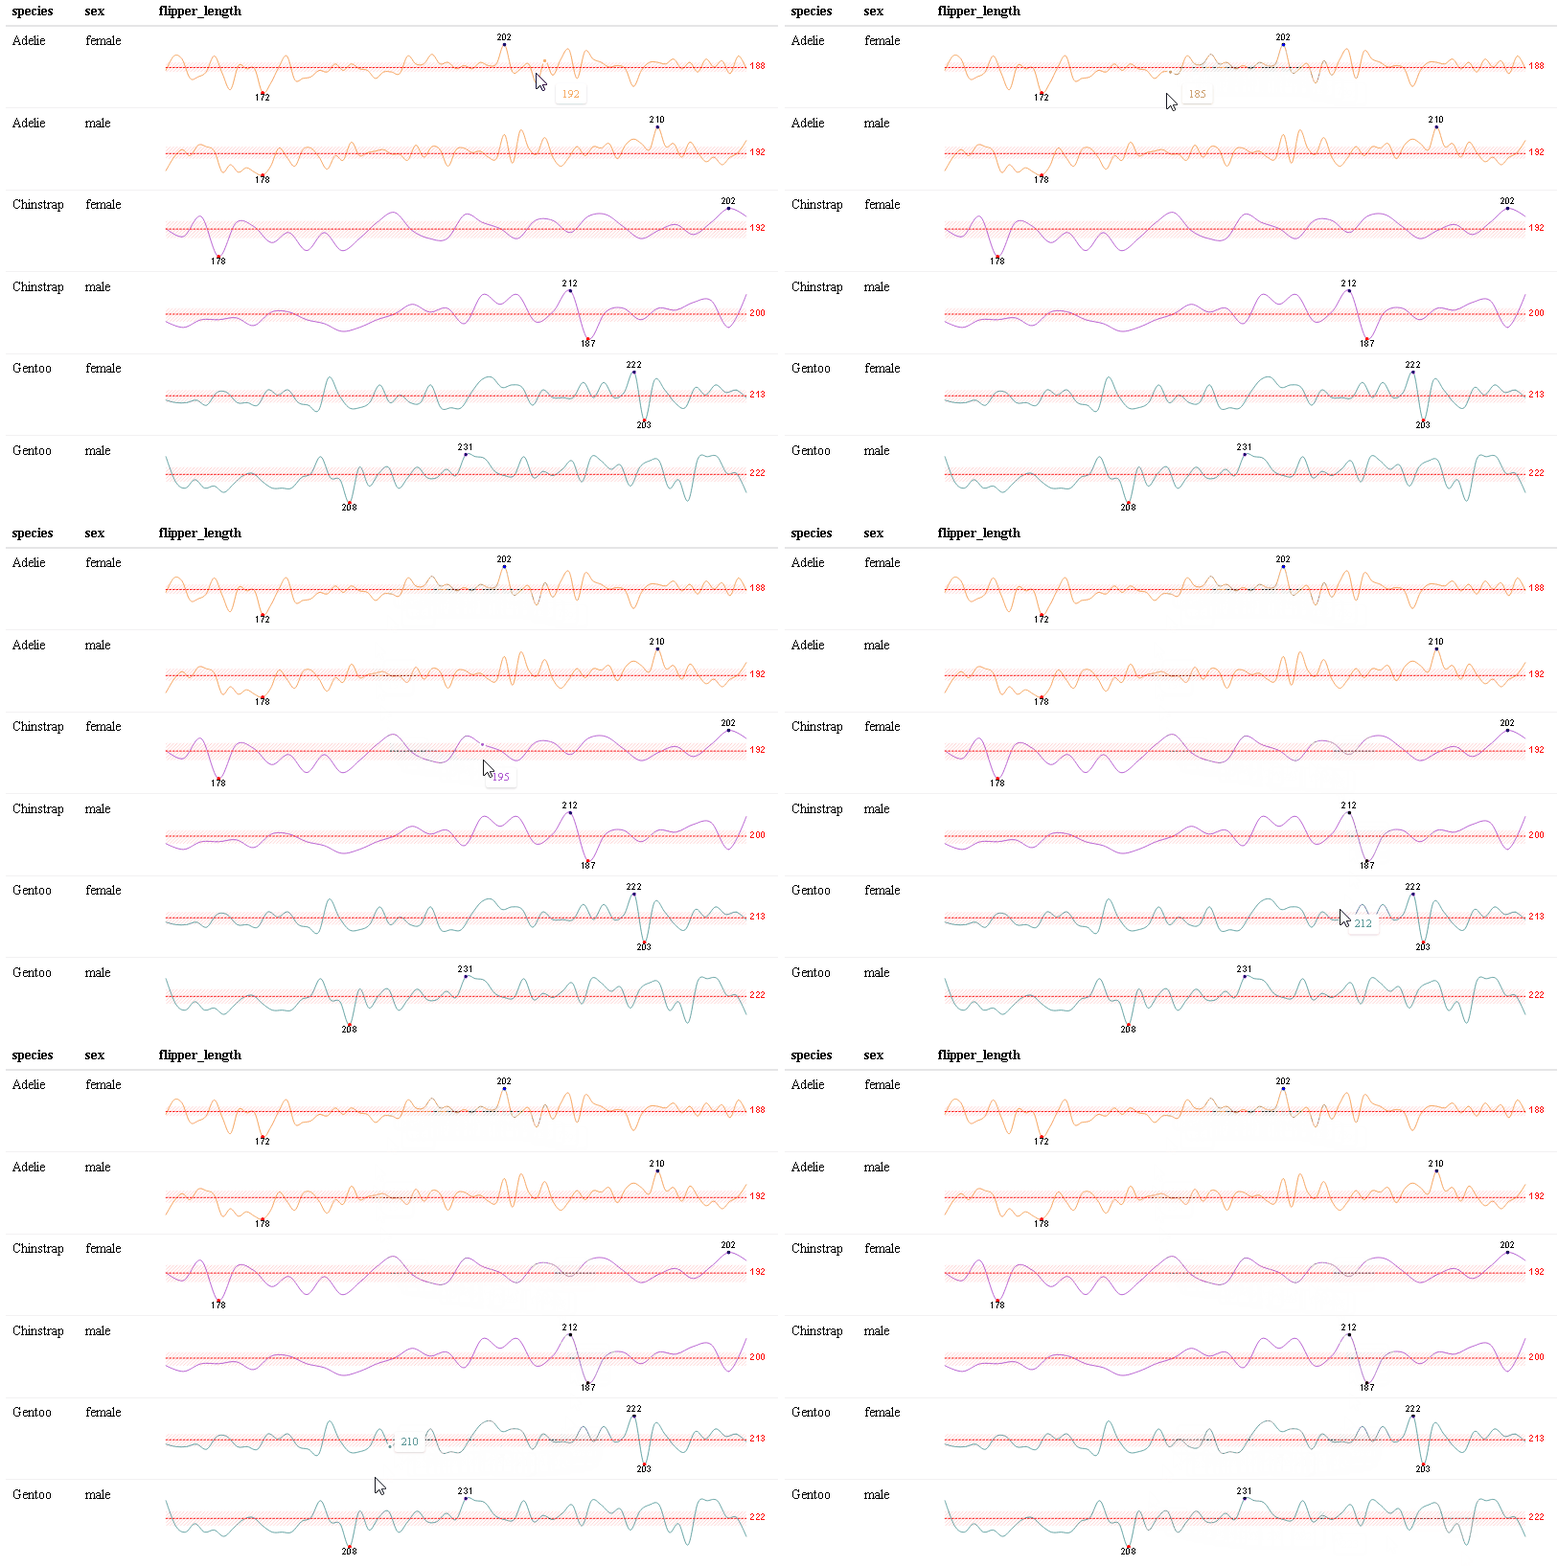
Use react_sparkline() to create sparklines or react_sparkbar() to create sparkline bar charts. The sparklines are highly customizable and interactive. As you hover over each data point, the value will appear. The sparklines are imported from the {dataui} package, so this package will need to be downloaded from GitHub in order to use this feature.

Color Scales

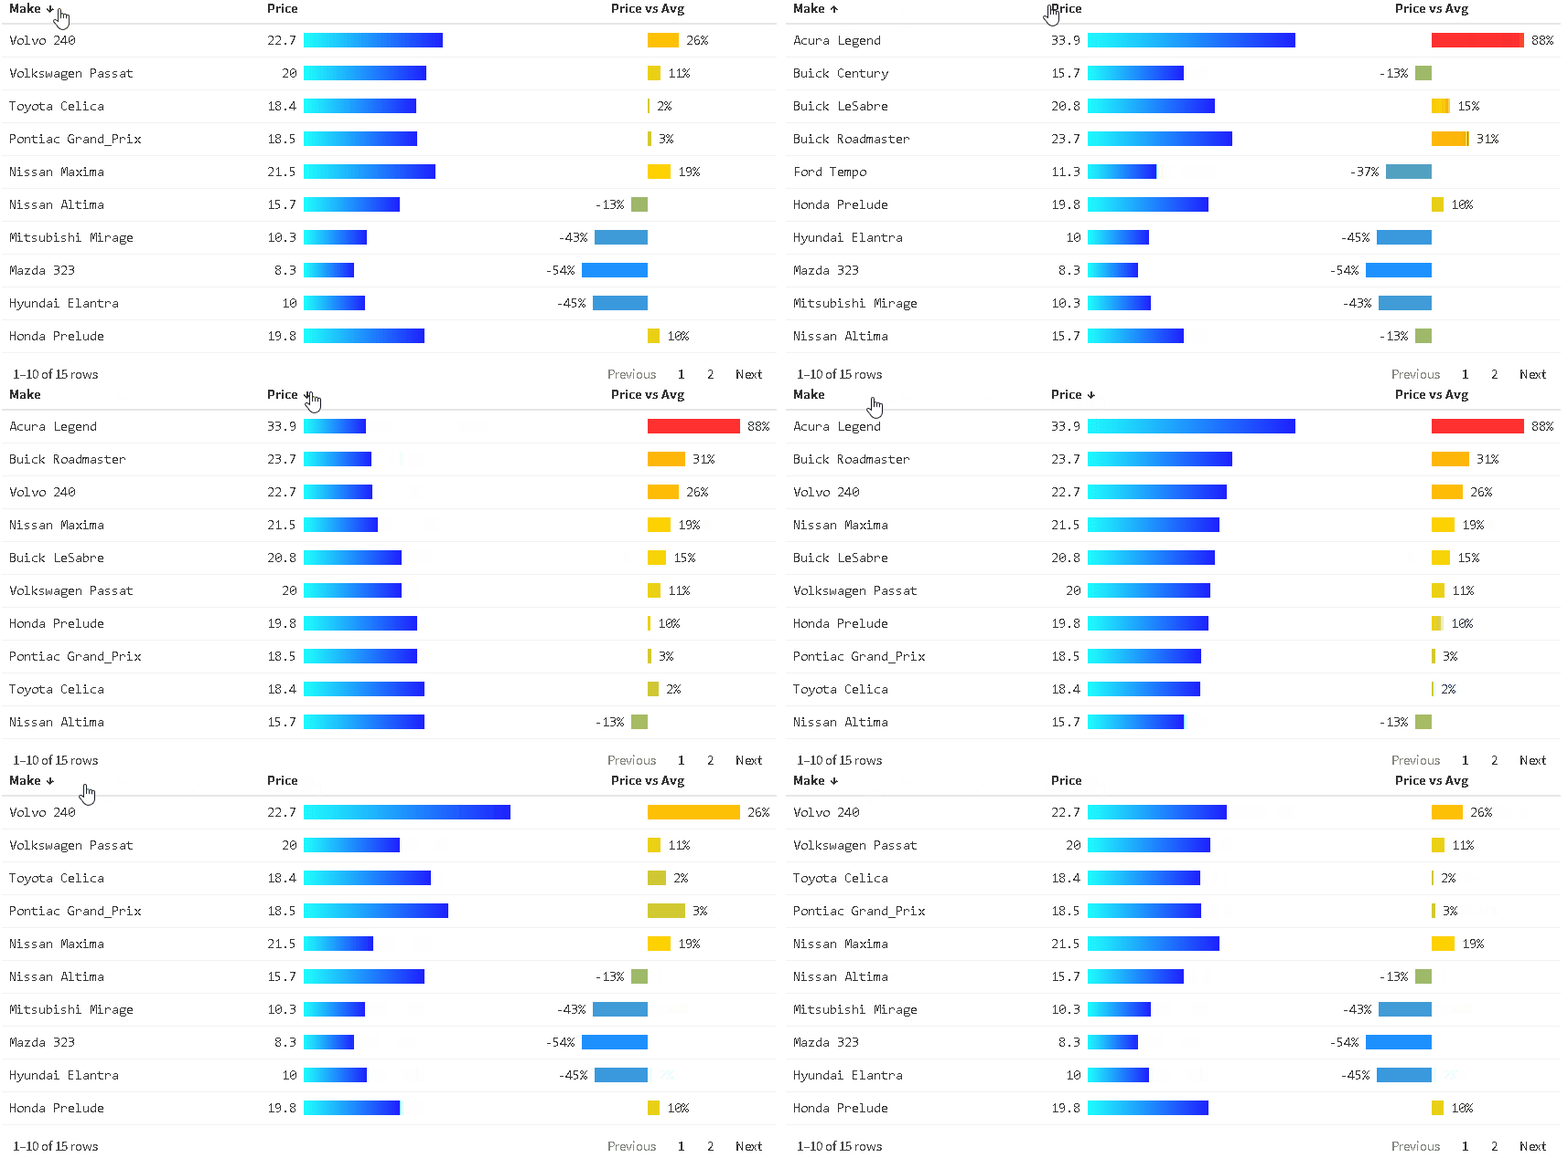
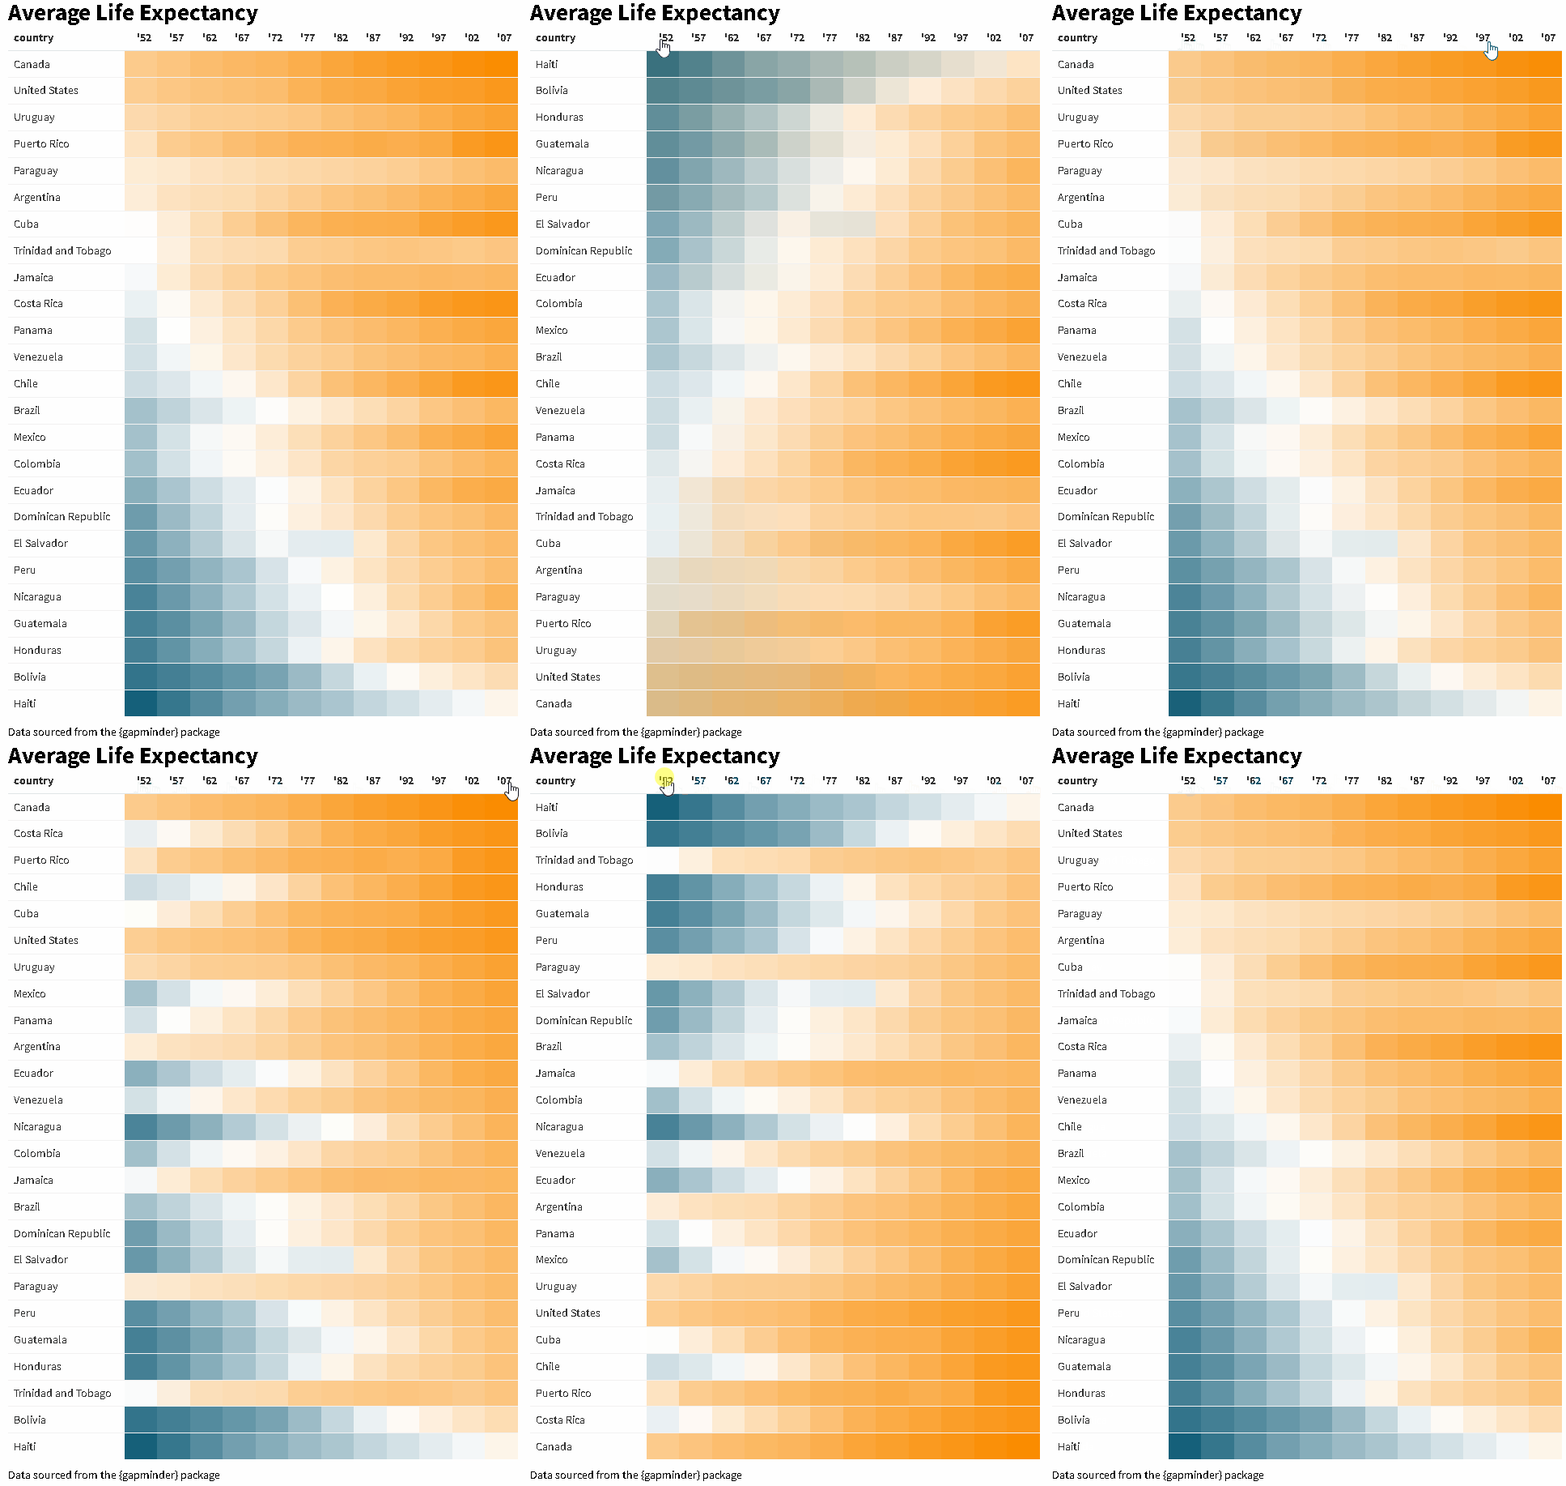
Use color_scales() to assign conditional colors to cells based on their relative values. The color of the text in the cells automatically adjusts based on the shade of the cell color, allowing the use of dark-colored palettes. See the tutorial for more examples.

Bubble Grids

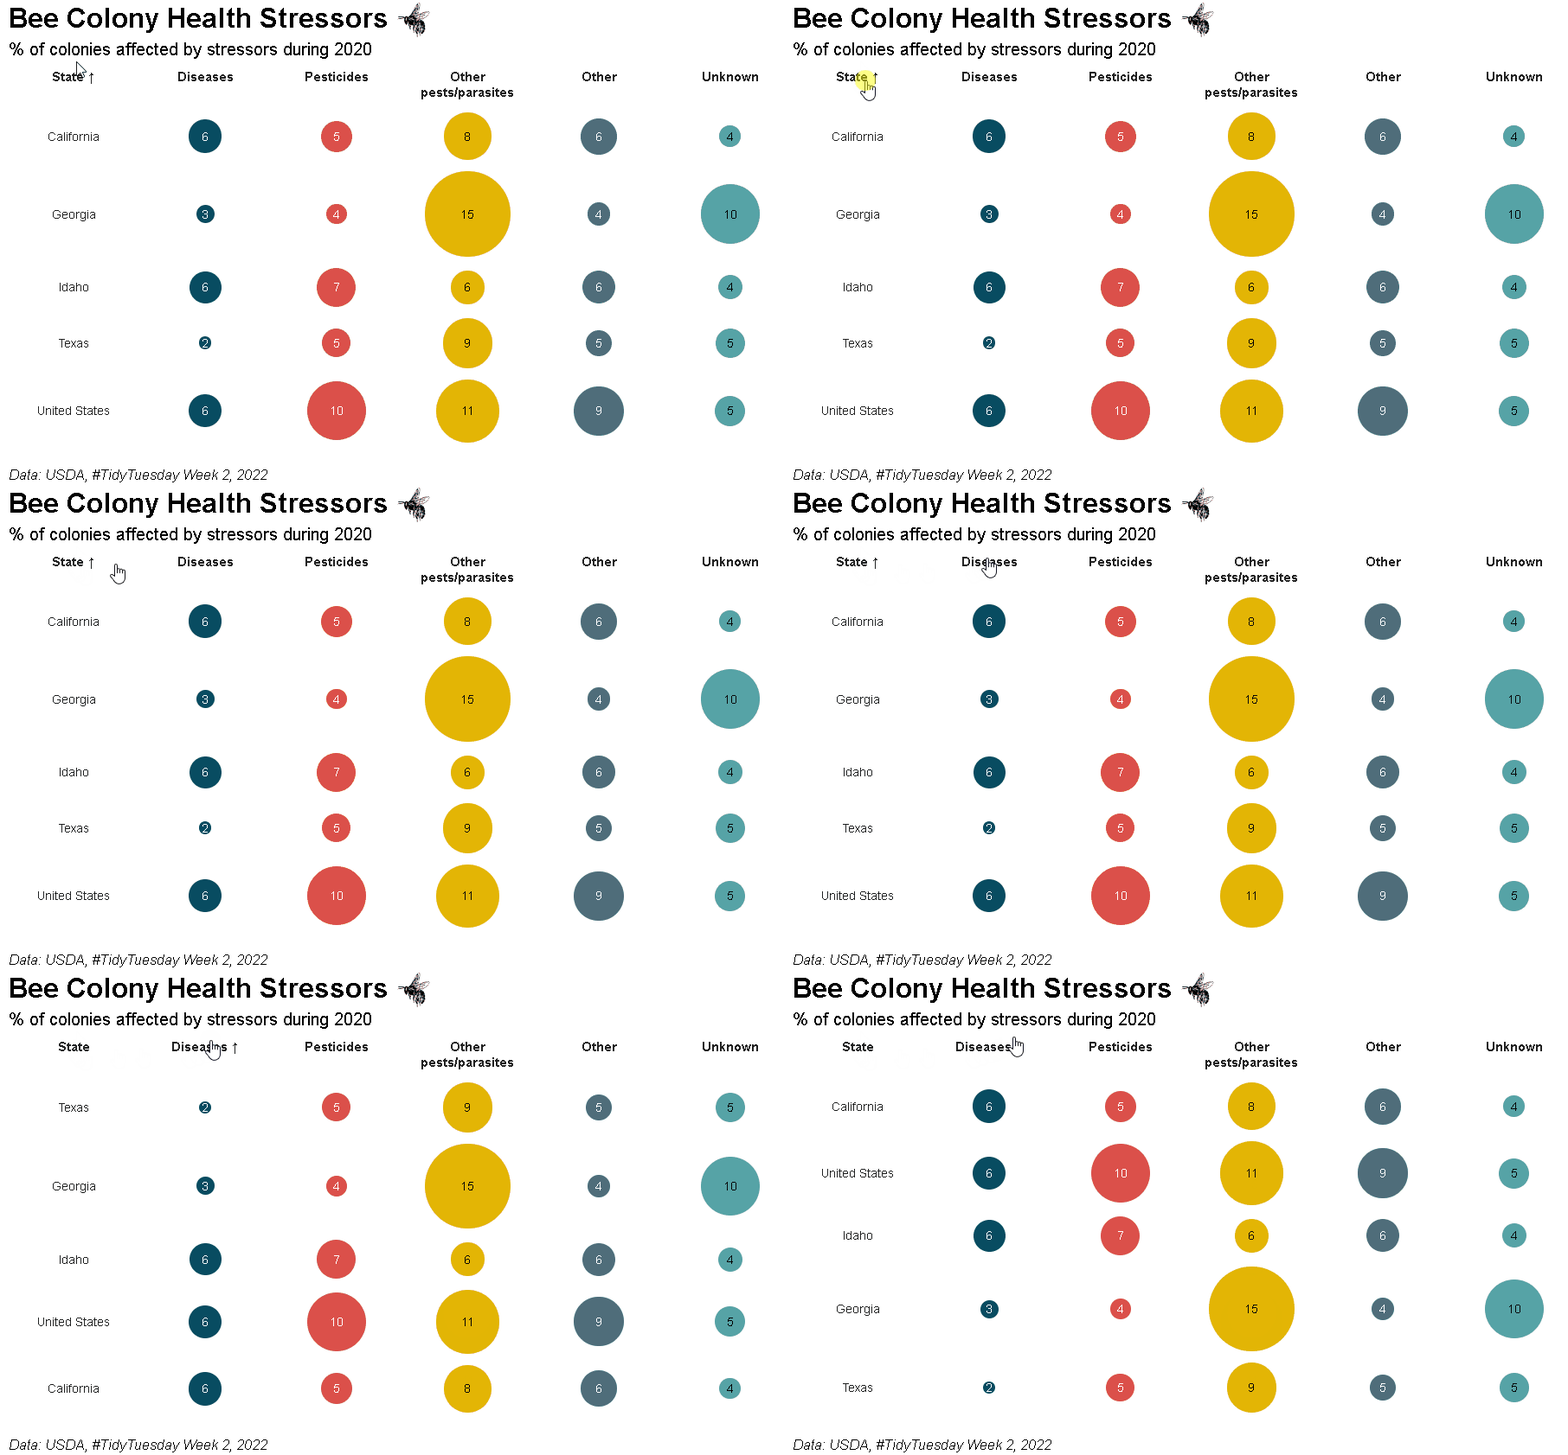
Bubble grid tables can be created using bubble_grid(). Bubbles can be shown as circles or squares using the shape parameter. To see how the example below was created, please check out the bubble grids section in the {reactablefmtr} cookbook:

Custom Themes

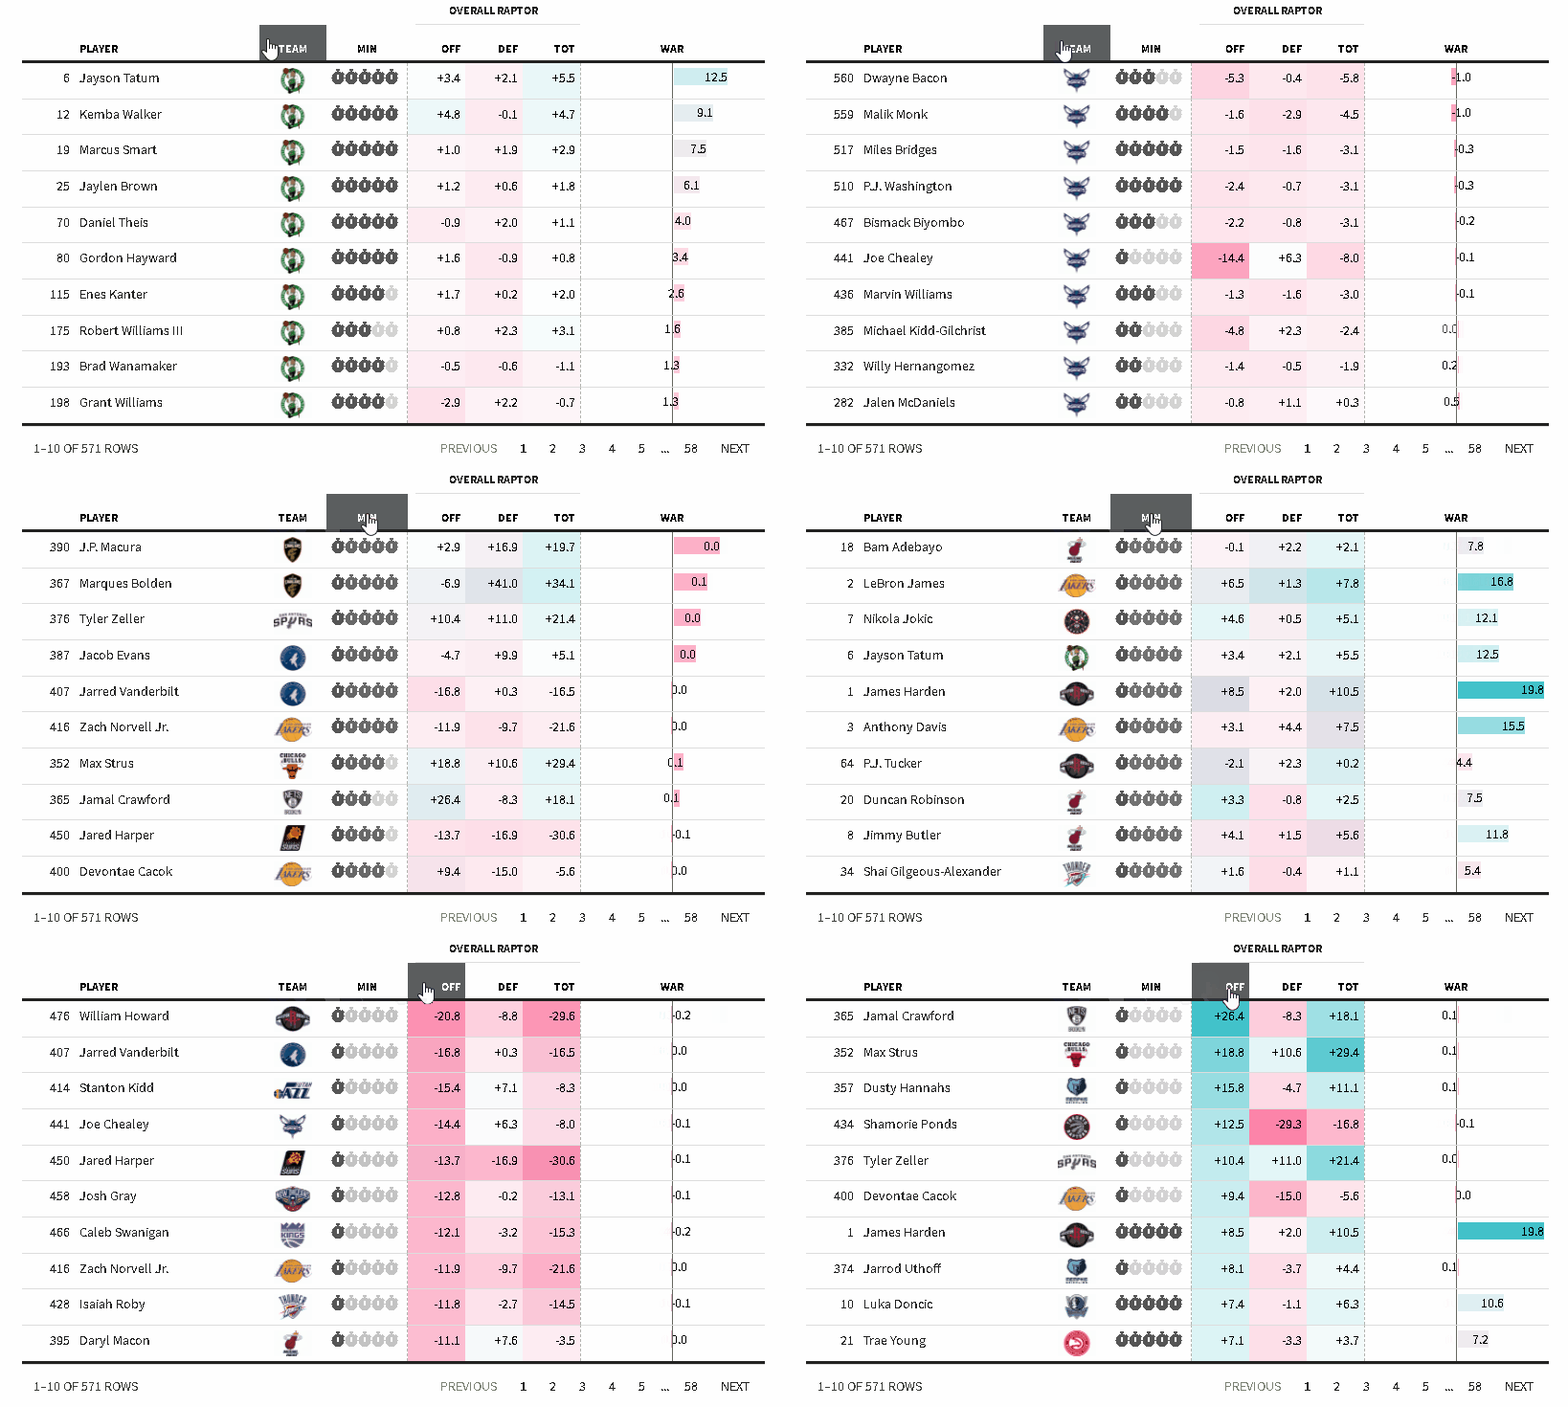
Within {reactablefmtr}, there are 24+ custom table themes. The themes include bootstrap themes, themes inspired by news/sports sites such as The New York Times, FiveThirtyEight, and ESPN, as well as other custom themes that can only be found within {reactablefmtr}. The themes can be applied easily to tables by simply referencing the theme name. Additional customization options, such as changing the font size, font color, etc. are also available.

An example of the fivethirtyeight() theme:

Using with Crosstalk or Shiny

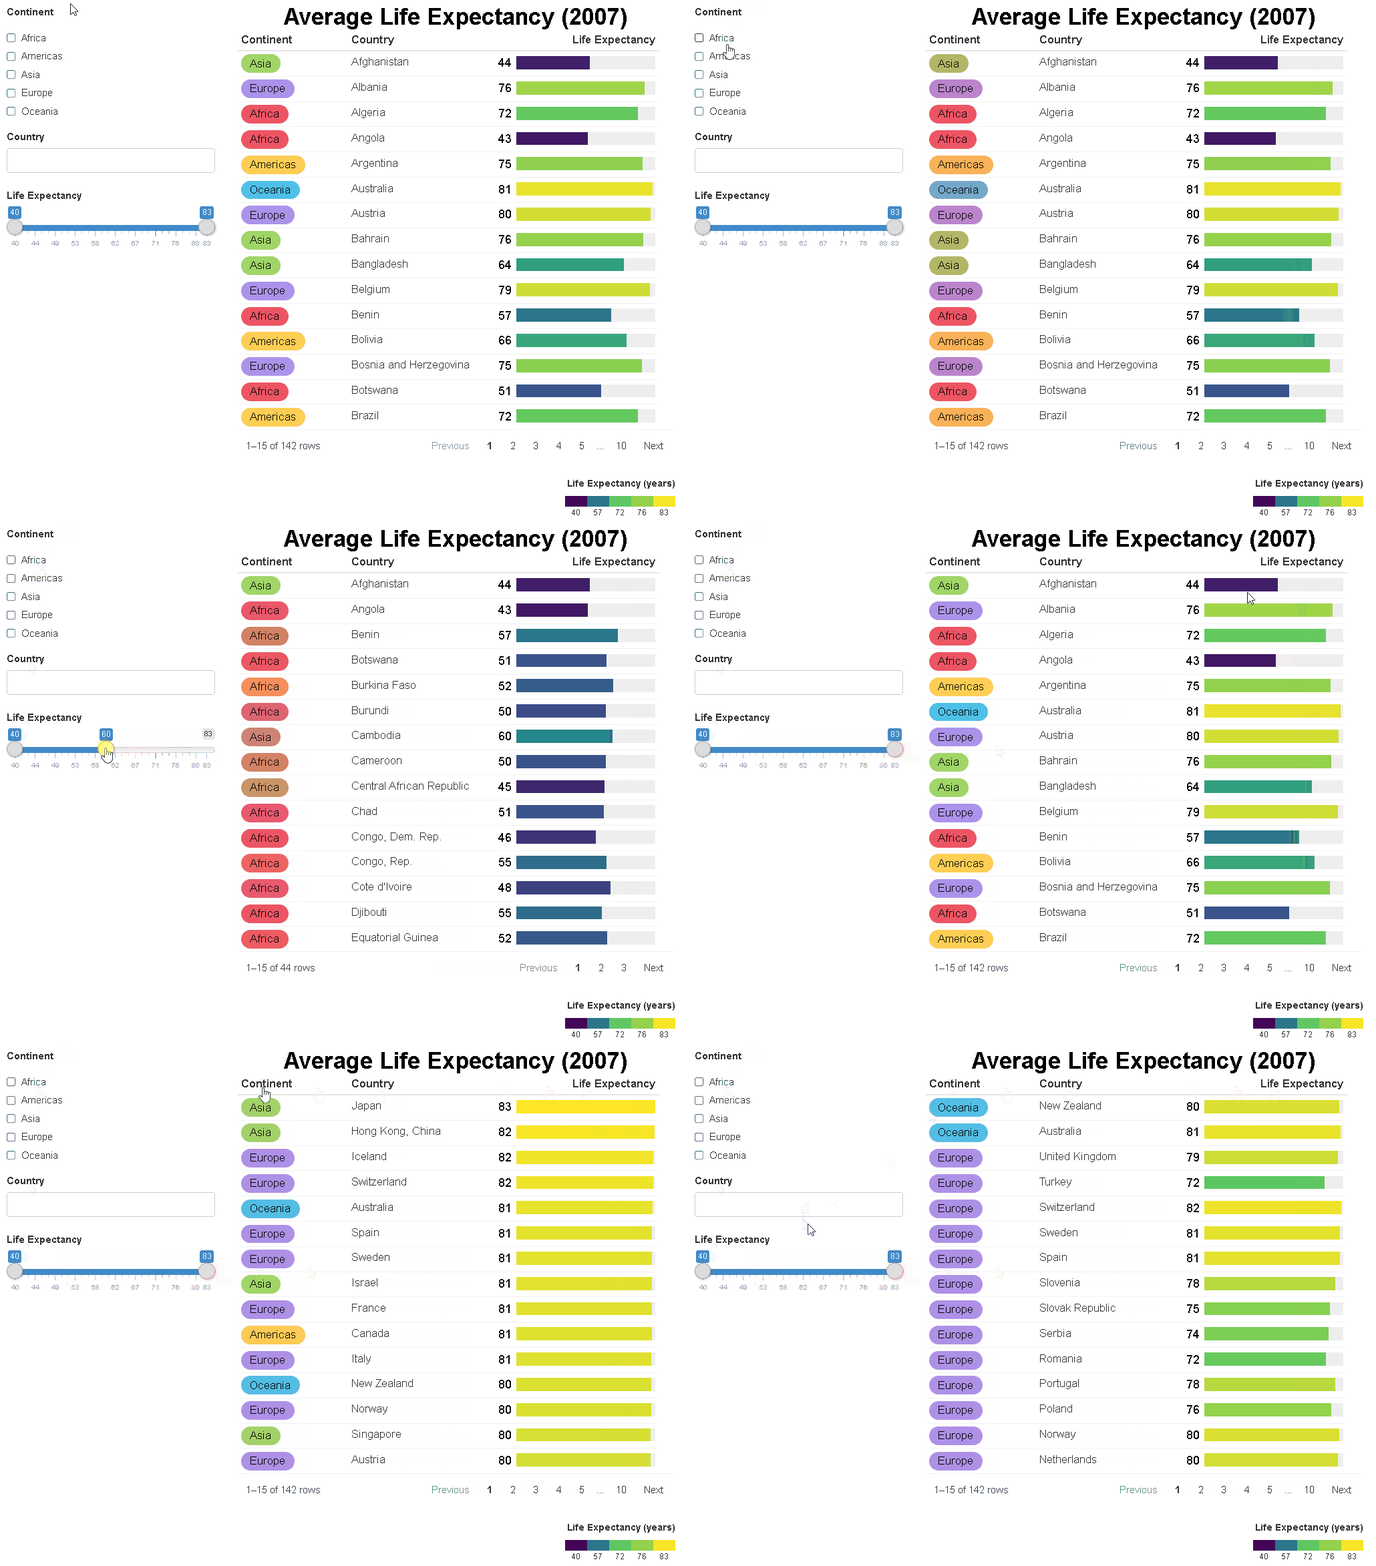
{reactablefmtr} works well when linked to UI controls via {crosstalk} or within a Shiny app.

Add a Title, Subtitle, and Source

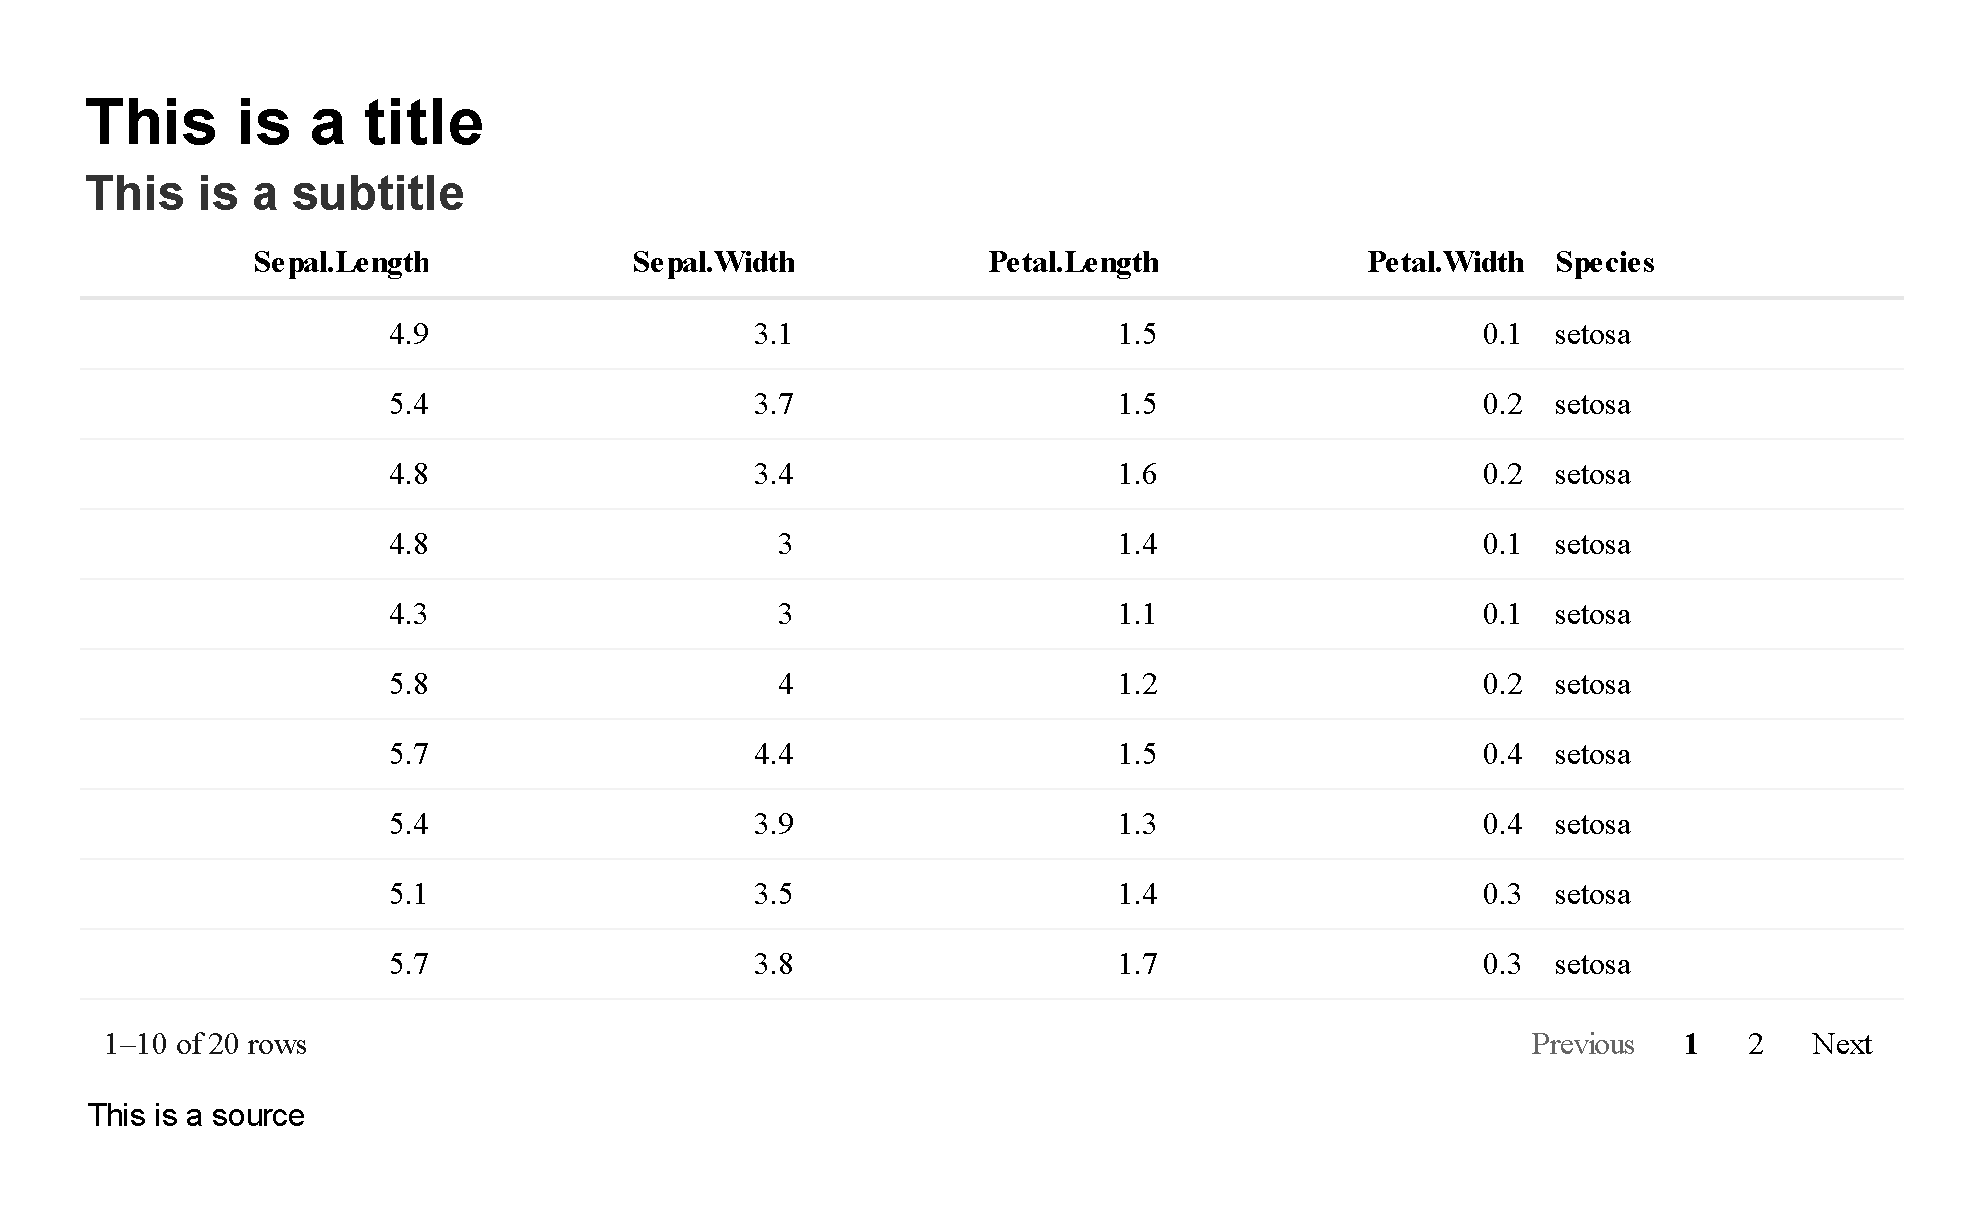
Titles and subtitles can be easily placed above any {reactablefmtr} or {reactable} table with add_title() and add_subtitle(). Also have the option to include a source below a table with add_source(). Additional customization options such as changing the alignment, font size, font family, font style, and font color are available within each formatter.

reactable(iris[10:29, ]) %>%
  add_title("This is a title") %>% 
  add_subtitle("This is a subtitle") %>% 
  add_source("This is a source")

Create Data Visualizations

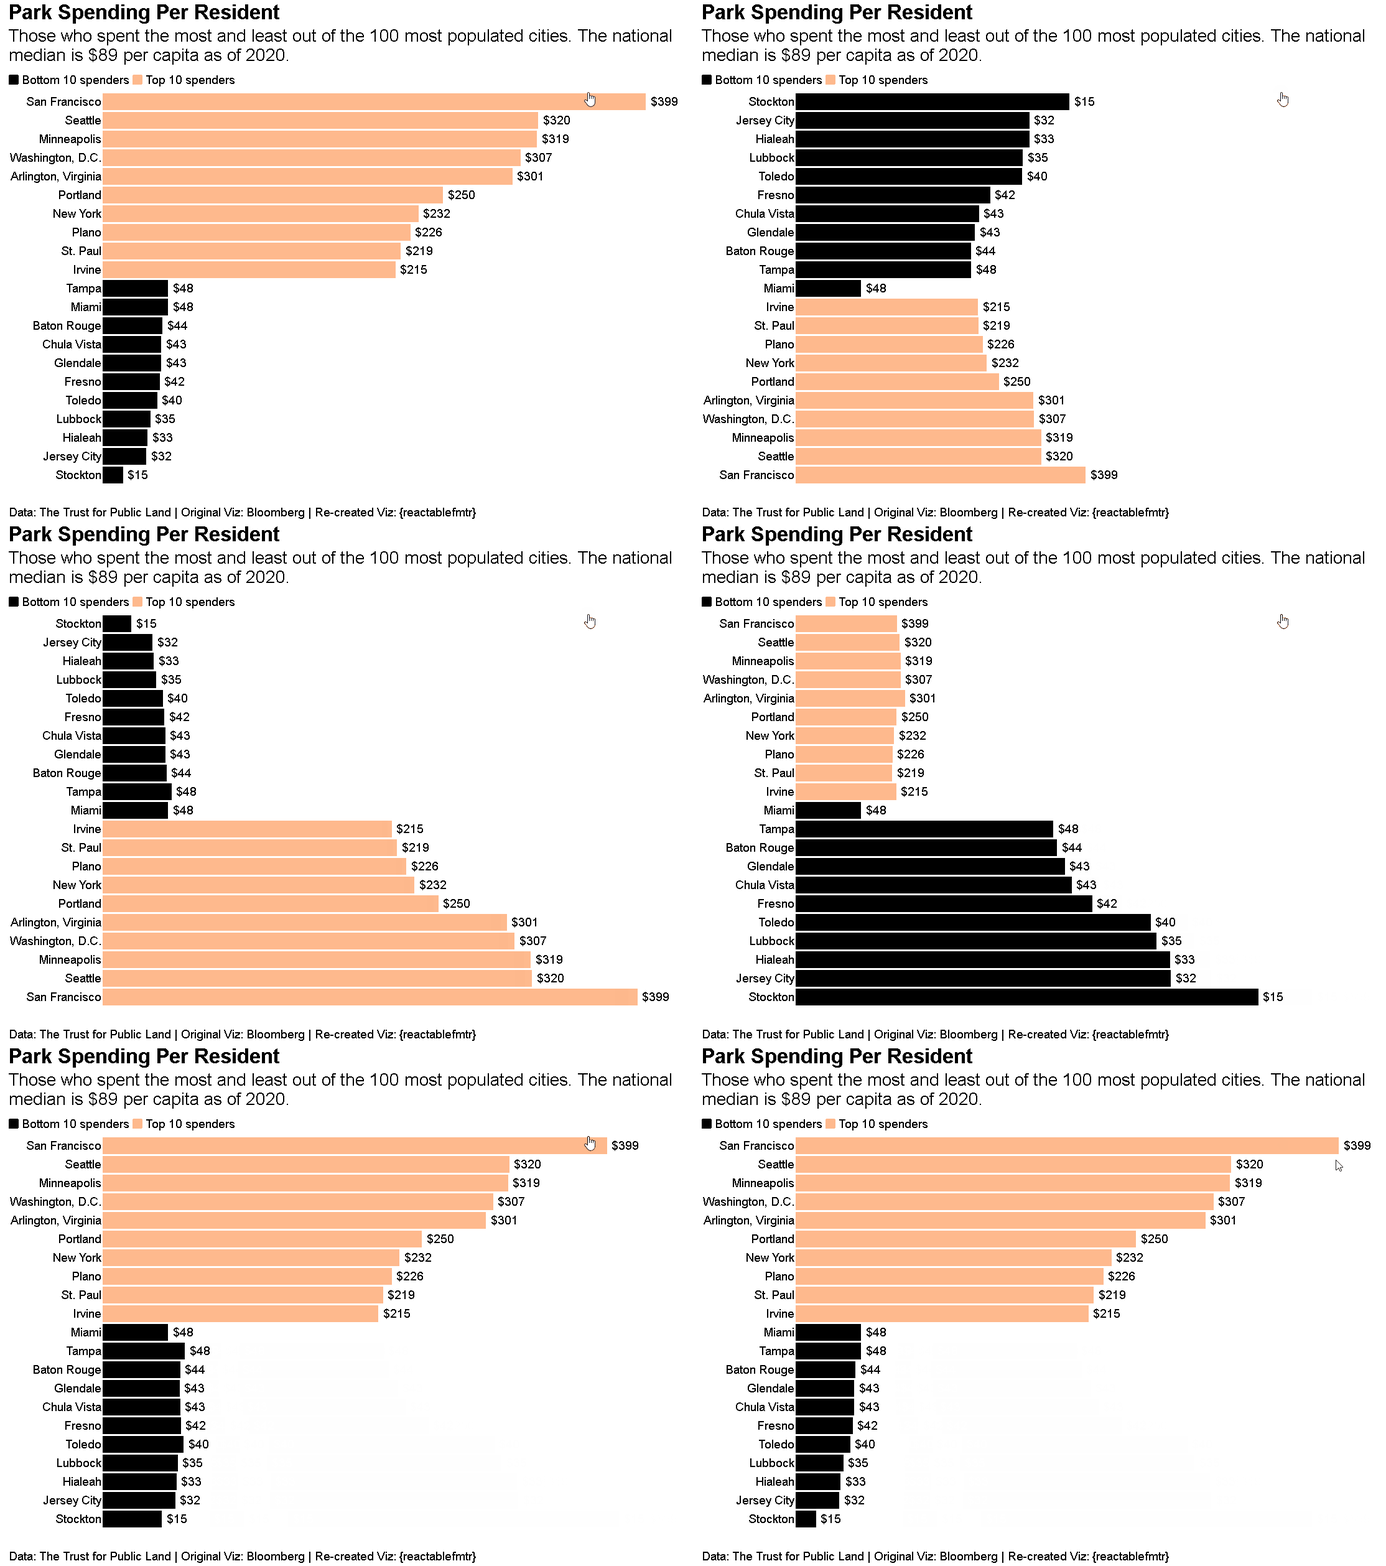
Who says {reactablefmtr} can just be used to make tables? You can create data visualizations like the one shown below. Source code

Save Static or Interactive Tables

{reactablefmtr} or {reactable} tables can be saved directly to a file as a static PNG image or as an interactive HTML file with save_reactable().

Save as a PNG file:

save_reactable(table_name, "table.png")

Save as an HTML file:

save_reactable(table_name, "table.html")

If custom CSS styling is applied to the table within an R Markdown document:

save_reactable("table_name.Rmd", "table.png")

If you prefer to use a pipe:

table_name %>%
save_reactable("table.png")

Additional Resources

A presentation given to the SoCal R Users Group: https://rpubs.com/kcuilla/reactablefmtr-socal-presentation

Acknowledgments & Contributions

  • A huge thank you to Greg Lin for creating the amazing {reactable} package! Without Greg, {reactablefmtr} simply would not exist!

  • Thank you to Kent Russell for putting together the wonderful {dataui} package and suggesting integrating the code with {reactablefmtr} to allow interactive sparkline customization in reactable tables.

  • Last but not least, thank you to those below who have contributed to the development and/or documentation of the package! @yjunechoe, @shannonpileggi, @TimTeaFan

reactablefmtr's People

Stargazers

 avatar  avatar  avatar  avatar  avatar  avatar  avatar  avatar  avatar  avatar  avatar  avatar  avatar  avatar  avatar  avatar  avatar  avatar  avatar  avatar  avatar  avatar  avatar  avatar  avatar  avatar  avatar  avatar  avatar  avatar  avatar  avatar  avatar  avatar  avatar  avatar  avatar  avatar  avatar  avatar  avatar  avatar  avatar  avatar  avatar  avatar  avatar  avatar  avatar  avatar  avatar  avatar  avatar  avatar  avatar  avatar  avatar  avatar  avatar  avatar  avatar  avatar  avatar  avatar  avatar  avatar  avatar  avatar  avatar  avatar  avatar  avatar  avatar  avatar  avatar  avatar  avatar  avatar  avatar  avatar  avatar  avatar  avatar  avatar  avatar  avatar  avatar  avatar  avatar  avatar  avatar  avatar  avatar  avatar  avatar  avatar  avatar  avatar  avatar  avatar

Watchers

 avatar  avatar  avatar  avatar  avatar  avatar  avatar  avatar  avatar

reactablefmtr's Issues

Gauge Chart fill

Im having issues with the color fill of reactablefmtr::gauge_chart using the following R code.

HIT.Accels = colDef(name = "HIT Accels",
align = "center",
maxWidth = 55,
aggregate = "mean", format = colFormat(digits = 0),
cell = reactablefmtr::gauge_chart(
data = .,
fill_color = c("#DB7911A5", "#DB934691","white", "#4CBBC7A1", "#00AFBFA1"),
background = "white",
show_min_max = TRUE,
number_fmt = scales::comma,
bold_text = TRUE,
opacity = 0.5
),
footer = function(values) sprintf("%.1f", mean(values))
),

The above causes the fill colors of the gauge to "spill out" toward the upper edges of each cell (picture below).

Any help would be appreciated.

gauge spill

Data bars / color scales with aggregated data using groupBy

Hello,

When creating a reactable with an argument groupBy set to a specific column, and defining a aggregate function for another column, the aggregated level will not have any data bars rendered.

I couldn't find any relevant info in the documentation. It this something that could be solved?

I guess that a quick workaround is to create an embedded sub-table using expanded rows, but this is not a perfect solution.

Maybe update to webshot2 in save_reactable?

I used the package for the first time and liked it a lot! Unfortunately I had some strange results when using the save_reactable function to make a .png. My table was in black and white and the icons where a little different. I saw that the package uses webshot, but apparently there is a sucessor to it called webshot2. When I saved an html version of the table and used webshot to make a snapshot of the page, the table rendered correctly. Maybe it would be better to change to webshot2, since the function webshot (used in save_reactable) seems pretty similar in the new package?

color_scales formatting disappears when used with crosstalk

Hi there,

I am trying to use color_scales on a reactable that's filtered by crosstalk.

This example is taken from the reactablefmtr docs, except for the added SharedData line:

library(crosstalk)
library(reactable)
library(reactablefmtr)

data <- MASS::Cars93 %>% 
  filter(Type %in% c("Compact", "Sporty", "Van")) %>% 
  select(c("Make", "Type", "MPG.city", "MPG.highway")) %>% 
  head(10)

data <- SharedData$new(data)  ### The offending line

reactable(
  data,
  defaultSorted = "MPG.city",
  defaultSortOrder = "desc",
  columns = list(
    MPG.city = colDef(
      style = color_scales(data)
    )
  )
)

When the SharedData line is excluded, the MPG.city column is colored correctly, however when that line is included, the color formatting goes away, and I get a whole host of warnings that I can't decipher:

There were 40 warnings (use warnings() to see them)
> warnings()
Warning messages:
1: In min(data[[name]], na.rm = TRUE) :
  no non-missing arguments to min; returning Inf
2: In max(data[[name]], na.rm = TRUE) :
  no non-missing arguments to max; returning -Inf
3: In min(data[[name]], na.rm = TRUE) :
  no non-missing arguments to min; returning Inf
4: In matrix(offset, nrow = 4L, ncol = ncol(x)) :
  data length exceeds size of matrix
5: In min(data[[name]], na.rm = TRUE) :
  no non-missing arguments to min; returning Inf
6: In max(data[[name]], na.rm = TRUE) :
  no non-missing arguments to max; returning -Inf
7: In min(data[[name]], na.rm = TRUE) :
  no non-missing arguments to min; returning Inf
8: In matrix(offset, nrow = 4L, ncol = ncol(x)) :
  data length exceeds size of matrix
9: In min(data[[name]], na.rm = TRUE) :
  no non-missing arguments to min; returning Inf
10: In max(data[[name]], na.rm = TRUE) :
  no non-missing arguments to max; returning -Inf
11: In min(data[[name]], na.rm = TRUE) :
  no non-missing arguments to min; returning Inf
12: In matrix(offset, nrow = 4L, ncol = ncol(x)) :
  data length exceeds size of matrix
13: In min(data[[name]], na.rm = TRUE) :
  no non-missing arguments to min; returning Inf
14: In max(data[[name]], na.rm = TRUE) :
  no non-missing arguments to max; returning -Inf
15: In min(data[[name]], na.rm = TRUE) :
  no non-missing arguments to min; returning Inf
16: In matrix(offset, nrow = 4L, ncol = ncol(x)) :
  data length exceeds size of matrix
17: In min(data[[name]], na.rm = TRUE) :
  no non-missing arguments to min; returning Inf
18: In max(data[[name]], na.rm = TRUE) :
  no non-missing arguments to max; returning -Inf
19: In min(data[[name]], na.rm = TRUE) :
  no non-missing arguments to min; returning Inf
20: In matrix(offset, nrow = 4L, ncol = ncol(x)) :
  data length exceeds size of matrix
21: In min(data[[name]], na.rm = TRUE) :
  no non-missing arguments to min; returning Inf
22: In max(data[[name]], na.rm = TRUE) :
  no non-missing arguments to max; returning -Inf
23: In min(data[[name]], na.rm = TRUE) :
  no non-missing arguments to min; returning Inf
24: In matrix(offset, nrow = 4L, ncol = ncol(x)) :
  data length exceeds size of matrix
25: In min(data[[name]], na.rm = TRUE) :
  no non-missing arguments to min; returning Inf
26: In max(data[[name]], na.rm = TRUE) :
  no non-missing arguments to max; returning -Inf
27: In min(data[[name]], na.rm = TRUE) :
  no non-missing arguments to min; returning Inf
28: In matrix(offset, nrow = 4L, ncol = ncol(x)) :
  data length exceeds size of matrix
29: In min(data[[name]], na.rm = TRUE) :
  no non-missing arguments to min; returning Inf
30: In max(data[[name]], na.rm = TRUE) :
  no non-missing arguments to max; returning -Inf
31: In min(data[[name]], na.rm = TRUE) :
  no non-missing arguments to min; returning Inf
32: In matrix(offset, nrow = 4L, ncol = ncol(x)) :
  data length exceeds size of matrix
33: In min(data[[name]], na.rm = TRUE) :
  no non-missing arguments to min; returning Inf
34: In max(data[[name]], na.rm = TRUE) :
  no non-missing arguments to max; returning -Inf
35: In min(data[[name]], na.rm = TRUE) :
  no non-missing arguments to min; returning Inf
36: In matrix(offset, nrow = 4L, ncol = ncol(x)) :
  data length exceeds size of matrix
37: In min(data[[name]], na.rm = TRUE) :
  no non-missing arguments to min; returning Inf
38: In max(data[[name]], na.rm = TRUE) :
  no non-missing arguments to max; returning -Inf
39: In min(data[[name]], na.rm = TRUE) :
  no non-missing arguments to min; returning Inf
40: In matrix(offset, nrow = 4L, ncol = ncol(x)) :
  data length exceeds size of matrix

Any help would be most appreciated.

Cannot install developers version from github

Hello,

I use this code remotes::install_github("kcuilla/reactablefmtr") and installed dataui package too and i get this message:
Why is this happening??

  • installing source package 'reactablefmtr' ...
    ** using staged installation
    ** R
    ** byte-compile and prepare package for lazy loading
    Error: (converted from warning) package 'reactable' was built under R version 4.0.5
    Execution halted
    ERROR: lazy loading failed for package 'reactablefmtr'
  • removing 'F:/R/R-4.0.3patched/library/reactablefmtr'
    Error: Failed to install 'reactablefmtr' from GitHub:
    (converted from warning) installation of package ‘C:/Users/swtos/AppData/Local/Temp/Rtmp2Bddud/file1c14231638/reactablefmtr_1.1.0.tar.gz’ had non-zero exit status
    In addition: Warning messages:
    1: In untar2(tarfile, files, list, exdir) :
    skipping pax global extended headers
    2: In untar2(tarfile, files, list, exdir) :
    skipping pax global extended headers

`color_scales` not consistent in coloring `NA`

I would like all cells containing NA values to be with a white background but there seem to be a bug preventing it. (Full repex below).

With reactable v0.3.0 and reactablefmtr v2.0.0.
SCR-20221122-edu

SCR-20221122-ed5

library(reactable)
library(reactablefmtr)

data_reactable <- 
  structure(list(`Visit Status Aggregate` = c("Withdrawn", "Pending", 
  "Missed (unexplained)", "Missed (explained)", "Completed"), Baseline = c(NA, 
   NA, NA, NA, 11878L), `0.5 Year` = c(26L, NA, 4L, 462L, 11386L
   ), `1 Year` = c(69L, NA, 8L, 571L, 11230L), `1.5 Year` = c(89L, 
  NA, 4L, 694L, 11091L), `2 Year` = c(127L, NA, 11L, 750L, 10990L
  ), `2.5 Year` = c(141L, NA, 29L, 1376L, 10332L), `3 Year` = c(169L, 
NA, 63L, 1160L, 10486L), `3.5 Year` = c(191L, NA, 171L, 1800L, 
9716L), `4 Year` = c(241L, 1427L, 142L, 1080L, 8988L), `4.5 Year` = c(247L, 
  3095L, 1223L, 1432L, 5881L), `5 Year` = c(258L, 7214L, 279L, 
248L, 3879L), `5.5 Year` = c(258L, 9568L, 326L, 170L, 1556L), 
 `6 Year` = c(258L, 11517L, NA, 1L, 102L)), row.names = c(NA, 
  -5L), class = c("tbl_df", "tbl", "data.frame"))


 def_column <- function(data) {
  columns <- setdiff(names(data), "Visit Status Aggregate") 
  c(
    rep(
      x = list(
        xaxis = colDef(
          align = "center",
          cell = function(value, index, name) {
            denom <- (data |> dplyr::pull(name) |> sum(na.rm = TRUE))
            if (is.na(value)) return("-")
            return(glue::glue("{format(value, big.mark = ',')} </br><small>{scales::label_percent(accuracy = 0.1)(value / denom)}</small>"))
          }
        )
      ),
      times = length(columns)
    ) |> 
      setNames(columns)
  )
}


reactable(
  data_reactable, 
  outlined = TRUE,
  pagination = FALSE,
  defaultColDef = colDef(
    style = color_scales(
      data_reactable,
      colors = RColorBrewer::brewer.pal(9, "Blues")[3:9]
    ),
    html = TRUE
  ),
  columns = def_column(
    data = data_reactable
  )
)

data_bars: text_position="inside-base" leads to different vertical (!) alignment of bar

I am encountering a strange behavior when using the cell=data_bars function. For some reason the bars and corresponding numbers are vertically (!) differently aligned when using text_position="inside-base".

Capture

The error appears when using the function in a distill post. When trying to replicate it in a simple markdown file, the error doesn't show up.

Any idea what that could be due to? I have no idea what I could be looking out for.
I am using the latest dev version.

Many thanks again!

icon_assign fails with error when data is all zero values

I have a reactable with nested values. In some of the nested data, the values to be represented by icons using icon_assign are all zero.

When this is the case, it fails with the error

Error in seq.default(1, max_value, by = seq_by) : wrong sign in 'by' argument

The code below shows this (I haven't included the nesting as this isn't actually the problem). See https://stackoverflow.com/questions/71428577/incorrect-no-of-icons-assigned-in-reactablefmtr-icon-assign

library(reactable)
library(reactablefmtr)
areas <- data.frame(name = c("One", "Two", "Three", "Four", "Five", "Six", "Seven", "Eight", "Nine", "Ten"))
areas$responseCount <- 0 #round(runif(nrow(areas), min = 0, max = 1) * 4)

reactable(
  areas,
  columns = list(
    responseCount = colDef(name = "Responses",
                           cell = icon_assign(areas, #buckets = 4, 
                                              show_values = "left")
    )
  )
)

The add_title() function does not work in shiny.

Thank you for this wonderful package. When using the add_title() function in shiny, no title is displayed. see:

library(shiny)
library(reactable)
library(reactablefmtr)

ui <- fluidPage(
  reactableOutput(outputId = "table")
)

server <- function(input, output, session) {
  output$table <- renderReactable({
    reactable(data = mtcars) |>
      add_title(title = "Motor Trend Car Table")
  })
}
shinyApp(ui, server)

table_with_no_title

Using the function without shiny:

reactable(data = mtcars) |>
  add_title(title = "Motor Trend Car Table")

table_with_title

R.version
platform x86_64-w64-mingw32
arch x86_64
os mingw32
crt ucrt
system x86_64, mingw32
status
major 4
minor 2.1
year 2022
month 06
day 23
svn rev 82513
language R
version.string R version 4.2.1 (2022-06-23 ucrt)
nickname Funny-Looking Kid

> packageVersion("reactable")
[1] ‘0.3.0> packageVersion("reactablefmtr")
[1] ‘2.0.0> packageVersion("shiny")
[1] ‘1.7.2

add_source/margin - allow to adjust vertical distance separately

Again, many thanks for this package which I come to use quite regularly now.

One suggestion: It would be great if the vertical distance between the table and the source text could be reduced without altering the horizontal positioning of the source text. As of now, in my opinion, the default distance (4) between the table and the source (add_source) is too large. To reduce it, with the the margin parameter, however, also changes the horizonal positioning of the source text. Furthermore, to move it sufficiently closer to the table, I have to use negative margin values, which seems a bit odd.

Please take this only as an opinionated take and a mere proposal. thx again.

image

image

Color scale borders

Hi

Just have to say again this is a great package!

Was just wondering - when using color_scale to build a heat map is it possible to apply slight borders to differentiate each tile similar to the effect you would get when adding a border to geom_tile in a ggplot heat map?

Thanks

Michael

google_font not showing correctly in .png via save_reactable() / save_reactable_test()

Hi

I have used google_font within my reactable() table and I am trying to save the table as a .png. However, the google_font does not correctly show up. See below for code an two outputs (html vs png).

webshot::install_phantomjs() remotes::install_github("kcuilla/reactablefmtr") library(reactablefmtr)

save_reactable_test(line_breaks,"line_breaks.html") save_reactable_test(line_breaks,"line_breaks.png")

PNG
line_breaks

HTML screenshot
image

add_source: line-height

I would like to change the vertical distance between two lines in a table's source, but the line-height seems not to work.
Any idea? Many thanks!

library(reactable)
library(reactablefmtr)
library(tidyverse)

mtcars %>%
reactable() %>%
add_source(source=html("<span style='line-height:10%;'>This is a very long<br>long long text</span>"))

Created on 2023-04-12 with reprex v2.0.2

data_bars: text_position = "outside-base" leads to different horizontal alignment of bars

Thanks for making this useful extension package!

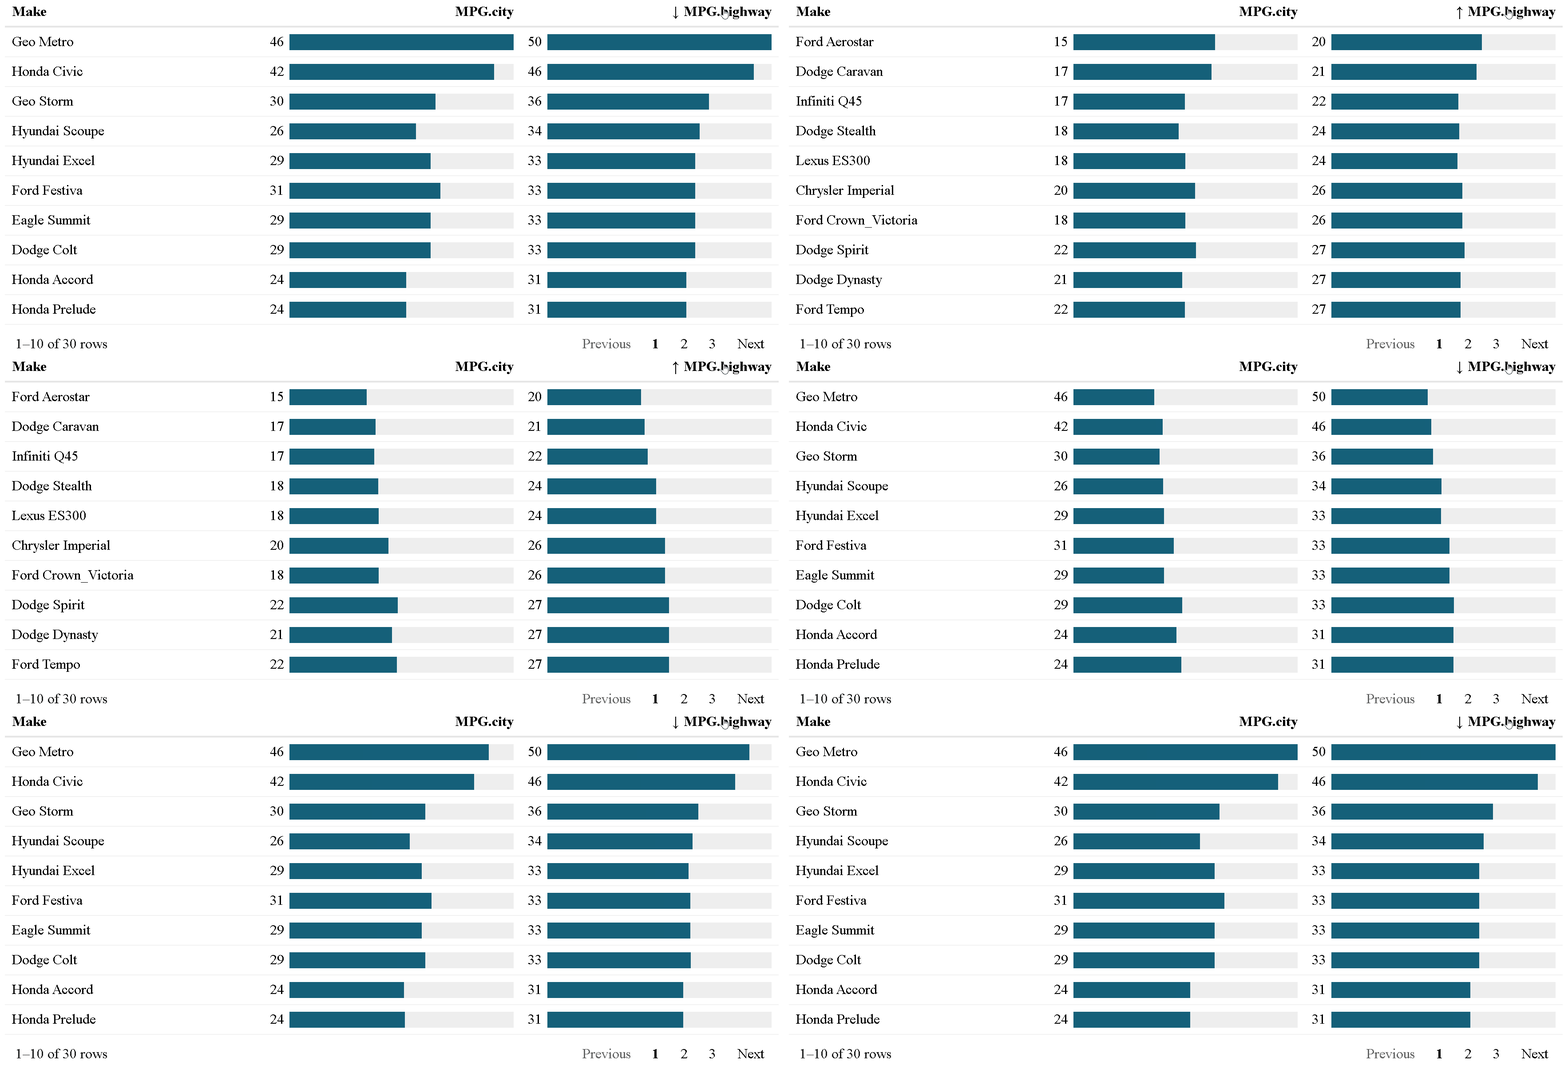
For readability, I'm trying to position the text on the left-hand side of the bars using text_position = "outside-base" but it's leading to a misalignment of the bars due differences in the width of the text. Even when using number_fmt = scales::label_percent(trim = FALSE) which produces strings of equal width, I can't align the bars.

library(dplyr)
library(reactablefmtr)

iris %>% 
  group_by(Species) %>%
  summarise(petal_length_low = mean(Petal.Length < 4)) %>% 
  reactable(
    columns = list(
      petal_length_low = colDef(
        cell = data_bars(., 
                         text_position = "outside-base", 
                         number_fmt = scales::label_percent(trim = FALSE))
      )
    )
  )
  
# Text descriptions have equal width
scales::label_percent(trim = FALSE)(c(1, 0.22, 0))
[1] "100%" " 22%" "  0%"

I'm surprised this is happening though, as I'm using the latest version from github (2.1.0) and the source code seems to try and deal with this situation via stringr::str_pad() (see here).

different font weights or colors for only some words in add_subtitle

Many thanks for this powerful package.

Is there any way to highlight only some words (e.g. bold, different color) when using add_subtitle.
It tried add_subtitle(subtitle="text text <span style='color:red;'>text to highlight</span> text text") but without luck. Any idea?

Many thanks again.

color_scales / color_tiles assign colors based on another column

Hi Kyle! 👋 Thank you for this awesome package, I'm having so much making tables with the incredible {reactable} + {reactablefmtr} combo!

I am interested in assigning colors to a column by the value of another column. It looks like the color_ref option has the colors hard coded, but I am interested in a sort of color_by argument that allows for color_scales to work its magic✨ without hard coding.

Here is an example:

library(reactable)
library(reactablefmtr)
library(tidyverse)
#> Warning: package 'tibble' was built under R version 4.1.2
#> Warning: package 'tidyr' was built under R version 4.1.2
library(glue)
#> 
#> Attaching package: 'glue'
#> The following object is masked from 'package:dplyr':
#> 
#>     collapse

iris_mod <- iris %>% 
  group_by(Species) %>% 
  summarize(
    n_total = n(),
    n_length_gt_5 = sum(Sepal.Length > 5),
    pct_length_gt_5 = n_length_gt_5 / n_total,
    length_label = glue("{n_length_gt_5} ({scales::percent(pct_length_gt_5, 0.1)})")
  ) %>% 
  ungroup() 

reactable(
  iris_mod,
  columns = list(
    pct_length_gt_5 = colDef(style = color_scales(iris_mod))
  )
)

Created on 2022-01-28 by the reprex package (v2.0.1)

My goal would be to have length_label colored by the value of pct_length_gt_5, and then to hide n_length_gt_5 and pct_length_gt_5.

Please let me know if this is already a possibility and I missed it! Or otherwise, what you think about this feature.

Many thanks!

Set y axis limit in `react_sparkline` in each row separately

It would be great if we could set the y axis limits min_value and max_value in react_sparkline in each row separately. Ideally we would have different options. For example:

  1. one value (numeric vector of length 1) which is used for all sparklines
  2. a vector of length equal to the number of rows to set a specific min_value max_value in each row
  3. a string which specifies the column name (in the same data set) which holds the values for min_value or max_value (here too different values for each sparkline are possible)
  4. a function which is applied to the maximum or minimum values in each sparkline to calculate the max_ and min_value.

Ideally all of the examples below would work:

library(dplyr)
library(reactable)
library(reactablefmtr)
library(dataui) # this is needed for {reactablefmtr}'s sparklines

# the input data
set.seed(123)

mydat <- tibble(id = c("A", "B", "C"),
                data = list(sample(c(1:20), 20),
                            sample(seq(5, 100, by = 5), 20),
                            sample(seq(2.5, 50, by = 2.5), 20)
                ),
                max_limit = c(50, 150, 100),
                min_limit = c(-50, -100, 10)
)

# max_value vector of length nrow
reactable(mydat,
          columns = list(
            data = colDef(
              cell = react_sparkline(
                mydat,
                height = 80,
                show_area = TRUE,
                max_value = c(50, 100, 50),
                tooltip_type = 2
              )
            )
          )
)


# max_value function
reactable(mydat,
          columns = list(
            data = colDef(
              cell = react_sparkline(
                mydat,
                height = 80,
                show_area = TRUE,
                max_value = function(x) ceiling(x/50) * 50,
                tooltip_type = 2
              )
            )
          )
)


# max_value string as column name
reactable(mydat,
          columns = list(
            data = colDef(
              cell = react_sparkline(
                mydat,
                height = 80,
                show_area = TRUE,
                max_value = "max_limit",
                tooltip_type = 2
              )
            )
          )
)

# min_value vector of length nrow
reactable(mydat,
          columns = list(
            data = colDef(
              cell = react_sparkline(
                mydat,
                height = 80,
                show_area = TRUE,
                min_value = c(-50, 0, 25),
                tooltip_type = 2
              )
            )
          )
)

# min_value function
reactable(mydat,
          columns = list(
            data = colDef(
              cell = react_sparkline(
                mydat,
                height = 80,
                show_area = TRUE,
                min_value = function(x) floor(x/50) * 50 - 50,
                tooltip_type = 2
              )
            )
          )
)

# min_value string as column name
reactable(mydat,
          columns = list(
            data = colDef(
              cell = react_sparkline(
                mydat,
                height = 80,
                show_area = TRUE,
                min_value = "min_limit",
                tooltip_type = 2
              )
            )
          )
)

But I totally understand that this might be "too much" from an UI perspective. Maybe just one of these option is enough.

I'll submit a PR and lets see how it works out.

Sparkline Examples Don't Work for Me

Hello there,

I'm excited by the prospect of this package. But I can't get the example to run properly,

# Load packages
library(reactablefmtr)
library(tidyverse)
library(palmerpenguins)

df <- penguins %>%
  filter(!is.na(sex)) %>%
  group_by(species, sex) %>%
  summarize(flipper_length = list(flipper_length_mm))

reactable(
  df,
  columns = list(
    species = colDef(maxWidth = 90),
    sex = colDef(maxWidth = 85),
    flipper_length = colDef(
      cell = react_sparkline(df)
    )
  )
)

Gives me the error Error in loadNamespace(x) : there is no package called ‘dataui’.

My session info is included:

R version 4.2.0 (2022-04-22 ucrt)
Platform: x86_64-w64-mingw32/x64 (64-bit)
Running under: Windows 10 x64 (build 19044)

Matrix products: default

locale:
[1] LC_COLLATE=English_United States.utf8  LC_CTYPE=English_United States.utf8    LC_MONETARY=English_United States.utf8
[4] LC_NUMERIC=C                           LC_TIME=English_United States.utf8    

attached base packages:
[1] stats     graphics  grDevices utils     datasets  methods   base     

other attached packages:
 [1] palmerpenguins_0.1.0 forcats_0.5.1        stringr_1.4.0        dplyr_1.0.8          purrr_0.3.4          readr_2.1.2         
 [7] tidyr_1.2.0          tibble_3.1.6         ggplot2_3.3.6        tidyverse_1.3.1      reactablefmtr_2.1.0  reactable_0.3.0     

loaded via a namespace (and not attached):
 [1] tidyselect_1.1.2  haven_2.5.0       colorspace_2.0-3  vctrs_0.4.1       generics_0.1.2    htmltools_0.5.2   utf8_1.2.2       
 [8] rlang_1.0.2       pillar_1.7.0      glue_1.6.2        withr_2.5.0       DBI_1.1.3         dbplyr_2.1.1      modelr_0.1.8     
[15] readxl_1.4.0      lifecycle_1.0.1   munsell_0.5.0     gtable_0.3.0      cellranger_1.1.0  rvest_1.0.2       htmlwidgets_1.5.4
[22] tzdb_0.3.0        fastmap_1.1.0     crosstalk_1.2.0   fansi_1.0.3       broom_0.8.0       scales_1.2.0      backports_1.4.1  
[29] jsonlite_1.8.0    fs_1.5.2          hms_1.1.1         digest_0.6.29     stringi_1.7.6     grid_4.2.0        cli_3.2.0        
[36] tools_4.2.0       magrittr_2.0.3    sass_0.4.1        crayon_1.5.1      pkgconfig_2.0.3   ellipsis_0.3.2    xml2_1.3.3       
[43] reprex_2.0.1      lubridate_1.8.0   assertthat_0.2.1  httr_1.4.3        rstudioapi_0.13   R6_2.5.1          compiler_4.2.0   

Is it possible to save table as a pdf or svg file ?

First of all thank you very much for such a nice package. Its really great. I have few quires regarding the saving format. Is it possible to save it as an image like svg format? Can we change the column width according to our own choice? How to get publication ready images?

Thank you

Stacked or multiple bars in a column?

Hi, I've been searching to see whether this is possible either in reactable base or fmtr and so far haven't been able to see it anywhere. So, wanted to ask if its possible and if not submit as an enhancement request.

Is there currently any way to make stacked bars? Or to add 2 bars to a column so that one would render on top of the other? Or, to control the width of the bar background color with a data mapping?

One use case to help illustrate what I mean is that I'd like to show spending out of different department's budgets so that one bar is the total of what they are able to spend, and then have one on top that represents what they've actually spent.

Thanks!

background color

Hi and thanks for reading me. Its possible to change the background color using a custom theme?

`color_tiles()` ignores `colDef`s `na=` argument

I wanted to use color_tiles and came across the issue that it ignores the na= argument from colDef and prints out the missing values as NA.

library(reactable)
library(reactablefmtr)
library(dplyr)

tile_column <- function(x) {
  colDef(
    show = TRUE, 
    na = "",
    cell = color_tiles(
      x,
      colors = c("red", "orange", "yellow", "limegreen", "green"),
      number_fmt = scales::percent_format(scale = 1, accuracy = .1, decimal.mark = ",", big.mark = "."),
      box_shadow = TRUE,
    )
  )
}

data <- tibble(
  col1 = c(1, 4, 2, 5, NA_integer_, 2),
  col2 = c(2, 1, 2, NA_real_, NA_real_, 2),
)

data |> reactable() ## works -> no NAs are printed

data %>%
  reactable(
    columns = list(
      col1 = tile_column(.),
      col2 = tile_column(.)
    )
  ) ## does not work

Can you please have a look and maybe fix this?

Manually setting colour scale ranges

Hi - I was hoping it would be possible to get some help with applying the cooler fills to cells based on cell value.

I have been working at this but so far haven't been able to find out how to control the end ranges of the fill colours. For example if I wanted my colours to go from white to black (#ffffff to #333333) on a 0 to 100 scale but where the data only ranges from 20 to 80. So I don't want the lowest value within my data to be white - rather want it to be coloured within a scale of 0-100?

Is it possible to control the ranges in this way?

Thanks

Michael

Cant install package

Hello i have the following issue,

remotes::install_github("kcuilla/reactablefmtr")
Error: Failed to install 'unknown package' from GitHub:
HTTP error 404.
No commit found for the ref master

Did you spell the repo owner (kcuilla) and repo name (reactablefmtr) correctly?

  • If spelling is correct, check that you have the required permissions to access the repo.

Whay is this happening and how i can install your package?

Thank you

pill_button tooltip

Hi, is there a way to configurate a text to display in the tooltip option of the pill_button function?
Thank you!

conditional formatting color in color_tiles

Hi,

Is it possible to define color based on condition in color_tiles? For example, I would like to apply color_tiles only if the value is lower than 0
I created a function "f_stylefunc" to assign color, it is just returning a color if it is lower than 1.5, and "white" if it is higher than 1.5. But I could not find how to assign value inside function.
Thank you in advance for your help

`
data <- iris[10:29, ]

f_colorpal <- function(value){
if (value > 1.5) {
color <- "#FFFFFF"
} else {
color <- "#E75400"
}
}
reactable(data, columns = list(
Petal.Length = colDef(cell= color_tiles(data, colors = f_colorpal))
)
)
`

data_bars shows empty bars when column is all the same number

When a column is all the same number, empty bars are shown:

library(reactablefmtr)

data <- data.frame(
  Pct1 = rep(1, 15),
  Pct2 = rep(.5, 15),
  Pct3 = c(.33, .17, .87, .54, .37,
           .84, .72, .61, .48, .77,
           .21, .39, .60, .55, .81)
)

reactable(
  data,
  pagination = FALSE,
  defaultColDef = colDef(
    cell = data_bars(data,
                     text_position = "center", 
                     min_value = 0,
                     max_value = 1,
                     number_fmt = scales::percent)
  )
)

Thank you for this really cool package!

Suggestion: Add `icon_class` to `icon_asign()` and possibly other functions

Add icon_class as additional argument as suggested in the answer of this post:

icon_assign <- function (data, icon = "circle", fill_color = "#67a9cf", empty_color = "lightgrey",
                             fill_opacity = 1, empty_opacity = 1, align_icons = "left",
                             icon_size = 16, buckets = NULL, number_fmt = NULL, seq_by = 1,
                             show_values = "none", animation = "1s ease", icon_class = NULL)
{
  "%notin%" <- Negate("%in%")
  if (show_values %notin% c("left", "right", "above", "below",
                            "none") == TRUE) {
    stop("show_values must be either 'left', 'right', 'above', 'below', or 'none'")
  }
  if (align_icons %notin% c("left", "right", "center") == TRUE) {
    stop("align_icons must be either 'left', 'right', or 'center'")
  }
  if (!is.numeric(fill_opacity)) {
    stop("`fill_opacity` must be numeric")
  }
  if (fill_opacity < 0 | fill_opacity > 1) {
    stop("`fill_opacity` must be a value between 0 and 1")
  }
  if (!is.numeric(empty_opacity)) {
    stop("`empty_opacity` must be numeric")
  }
  if (empty_opacity < 0 | empty_opacity > 1) {
    stop("`empty_opacity` must be a value between 0 and 1")
  }
  fill_color <- grDevices::adjustcolor(fill_color, alpha.f = fill_opacity)
  empty_color <- grDevices::adjustcolor(empty_color, alpha.f = empty_opacity)
  icons <- function(empty = FALSE) {
    htmltools::tagAppendAttributes(shiny::icon(icon, class = icon_class), style = paste0("font-size:",
                                                                     icon_size, "px", "; color:", if (empty)
                                                                       empty_color
                                                                     else fill_color, sprintf("; transition: %s", animation)),
                                   `aria-hidden` = "true")
  }
  cell <- function(value, index, name) {
    if (!is.numeric(value))
      return(value)
    if (is.null(value) || is.na(value) || value == "NA" ||
        value == "na" || stringr::str_detect(value, " "))
      return("")
    if (!is.null(buckets) & !is.numeric(buckets)) {
      stop("must provide a number for buckets")
    }
    if (!is.null(buckets) & is.numeric(buckets)) {
      bucketed_data <- dplyr::ntile(data[[name]], n = buckets)
      bucket_value <- bucketed_data[index]
      value_rounded <- floor(bucket_value + 0.5)
      icon_seq <- lapply(seq_len(buckets), function(i) {
        if (i <= value_rounded)
          icons()
        else icons(empty = TRUE)
      })
      label <- sprintf("%s out of %s", bucket_value, buckets)
    }
    else {
      max_value <- max(floor(data[[name]] + 0.5), na.rm = TRUE)
      value_rounded <- floor(value + 0.5)
      if (max_value != 0) {
        icon_seq <- lapply(seq(1, max_value, by = seq_by),
                           function(i) {
                             if (i <= value_rounded)
                               icons()
                             else icons(empty = TRUE)
                           })
      }
      else {
        icon_seq <- lapply(seq(0, max_value, by = seq_by),
                           function(i) {
                             if (i < value_rounded)
                               icons()
                             else icons(empty = TRUE)
                           })
      }
      label <- sprintf("%s out of %s", value, max_value)
    }
    if (show_values == "right" & is.null(number_fmt)) {
      htmltools::div(title = label, `aria-label` = label,
                     role = "img", icon_seq, align = align_icons,
                     paste0("  ", value))
    }
    else if (show_values == "right" & !is.null(number_fmt)) {
      label <- number_fmt(value)
      htmltools::div(title = label, `aria-label` = label,
                     role = "img", icon_seq, align = align_icons,
                     paste0("  ", label))
    }
    else if (show_values == "left" & is.null(number_fmt)) {
      max_digits <- max(nchar(data[[name]])) + 1
      label <- stringr::str_pad(value, max_digits)
      htmltools::div(paste0(label, "  "), title = label,
                     `aria-label` = label, role = "img", icon_seq,
                     align = align_icons)
    }
    else if (show_values == "above" & is.null(number_fmt)) {
      max_digits <- max(nchar(data[[name]])) + 1
      label <- stringr::str_pad(value, max_digits)
      htmltools::tagList(htmltools::div(label, align = align_icons),
                         htmltools::div(title = label, `aria-label` = label,
                                        role = "img", icon_seq, align = align_icons))
    }
    else if (show_values == "above" & !is.null(number_fmt)) {
      label <- number_fmt(value)
      max_digits <- max(nchar(data[[name]])) + 1
      label <- stringr::str_pad(value, max_digits)
      htmltools::tagList(htmltools::div(title = label,
                                        `aria-label` = label, role = "img", icon_seq,
                                        align = align_icons), htmltools::div(label, align = align_icons))
    }
    else if (show_values == "below" & is.null(number_fmt)) {
      max_digits <- max(nchar(data[[name]])) + 1
      label <- stringr::str_pad(value, max_digits)
      htmltools::tagList(htmltools::div(title = label,
                                        `aria-label` = label, role = "img", icon_seq,
                                        align = align_icons), htmltools::div(label, align = align_icons))
    }
    else if (show_values == "below" & !is.null(number_fmt)) {
      label <- number_fmt(value)
      max_digits <- max(nchar(data[[name]])) + 1
      label <- stringr::str_pad(value, max_digits)
      htmltools::tagList(htmltools::div(label, align = align_icons),
                         htmltools::div(title = label, `aria-label` = label,
                                        role = "img", icon_seq, align = align_icons))
    }
    else if (show_values == "left" & !is.null(number_fmt)) {
      label <- number_fmt(value)
      max_digits <- max(nchar(data[[name]])) + 1
      label <- stringr::str_pad(label, max_digits)
      htmltools::div(paste0(label, "  "), title = label,
                     `aria-label` = label, role = "img", icon_seq,
                     align = align_icons)
    }
    else htmltools::div(title = label, `aria-label` = label,
                        role = "img", icon_seq, align = align_icons)
  }
}

Prettier alignment with data_bars_gradient, when values are of different text length

Hello,

When running:

data <- MASS::Cars93[20:49, c("Make", "MPG.city", "MPG.highway")]
data$MPG.city[1:3] <- data$MPG.city[1:3] + 10^(1:3) # Just lets add 10, 100 and 1000 to first 3 rows

reactable(data,
          columns = list(
              MPG.city = colDef(cell = data_bars_gradient(data))))

This results in table show below:
image

Unfortunately, when values in table are of different length, the bar starts from different position. Is there any way to make it more aesthetically pleasing?

icon_assign creates problem with RMarkdown report

I have an RMarkdown report that I've been running for a few months without any issue. Today, it started giving me this error message when I knitted it:
image

After investigating, I found that the problem was created by the icon_assign() function used in one of the tables.

I solved my problem, but I thought it might be useful to report it.

I can still run the code in R and the problem only arises when knitting. That said, the circle isn't filled any more:
image

image

Thanks for a great pacakge!

Sparklines: some [value] labels are hidden under top headline

Great PKG!!!.

Problem:
as you hover the mouse along some sparklines examples
in page:
https://kcuilla.github.io/reactablefmtr/articles/sparklines.html

...some MAX [value] labels become hidden
under the top headline:
"Species .... Sex..... Flipper_length"

At that point, you can not read the value...

EX:
https://kcuilla.github.io/reactablefmtr/articles/sparklines.html#htmlwidget-47f673e7c71ff2e55859

This "hidden value label" effect,
(as you move your mouse over the Sparkline),
happens on several examples in the Examples page.
Page Zooming in/out, does not help.

Try it!.
SFd99
San Francisco
Chrome / Chromium Version 95.0.4638.69 (Official Build)
Ubuntu LINUX 20.04

option to export table to excel incl. color coding of text

What would be very helpful is an option to export a table to excel. In my specific use case, I am trying to export a table which excludes text columns with some highlighted keywords. As far as I know, there is currently no way to get a table exported to excel and keep e.g. the color coding of specific words. I also couldn't find any workaround via the html export. Many thanks again.

issue getting centered pos-neg in data_bars

I'm having difficulty getting my charts to center on percentage data scaled between -1 and 1. The bars center desirably--that is, the 0 is in the center--when the percentage is negative, but not when positive. Here's some code for the an example with a column that's working and one that isn't; please keep in mind that the fault may be entirely mine. Thank you in advance for your attention and for this wonderful package!

Load libraries and create tabling function

`
library(dplyr)
library(scales)
library(reactable)
library(reactablefmtr)

pretty_table <-
function(df){

reactable(data = df,
      pagination = FALSE,
      sortable = TRUE,
      # filterable = TRUE,
      columns = list(Allot_BTD = colDef(format = colFormat(prefix = "$", separators = TRUE, digits = 0)),
                     
                     Actual_BTD = colDef(format = colFormat(prefix = "$", separators = TRUE, digits = 0)),
                     
                     Allot_BN = colDef(format = colFormat(prefix = "$", separators = TRUE, digits = 0)),
                     
                     Variance = colDef(cell = color_tiles(df,
                                                          color_ref = "BTD_colour",    
                                                          # color_by = "%BTD_Allot",
                                                             # colors = c(warning_colour, "#ffffff", danger_colour),
                                                             number_fmt = scales::label_dollar())),
        
                    `%BTD_Allot` = colDef(cell = data_bars(df,
                                                          fill_color_ref = "BTD_colour",
                                                          # min_value = -1,
                                                          # max_value = 1,
                                                          # fill_color = c(warning_colour, "#ffffff", danger_colour),
                                                          background = "darkgrey",
                                                          fill_opacity = 1.0,
                                                          text_position = "none",
                                                          align_bars = "left",
                                                          number_fmt = scales::percent,
                                                          tooltip = TRUE)),
                     `%BN_Allot` = colDef(cell = data_bars(df,
                                                          fill_color_ref = "BN_colour",
                                                          # min_value = -1,
                                                          # max_value = 1,
                                                          # fill_color = c(warning_colour, "#ffffff", danger_colour),
                                                          background = "darkgrey",
                                                          fill_opacity = 1.0,
                                                          text_position = "none",
                                                          align_bars = "left",
                                                          number_fmt = scales::percent,
                                                          tooltip = TRUE)),
                    BTD_colour = colDef(show = FALSE),
                    BN_colour = colDef(show = FALSE)
           ))

}

`

Here's dput() output piped into the pretty_table() function. The first bar chart doesn't work (positive value); the second does work (negative value)

structure(list(x = list(tag = structure(list(name = "Reactable", attribs = list(data = structure("{\"Org_Name\":[\"Activity Total\"],\"Allot_BTD\":[1140001],\"Actual_BTD\":[1383699],\"Variance\":[-243698],\"%BTD_Allot\":[0.213769987921063],\"Allot_BN\":[2272001],\"%BN_Allot\":[-0.390977820872438],\"BTD_colour\":[\"#e34234\"],\"BN_colour\":[\"#77b5fe\"]}", class = "json"), columns = list(list(accessor = "Org_Name", name = "Org_Name", type = "character"), list(accessor = "Allot_BTD", name = "Allot_BTD", type = "numeric", format = list( cell = structure(list(prefix = "$", digits = 0L, separators = TRUE), class = "colFormat"), aggregated = structure(list( prefix = "$", digits = 0L, separators = TRUE), class = "colFormat"))), list(accessor = "Actual_BTD", name = "Actual_BTD", type = "numeric", format = list(cell = structure(list( prefix = "$", digits = 0L, separators = TRUE), class = "colFormat"), aggregated = structure(list(prefix = "$", digits = 0L, separators = TRUE), class = "colFormat"))), list(accessor = "Variance", name = "Variance", type = "numeric", cell = list(structure(list(name = "div", attribs = list( style = list(background = "#E34234FF", color = "white", display = "flex", flexDirection = "column", justifyContent = "center", alignItems = "center", borderRadius = "6px", boxShadow = NULL, fontWeight = "normal", fontSize = NULL, transition = "background 1s ease")), children = list("-$243,698")), class = "shiny.tag"))), list(accessor = "%BTD_Allot", name = "%BTD_Allot", type = "numeric", cell = list(structure(list( name = "div", attribs = structure(list(), names = character(0)), children = list(structure(list(name = "div", attribs = list(style = list(flexGrow = 1, borderTopLeftRadius = "0px", borderBottomLeftRadius = "0px", borderTopRightRadius = "0px", borderBottomRightRadius = "0px", background = "darkgrey")), children = list( structure(list(name = "div", attribs = list( style = list(display = "flex", alignItems = "center")), children = list(structure(list(name = "div", attribs = list(style = list(textAlign = "right", boxShadow = NULL, borderTopLeftRadius = "0px", borderBottomLeftRadius = "0px", borderTopRightRadius = "0px", borderBottomRightRadius = "0px", border = " ", background = "#E34234FF", backgroundImage = NULL, width = "100%", height = 18, transition = "width 1s ease", display = "flex", alignItems = "center", justifyContent = "flex-end", color = "transparent")), children = list(structure(list(name = "WidgetContainer", attribs = list(key = "78954066e6f6fc4ade54a31ee6dfd548"), children = list(structure(list(name = "Fragment", attribs = list(), children = list( structure(list(name = "span", attribs = list(id = "htmlwidget-e654187755fd7ad0bc5c", width = 960, height = 500, className = "tippy html-widget"), children = list()), class = "shiny.tag"), structure(list(name = "script", attribs = list(type = "application/json", data-for= "htmlwidget-e654187755fd7ad0bc5c"), children = list(structure("{\"x\":{\"opts\":{\"animateFill\":false,\"followCursor\":true,\"content\":\"<span style=\\\"font-size:1.5em\\\">21%<\\/span>\"},\"text\":\"21%\"},\"evals\":[],\"jsHooks\":[]}", html = TRUE, class = c("html", "character")))), class = "shiny.tag"))), class = c("reactR_component", "shiny.tag"), html_dependencies = list( structure(list(name = "htmlwidgets", version = "1.5.4", src = list( file = "www"), meta = NULL, script = "htmlwidgets.js", stylesheet = NULL, head = NULL, attachment = NULL, package = "htmlwidgets", all_files = TRUE), class = "html_dependency"), structure(list(name = "tippyjs", version = "3.2.0", src = list( file = "htmlwidgets/lib/tippy"), meta = NULL, script = "tippy.all.min.js", stylesheet = c("themes/google.css", "themes/light-border.css", "themes/light.css", "themes/translucent.css"), head = NULL, attachment = NULL, package = "tippy", all_files = TRUE), class = "html_dependency"), structure(list(name = "tippy-binding", version = "0.1.0", src = list( file = "htmlwidgets"), meta = NULL, script = "tippy.js", stylesheet = NULL, head = NULL, attachment = NULL, package = "tippy", all_files = FALSE), class = "html_dependency"))))), class = c("reactR_component", "shiny.tag")))), class = "shiny.tag"))), class = "shiny.tag"))), class = "shiny.tag"))), class = "shiny.tag"))), list(accessor = "Allot_BN", name = "Allot_BN", type = "numeric", format = list(cell = structure(list(prefix = "$", digits = 0L, separators = TRUE), class = "colFormat"), aggregated = structure(list(prefix = "$", digits = 0L, separators = TRUE), class = "colFormat"))), list(accessor = "%BN_Allot", name = "%BN_Allot", type = "numeric", cell = list(structure(list( name = "div", attribs = list(style = list(display = "flex")), children = list(structure(list(name = "div", attribs = list(style = list(flex = "1 1 0")), children = list(structure(list(name = "div", attribs = list(style = list(position = "relative", width = "1px", height = "1000%", top = "-50px", backgroundColor = "#666666", float = "right")), children = list()), class = "shiny.tag"), structure(list(name = "div", attribs = list( style = list(flexGrow = 1, background = "transparent")), children = list(structure(list(name = "div", attribs = list(style = list(display = "flex", alignItems = "center", justifyContent = "flex-end")), children = list(structure(list(name = "div", attribs = list(style = list(boxShadow = NULL, borderTopLeftRadius = "0px", borderBottomLeftRadius = "0px", borderTopRightRadius = "0px", borderBottomRightRadius = "0px", textAlign = "left", background = "#77B5FEFF", backgroundImage = NULL, border = " ", color = "transparent", fontWeight = "normal", fontSize = NULL, width = "100%", height = 18, transition = "width 1s ease", display = "flex", alignItems = "center")), children = list(structure(list(name = "WidgetContainer", attribs = list(key = "d3a0510150205a34c50547e0f8f90992"), children = list(structure(list( name = "Fragment", attribs = list(), children = list(structure(list( name = "span", attribs = list( id = "htmlwidget-9226ce6af62def766d0b", width = 960, height = 500, className = "tippy html-widget"), children = list()), class = "shiny.tag"), structure(list(name = "script", attribs = list(type = "application/json", data-for = "htmlwidget-9226ce6af62def766d0b"), children = list(structure("{\"x\":{\"opts\":{\"animateFill\":false,\"followCursor\":true,\"content\":\"<span style=\\\"font-size:1.5em\\\">-39%<\\/span>\"},\"text\":\"-39%\"},\"evals\":[],\"jsHooks\":[]}", html = TRUE, class = c("html", "character")))), class = "shiny.tag"))), class = c("reactR_component", "shiny.tag"), html_dependencies = list( structure(list(name = "htmlwidgets", version = "1.5.4", src = list( file = "www"), meta = NULL, script = "htmlwidgets.js", stylesheet = NULL, head = NULL, attachment = NULL, package = "htmlwidgets", all_files = TRUE), class = "html_dependency"), structure(list(name = "tippyjs", version = "3.2.0", src = list( file = "htmlwidgets/lib/tippy"), meta = NULL, script = "tippy.all.min.js", stylesheet = c("themes/google.css", "themes/light-border.css", "themes/light.css", "themes/translucent.css" ), head = NULL, attachment = NULL, package = "tippy", all_files = TRUE), class = "html_dependency"), structure(list(name = "tippy-binding", version = "0.1.0", src = list( file = "htmlwidgets"), meta = NULL, script = "tippy.js", stylesheet = NULL, head = NULL, attachment = NULL, package = "tippy", all_files = FALSE), class = "html_dependency"))))), class = c("reactR_component", "shiny.tag")))), class = "shiny.tag"))), class = "shiny.tag"))), class = "shiny.tag"))), class = "shiny.tag"), structure(list(name = "div", attribs = list( style = list(flex = "1 1 0")), children = list()), class = "shiny.tag"))), class = "shiny.tag"))), list(accessor = "BTD_colour", name = "BTD_colour", type = "character", show = FALSE), list(accessor = "BN_colour", name = "BN_colour", type = "character", show = FALSE)), pagination = FALSE, defaultPageSize = 10, paginationType = "numbers", showPageInfo = TRUE, minRows = 1, dataKey = "9cf68dbd4e15b762a2900e767a292f48"), children = list()), class = c("reactR_component", "shiny.tag" )), class = "reactR_markup"), width = "auto", height = "auto", sizingPolicy = list(defaultWidth = NULL, defaultHeight = NULL, padding = NULL, viewer = list(defaultWidth = NULL, defaultHeight = NULL, padding = NULL, fill = TRUE, suppress = FALSE, paneHeight = NULL), browser = list(defaultWidth = NULL, defaultHeight = NULL, padding = NULL, fill = FALSE, external = FALSE), knitr = list(defaultWidth = NULL, defaultHeight = NULL, figure = FALSE)), dependencies = list(structure(list( name = "htmlwidgets", version = "1.5.4", src = list(file = "C:/Users/dche490/AppData/Local/R/win-library/4.2/htmlwidgets/www"), meta = NULL, script = "htmlwidgets.js", stylesheet = NULL, head = NULL, attachment = NULL, all_files = TRUE), class = "html_dependency"), structure(list(name = "tippyjs", version = "3.2.0", src = list( file = "C:/Users/dche490/AppData/Local/R/win-library/4.2/tippy/htmlwidgets/lib/tippy"), meta = NULL, script = "tippy.all.min.js", stylesheet = c("themes/google.css", "themes/light-border.css", "themes/light.css", "themes/translucent.css" ), head = NULL, attachment = NULL, all_files = TRUE), class = "html_dependency"), structure(list(name = "tippy-binding", version = "0.1.0", src = list(file = "C:/Users/dche490/AppData/Local/R/win-library/4.2/tippy/htmlwidgets"), meta = NULL, script = "tippy.js", stylesheet = NULL, head = NULL, attachment = NULL, all_files = FALSE), class = "html_dependency")), elementId = NULL, preRenderHook = NULL, jsHooks = list()), class = c("reactable", "htmlwidget"), package = "reactable") %>% pretty_table()
example
`

Consider using scales package?

This would allow you to pretty easily support many of the same scales that ggplot2 does. Happy to provide some pointers if it would help.

group_border_sort Empty table

Hi!

I've found a little problem with the group_border_sort function. If the table is sorted and you search for a text that doesn't exist, it removes all the UI from the table.

Here is a little reprex showing the error:

packageVersion("reactable")
#> [1] '0.3.0.9000'
packageVersion("reactablefmtr")
#> [1] '2.0.0'
reactable::reactable(data = iris, searchable = TRUE, defaultSorted = "Species", 
    rowStyle = reactablefmtr::group_border_sort("Species"))

Created on 2022-12-07 with reprex v2.0.2

Center icon using icon_assign

Is it possible to center icons within a column using icon_assign? I can achieve something similar with icon_position("above") using icon_sets, but all icons automatically align to the left with icon_assign. Thanks.

data_bars error if NA is in the column data

Thanks very much for this excellent r package. The following error occurs when adding data_bars to a column definition with data containing an NA.

Error in if (stats::var(data[[name]]) == 0) { :
missing value where TRUE/FALSE needed

Example code:

data <- data.frame(
  Group = c("Red Group 1","Red Group 2","Red Group 3","Red Group 4","Red Group 5",
            "Blue Group 1","Blue Group 2","Blue Group 3","Blue Group 4","Blue Group 5",
            "Green Group 1","Green Group 2","Green Group 3","Green Group 4","Green Group 5"),
  Pct1 = c(.27, .82, .44, .68, .78, 
           .74, .66, .33, .23, .20, 
           .50, .55, .40, .70, .60),
  Pct2 = c(.33, .17, .87, .54, .37,
           .84, .72, .61, .48, .77,
           .21, .39, .60, .55, .81)
)

reactable(
  data,
  pagination = FALSE,
  defaultColDef = colDef(
    cell = data_bars(data, 
                     number_fmt = scales::percent)
  )
)

Could this be fixed by adding an na.rm=TRUE to the if statement just like in the min/max formulas with the else clause of the same if statement:

if (stats::var(data[[name]]) == 0, na.rm=TRUE) {
normalized <- 1
}
else {
normalized <- (value - min(data[[name]], na.rm = TRUE))/(max(data[[name]],
na.rm = TRUE) - min(data[[name]], na.rm = TRUE))
}

I'd prefer to show a blank cell for NA data in a data_bars column similar to other colDef types.

Thanks again!

issue with font-size in add_title

First, many thanks for this great package.

I am encountering an issue when trying to specify the font-size of the table's title, subtitle, and source. Regardless of which font-size I define, the heading’s size doesn’t change.

I assume, there is a conflict between the font-size specified via the reactablefrmtr package and the css of the blog, in my case a distill blog. (My css knowledge is rather limited).

I gather from your own (very nice) distill blog, that it is possible to use reactablefrmtr with distill posts, but I am not clear where the conflict actually does arise. Is there a way to enforce e.g. font-size defined via the reactablefrmtr package?

Here a link to a post which demonstrates the problem.
Here the link to my theme.css of the distill-blog.

Many thanks!

Domain of color_scales?

Really enjoying reactablefmtr! Quick question: I am trying to apply color scales to a few columns in my table, but I need to specify the minimum and maximum range of values, instead of the minimum and maximum of whats in the table. In D3/gtExtras parlance, this is called the 'domain', e.g. gtExtras::gt_color_rows(..., domain = c(0, 1)). Is there an analogous argument in reactablefmtr? How would I do this?

Option to Export Code for use in a Handcrafted Web Page/ Site

Hi Kyle,

reactable and reactablefmtr are great.

I need to include a table I've built using them via R in a webpages that have not been created in R via an RMD etc.

Ideally, i'd like to apply the javascript and CSS to a Div with an ID that is on one of those pages.

I've been looking at the generated code and suspect I could do this, but probably with a degree of copying out the relevant bits. I can see that it already creates the Div with the supplied ID and applies the table to it. So I'm some way there already.

I'm just trying to see if I can extract what I need (javascript and CSS?) relatively straightforwardly.

Thanks,

Chris.

Example with data_bars not working

Fyi - The example from the package's site here isn't working. The bars/text are not visible.

library(tidyverse)
library(reactable)
library(reactablefmtr)
#> 
#> Attaching package: 'reactablefmtr'
#> The following object is masked from 'package:ggplot2':
#> 
#>     margin

car_data <- MASS::Cars93 %>% 
  filter(Type %in% c('Compact', 'Sporty', 'Van')) %>% 
  select(c('Make', 'Type', 'MPG.city')) %>% 
  mutate(Make = as.character(Make)) %>% 
  tail(10)

reactable(
  car_data,
  defaultSorted = "MPG.city",
  defaultSortOrder = "desc",
  columns = list(
    Make = colDef(
      cell = data_bars(car_data, fill_by = "MPG.city", text_position = "above")
    )
  )
)

packageVersion("reactable")
#> [1] '0.4.1'
packageVersion("reactablefmtr")
#> [1] '2.1.0'

Created on 2022-12-10 with reprex v2.0.2

`icon_sets()` not recognizing certain icons

The guide did not specify that some icons are unavailable and why. I get repeatable errors for icons like "island-tropical", "face-thermometer", "face-mask".

library(tidyverse)
library(reactable)
library(reactablefmtr)

car_data <- MASS::Cars93 %>%
  filter(Type %in% c("Compact", "Sporty", "Van")) %>%
  select(c("Make", "Type", "MPG.city", "MPG.highway")) %>%
  head(10)

reactable(
  car_data,
  defaultColDef = colDef(
    align = "center",
    cell = icon_sets(car_data, icon_size = 28, icons = "face-mask", colors = c("red", "grey", "darkgreen"))
  )
)
#> The `name` provided ('face-mask') does not correspond to a known icon
#> [repeats above message for number of rows in data]

save_reactable() / save_reactable_test()

Hi
Thanks @kcuilla for this fantastic package!

Just browsing the new version and saw the ability to save the tables with save_reactable.
In most places, the documentation refers to save_reactable, but when I went to call the function, it is currently named save_reactable_test()

icon_assign for the column with NA values output "NA" text in a given cell

First of all, thanks a lot for the development of reactablefmtr package!

When I produce a reactable table and use icon_assign for column which contains NA values, it produces output "NA" in a given cell. I tried to look at the documentation but didn't find any parameter that would regulate this behaviour. I tried to experiment with some !is.na(data) inside the icon_assign, or ifelse(!is.na(data), cell = icon_assign(data, icon = "user")) - but without success.
Please could you let me know how it is possible to suppress "NA" output for the cells reflecting NA values?

Here is a RE:

data <- MASS::Cars93[1:20, c("Make", "Passengers")]
data[2, 2] <- NA

reactable(
  data,
  defaultColDef = colDef(maxWidth = 300, align = "center", na = "",
                         cell = icon_assign(data, icon = "user")
  )
)

Recommend Projects

  • React photo React

    A declarative, efficient, and flexible JavaScript library for building user interfaces.

  • Vue.js photo Vue.js

    🖖 Vue.js is a progressive, incrementally-adoptable JavaScript framework for building UI on the web.

  • Typescript photo Typescript

    TypeScript is a superset of JavaScript that compiles to clean JavaScript output.

  • TensorFlow photo TensorFlow

    An Open Source Machine Learning Framework for Everyone

  • Django photo Django

    The Web framework for perfectionists with deadlines.

  • D3 photo D3

    Bring data to life with SVG, Canvas and HTML. 📊📈🎉

Recommend Topics

  • javascript

    JavaScript (JS) is a lightweight interpreted programming language with first-class functions.

  • web

    Some thing interesting about web. New door for the world.

  • server

    A server is a program made to process requests and deliver data to clients.

  • Machine learning

    Machine learning is a way of modeling and interpreting data that allows a piece of software to respond intelligently.

  • Game

    Some thing interesting about game, make everyone happy.

Recommend Org

  • Facebook photo Facebook

    We are working to build community through open source technology. NB: members must have two-factor auth.

  • Microsoft photo Microsoft

    Open source projects and samples from Microsoft.

  • Google photo Google

    Google ❤️ Open Source for everyone.

  • D3 photo D3

    Data-Driven Documents codes.