Giter VIP home page Giter VIP logo

klinecharts / klinechart Goto Github PK

View Code? Open in Web Editor NEW
2.1K 36.0 504.0 42.59 MB

📈Lightweight k-line chart that can be highly customized. Zero dependencies. Support mobile.(可高度自定义的轻量级k线图,无第三方依赖,支持移动端)

Home Page: https://klinecharts.com/

License: Apache License 2.0

JavaScript 16.31% HTML 7.96% CSS 0.08% Shell 0.01% TypeScript 75.64%
kline time-line candlestick canvas stock chart exchange finance klinechart stockchart

klinechart's Introduction

KLineChart

English | 简体中文

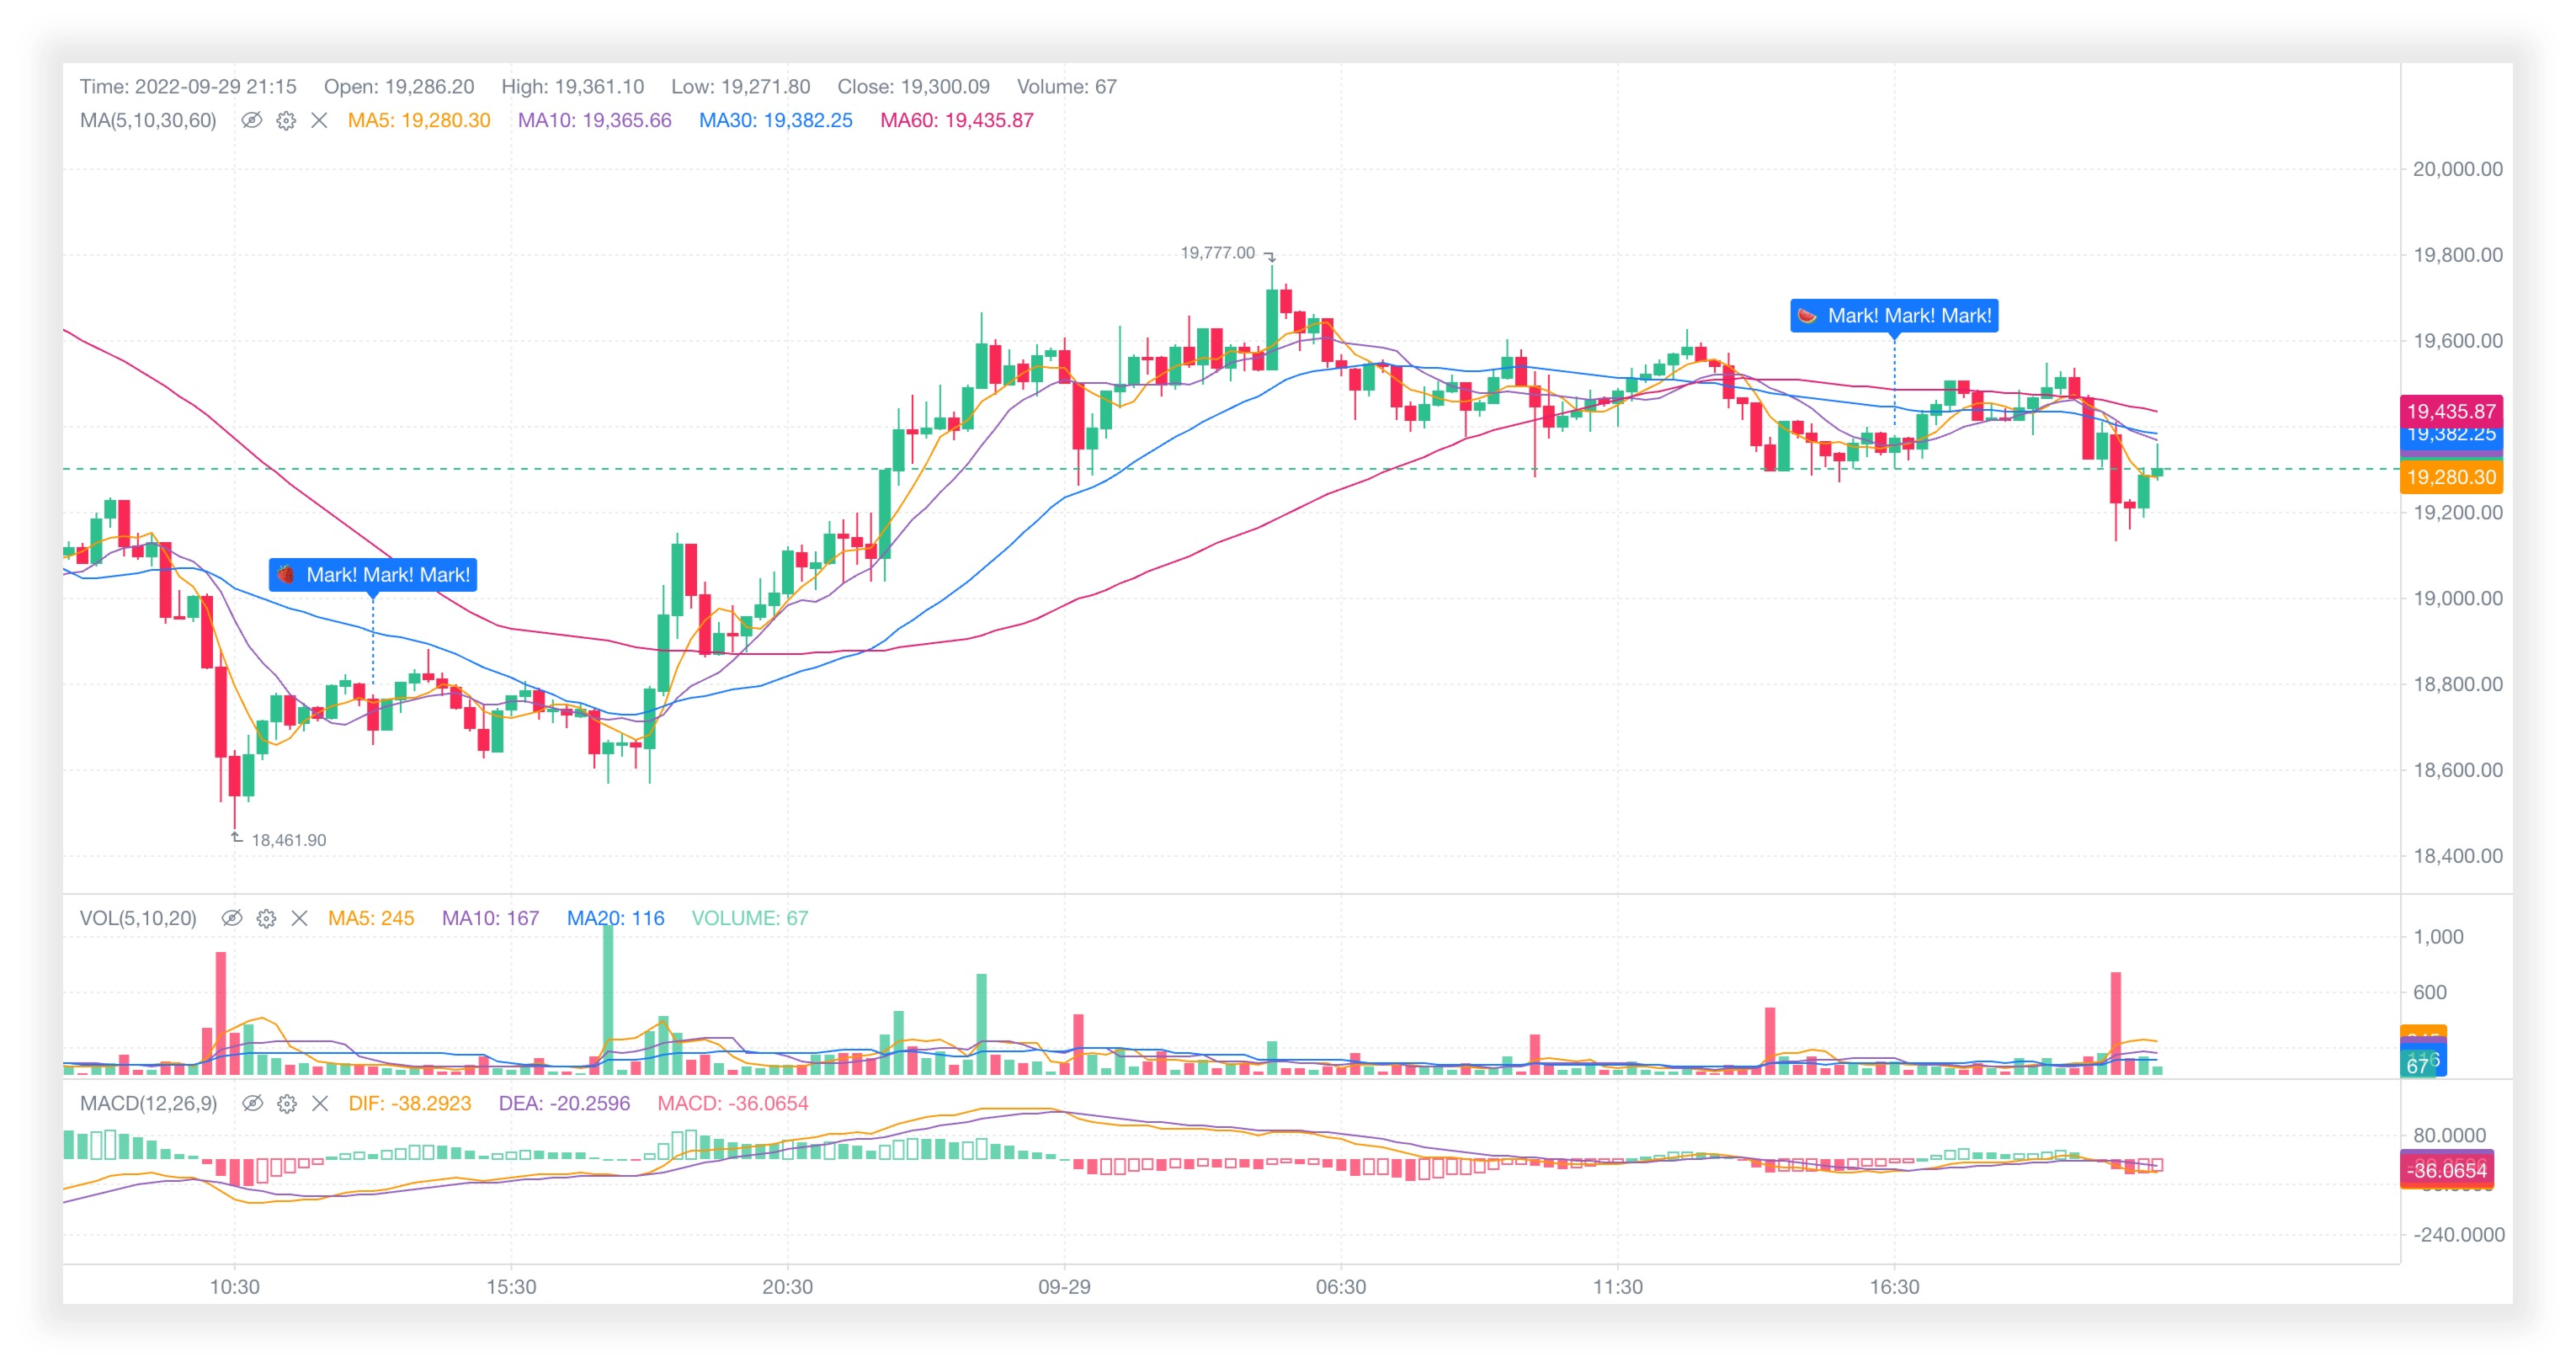
💹📈 Lightweight k-line chart built with html5 canvas.

GitHub Workflow Status (with branch) Version Size npms.io (maintenance) Typescript LICENSE Docs

Github Issues Github Discussions Telegram Discord Wechat

✨ Features

  • 📦 Out of the box: Simple and fast integration, basically zero cost to get started.
  • 🚀 Lightweight and smooth: Zero dependencies, only 40k under gzip compression.
  • 💪 Powerful functions: Built-in multiple indicators and line drawing models.
  • 🎨 Highly scalable: With rich style configuration and API, the function can be extended as you like.
  • 📱 Mobile: Support mobile, one chart, handle multiple terminals.
  • 🛡 Typescript development: Provide complete type definition files.

⚡ Performance

Similar to chart libraries for performance comparison.

  • Test Scenario: 50000 pieces of data, 5 pane indicators, average 10 runs
  • Device: macOS Ventura, Apple M2 Pro, 16G
  • Browser: Chrome 114.0.5735.106
  • Framework: [email protected]

Comparison of time consumption from initialization to full rendering:

[email protected] [email protected] [email protected]
37ms 36ms 241ms

📦 Install

Using npm

npm install klinecharts --save

Using yarn

yarn add klinecharts

CDNs

<script type="text/javascript" src="https://unpkg.com/klinecharts/dist/klinecharts.min.js"></script>
<script type="text/javascript" src="https://cdn.jsdelivr.net/npm/klinecharts/dist/klinecharts.min.js"></script>

📄 Docs

Online

https://www.klinecharts.com

Locale

Execute command in root directory. Node.js is required.

# Install the dependencies
npm install

# Start document service
npm run docs:dev

After successful startup, open in the browser http://localhost:8888 .

🛠️ Build

Execute command in root directory. Node.js is required.

# Install the dependencies
npm install

# Build files
npm run build

The generated files are in the dist folder.

🔗 Links

©️ License

KLineChart is available under the Apache License V2.

klinechart's People

Contributors

86maid avatar 90arther avatar aduryagin avatar aversoncoder avatar cryptotooltop avatar flameonyou avatar hz86 avatar julien-r44 avatar kurogeek avatar liihuu avatar mationai avatar mawsyh avatar oneart-dev avatar sudoshu avatar winstonya avatar wssll789 avatar xyuu avatar

Stargazers

 avatar  avatar  avatar  avatar  avatar  avatar  avatar  avatar  avatar  avatar  avatar  avatar  avatar  avatar  avatar  avatar  avatar  avatar  avatar  avatar  avatar  avatar  avatar  avatar  avatar  avatar  avatar  avatar  avatar  avatar  avatar  avatar  avatar  avatar  avatar  avatar  avatar  avatar  avatar  avatar  avatar  avatar  avatar  avatar  avatar  avatar  avatar  avatar  avatar  avatar  avatar  avatar  avatar  avatar  avatar  avatar  avatar  avatar  avatar  avatar  avatar  avatar  avatar  avatar  avatar  avatar  avatar  avatar  avatar  avatar  avatar  avatar  avatar  avatar  avatar  avatar  avatar  avatar  avatar  avatar  avatar  avatar  avatar  avatar  avatar  avatar  avatar  avatar  avatar  avatar  avatar  avatar  avatar  avatar  avatar  avatar  avatar  avatar  avatar  avatar

Watchers

 avatar  avatar  avatar  avatar  avatar  avatar  avatar  avatar  avatar  avatar  avatar  avatar  avatar  avatar  avatar  avatar  avatar  avatar  avatar  avatar  avatar  avatar  avatar  avatar  avatar  avatar  avatar  avatar  avatar  avatar  avatar  avatar  avatar  avatar  avatar  avatar

klinechart's Issues

Minus value on Crosshair Coordinate Y of Volume Technical Indicator

Why is there a minus value on Crosshair Coordinate Y of Volume Technical Indicator?

Screen Shot 2020-12-10 at 13 42 27

I added a custom technical indicator for volume.

kLineChart.addCustomTechnicalIndicator({
    name: "VOL",
    series: "volume",
    shouldFormatBigNumber: true,
    plots: [{
        key: "volume",
        type: "bar",
        color: function(data, options) {
            const kLineData = data.currentData.kLineData || {}
            if (kLineData.close < kLineData.open) {
                return options.bar.downColor
            }
            return options.bar.upColor
        }
    }],
    calcTechnicalIndicator: function(dataList) {
        return dataList.map((kLineData) => {
            return {
                volume: kLineData.volume
            }
        })
    },
    precision: 4
})

High/Low not showing properly

set setOffsetRightSpace(10) and setDataSpace(7), then if rightmost bar has the lowest/highest price then appears as below
₮9539_5_TBTC_USDT

手机QQ浏览器不兼容

this.chart = init(document.querySelector('#container_id'))

初始化的时候出错,其他浏览器没有这个问题,只有手机QQ浏览器

VBQJU$0%I`P}9{RO 4OPSLW

Snipaste_2020-06-05_18-19-52

标记位置的稳定性

这应该是一个bug。
研究了下代码,发现作者的Mark标记是根据 xPos 和 price 来定位的,这也意味着,当K线周期切换后(比如5分钟切到4小时 ), xPos标记就错位失效了。
观察了作者的demo展示,确实存在这么个问题。

安卓下手机qq浏览器会报错,无法运行给出的例子

手机:小米mix2
系统: androd 9
浏览器:手机qq浏览器最新版本
运行库:此项目demo

以下是运行给出例子的bug
221593658067_ pic

又分别试了安卓下的其他机型上的手机qq浏览器发现皆会出现此状况,ios下的手机qq浏览器则不会出现此问题

Show current price horizontal line

Hi,

Do current price with the horizontal line supported please ?

If not, do you have a plan for it ?!

I really like your chart, easy to use and manipulate !

Thanks

Example code as documentation

Hi @liihuu ,

could you provide an uncompressed version of your code from the example you created? This would be very helpful as long as there is no documentation.

Currently I'am struggling with the integration and a code example would help a lot.

这个项目太棒了

样式太漂亮了,楼主加油维护下去。19年的时候就想找这样的项目,当时只有tradingview的付费方案就放弃了。最近发现一个网站的k线做的很强大很漂亮,可以参考下呀btcusd

我发现了一个IE11上的bug

hi,
我在IE11上遇到一个bug。使用IE11绘图时控制台报错:‘TypeError: 对象不支持“append”属性或方法’
当我在本地修改development.js 中dom.append => dom.appedChild 之后不报错,但不显示指标。

Price Value too Low ?

image
This is the STORM/BTC chart from Binance,
i have set the precision of the chart to 12 but the price scale wont adjust and will always stay on the Range 0,1
Are the Price Values too low?

image

This is how it looks on the Binance website

Thanks for this Great project

精度引起最大最小值计算错误,导致k先幅度显示异常

在datasocurce值小于预设的小数点后6位时,会引起k线幅度显示异常的问题。

现象:

image

建议将指标精度作为优先值,6作为缺省值

/**
   * 计算最大最小值
   * @param technicalIndicator
   * @param isRealTime
   */
  calcMinMaxValue (technicalIndicator, isRealTime) {
    const dataList = this._chartData.dataList()
    const precision = technicalIndicator.precision || 6
    const technicalIndicatorResult = technicalIndicator.result
    } else {
        this._minValue = minMaxArray[0]
        this._maxValue = minMaxArray[1]
        if (
          this._minValue === this._maxValue ||
          Math.abs(this._minValue - this._maxValue) < Math.pow(10, -1 * precision)
        ) {
          const percentValue = this._minValue !== 0 ? Math.abs(this._minValue * 0.2) : 10
          this._minValue = this._minValue !== 0 ? this._minValue - percentValue : this._minValue
          this._maxValue += percentValue
        }
      }
    } else {
      this._minValue = 0
      this._maxValue = 10
    }
  }

y轴tickText显示不全

现象: y轴tickText在精度非常小时显示不全

image

_measureYAxisWidth () {
    console.log(this)
    const yAxis = this._chartData.styleOptions().yAxis
    const pricePrecision = this._chartData._pricePrecision || 6;
    const axisLine = yAxis.axisLine
    const tickText = yAxis.tickText
    const tickLine = yAxis.tickLine
    let width = 0
    if (yAxis.display) {
      if (yAxis.axisLine.display) {
        width += axisLine.size
      }
      if (yAxis.tickLine.display) {
        width += tickLine.length
      }
      if (yAxis.tickText.display) {
        width += (tickText.margin + (tickText.size - 2) * pricePrecision)
      }
    }
    if (width > 0) {
      width = Math.ceil(Math.max(yAxis.minWidth, Math.min(width, yAxis.maxWidth)))
    }
    return width
  }

在累加宽度时应该更具精度来计算对应tickText 的宽度

[bug] You have to click twice to display crossHair... ̄□ ̄||

Nobody want to display crossHair by clicking double . 🙇

https://github.com/liihuu/KLineChart/blob/a5f56cb65b245d22d6862a885fb4c1271771cce8/src/event/ZoomScrollEventHandler.js#L107-L114

It should be:

if (radius < 10) {
	this._touchPoint = { x: event.localX, y: event.localY };
	this._chartData.setCrossHairPointPaneTag(crossHairPoint, cross.tag);
} else if(JSON.stringify(_this4._touchPoint)==="{}"){
	this._chartData.setCrossHairPointPaneTag(crossHairPoint, cross.tag);
	this._touchPoint = null;
}else {
	this._touchCancelCrossHair = true;
	this._touchPoint = null;
	this._chartData.setCrossHairPointPaneTag(null, null);
}

仍然是图层位置的不确定性

感谢作者,又做了大量的更新。

但,把datalist的索引值用作xPos,问题真的有点大。

譬如:
需要将图层绘制数据存入数据库,当数据取出套用时,若datalist长度发生了变化,这不就等同于刻舟求剑了吗,实际上随着时间的变化datalist的长度一直在变化。
纵轴的判断值为price,为什么横轴的判断值就设为了datalist的索引值了呢,因为它不是确定值,不知道作者是基于什么考虑,有些想不明白。
这个问题的存在,意味着,这个K线图只是好看,实用性一般。因为没办法针对数据去做分析处理,然后在K线图中直接表现,而是要把数据植入到图表中再取中,跟据不稳定的datalist索引值去做分析计算,然后再次进行图形绘制。

当然,整年项目的零依赖真的很赞,感谢作者的实现。

Set timeline

Hello,

How can i set timeline like 1m, 12h, 1d, 1w etc.

Recommend Projects

  • React photo React

    A declarative, efficient, and flexible JavaScript library for building user interfaces.

  • Vue.js photo Vue.js

    🖖 Vue.js is a progressive, incrementally-adoptable JavaScript framework for building UI on the web.

  • Typescript photo Typescript

    TypeScript is a superset of JavaScript that compiles to clean JavaScript output.

  • TensorFlow photo TensorFlow

    An Open Source Machine Learning Framework for Everyone

  • Django photo Django

    The Web framework for perfectionists with deadlines.

  • D3 photo D3

    Bring data to life with SVG, Canvas and HTML. 📊📈🎉

Recommend Topics

  • javascript

    JavaScript (JS) is a lightweight interpreted programming language with first-class functions.

  • web

    Some thing interesting about web. New door for the world.

  • server

    A server is a program made to process requests and deliver data to clients.

  • Machine learning

    Machine learning is a way of modeling and interpreting data that allows a piece of software to respond intelligently.

  • Game

    Some thing interesting about game, make everyone happy.

Recommend Org

  • Facebook photo Facebook

    We are working to build community through open source technology. NB: members must have two-factor auth.

  • Microsoft photo Microsoft

    Open source projects and samples from Microsoft.

  • Google photo Google

    Google ❤️ Open Source for everyone.

  • D3 photo D3

    Data-Driven Documents codes.