Giter VIP home page Giter VIP logo

kse-ua / kse-loc-data-hub Goto Github PK

View Code? Open in Web Editor NEW
10.0 10.0 4.0 441.36 MB

Building a Comprehensive Repository of Hromada-Level Data in Ukraine to Facilitate Research and Informed Policy Decisions. This repository supports the collection and accessibility of critical data at the hromada level in Ukraine for research and policy development.

Home Page: https://kse.ua/kse-impact/center-for-sociological-research-decentralization-and-regional-development/

License: MIT License

R 7.07% HTML 92.91% TeX 0.02%
data-sources decentralization-reform hromada-level-data materials-and-resources resilience ukrainian-communities

kse-loc-data-hub's People

Contributors

andkov avatar ipiddubnyi avatar izasimovych avatar kpetrynka avatar splanetina avatar tytser avatar velgaks avatar

Stargazers

 avatar  avatar  avatar  avatar  avatar  avatar  avatar  avatar  avatar  avatar

Watchers

 avatar  avatar  avatar

kse-loc-data-hub's Issues

Data audit

  1. Check data that we have already gathered at the first stage from this spreadsheet.
  2. Look for data for potential measurements that mentioned in this spreadsheet for 2015, 2019, 2021, 2022 years .
  3. Make a table describing the data already available and those that should be collected. Proposed measurements: short description, who made this data, source, columns description, timeframe, unit of observation, link to data on disk, etc.

Add rada to the mapping of administrative levels

Modify the script ./manipulation/ellis-ua-admin.R so that its product ./data-private/derived/ua-admin-map.rds includes rada as one of the levels of administrative units.
Specifically, create columns rada_code and rada_name in the object ds_admin

image

@Tytser , you will need to procure the data table where settlements are mapped onto radas, but if I remember correctly from the last time we spoke you have it handy somewhere.

Oblast arrangement on 5x5 facet_wrap grid

Objective

Design the following frequency distribution graph :

X - number of radas in hromada's composition
Y - number of hromadas (frequency of occurce of hromadas with this number of radas)
Facet_wrap - oblast, free Y scaling, fixed X scaling
Color/FIll - region (e.g. West, East)

The oblasts arranged on 5 x 5 grid in integer sequence starting with 1 in the top left and increasing by 1 from letf to right, continuing each row with the leftmost cell. The order is controlled via column map_position in Kodificator tab oblasti and assigned as factor levels before passing to ggplot()

Notes

  1. Develop ./analysis/regions-and-distributions/regions-and-distributions.R (which is an exact copy of ./scripts/templates/report-isolated.R) to host the script for producing this graph in chunk graph-1
  2. Please work in ./analysis/regions-and-distribution/regions-and-distribution-yourname.R scripts on the main branch. I will be pulling consolidated solutions into the main script ./analysis/regions-and-distributions/regions-and-distributions.R
  3. Do not commit graphs.

Looking forward

Prepare to develop this graph in a graphing function which would work with both discrete values on the X-scale (e.g. counts of radas) and continuous values (e.g. tax revenue)

Modifications

  • add median lines for oblast, region, and country
  • print total number of hromadas in the top right corner of the cell
  • create display label for the facet that includes region name
  • connect Rmd to R and kick-off a dynamic report

Exploratory Exercise 01 - Composition Codes

Glance ahead at the solution

For a given data set ds, defined as

ds_in <- 
  tibble::tribble(
  ~id, ~codes_1, ~date_1, ~codes_2, ~date_2,
  1, "22"   , "2015-01-01", "22,33"   , "2021-01-01",
  2, "44,55", "2015-01-01", "44,55,66", "2021-01-01",
  3, "77,88", "2015-01-01", "77,99"   , "2021-01-01",
  4, "100"  , "2015-01-01", "100"     , "2021-01-01",
 )

where id identifies hromadas (ATC) and codes_* contain the list of radas that comprise the hromada at that time (date_*)

> ds_in
# A tibble: 4 x 5
     id codes_1 date_1     codes_2  date_2    
  <dbl> <chr>   <chr>      <chr>    <chr>     
1     1 22      2015-01-01 22,33    2021-01-01
2     2 44,55   2015-01-01 44,55,66 2021-01-01
3     3 77,88   2015-01-01 77,99    2021-01-01
4     4 100     2015-01-01 100      2021-01-01

please develop a solution that would transform the data into the following form:

> ds_out
# A tibble: 14 x 3
      id date        code
   <dbl> <chr>      <dbl>
 1     1 2015-01-01    22
 2     1 2021-01-01    22
 3     1 2021-01-01    33
 4     2 2015-01-01    44
 5     2 2015-01-01    55
 6     2 2021-01-01    44
 7     2 2021-01-01    55
 8     2 2021-01-01    66
 9     3 2015-01-01    77
10     3 2015-01-01    88
11     3 2021-01-01    77
12     3 2021-01-01    99
13     4 2015-01-01   100
14     4 2021-01-01   100

Notes & Thoughts

  1. Let's try to stay in the tidyverse, if possible.
  2. I think purrr package might be useful here, but not sure
  3. Use pivot_longer for wide-to-long transformation

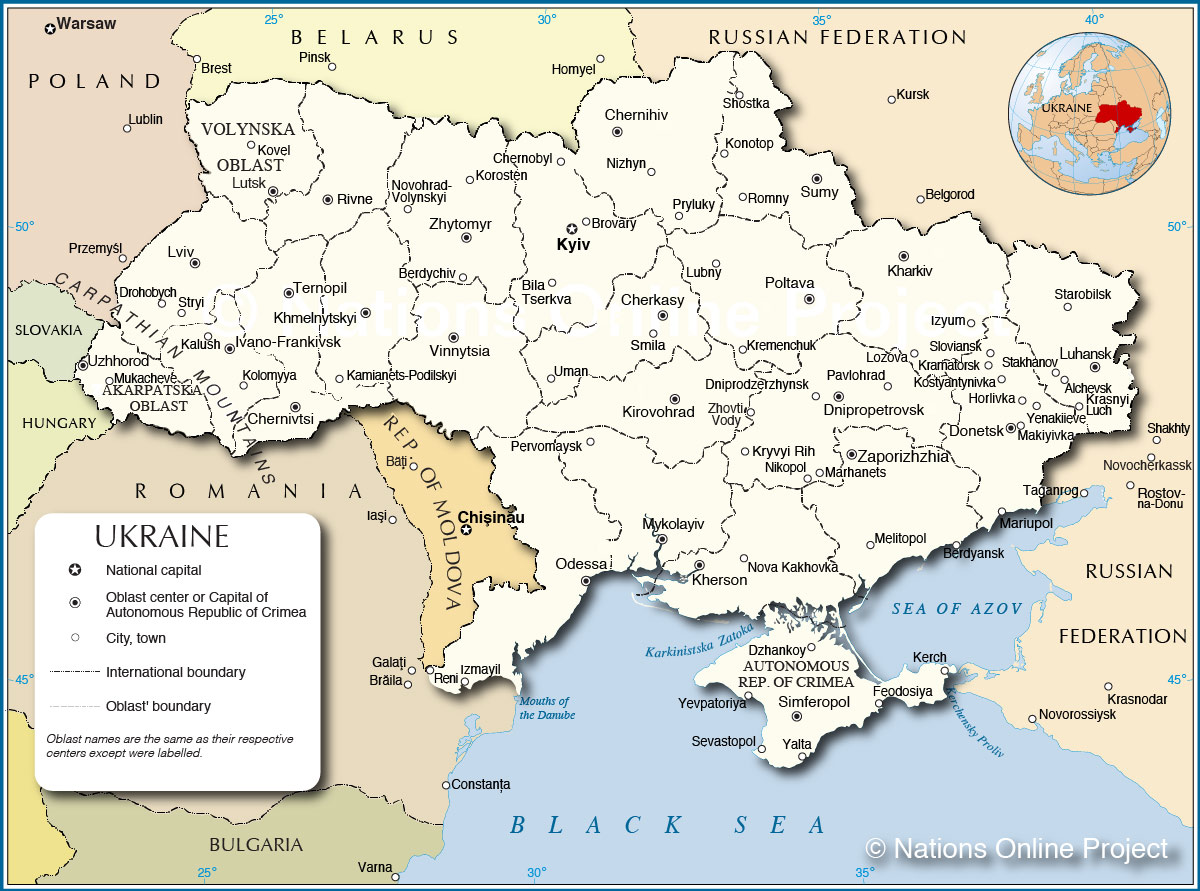
Administrative map of Ukraine

Compose a collection of data tables and programming scripts to represent the hierarchy of administrative levels of Ukraine.

Objectives

  • describe relationship among oblast (24+1+2), raion (140), hormada (1,470), and rada (11,250)
  • create relational database to accommodate accumulating measures in the future (research center)
  • organize shape files for each unit of each level (working map)
  • Latinize the names of relevant administrative nomenclature

Regions of Ukraine

@izasimovych could you please help me group oblasts into 5–6 larger regions? E.g. west, center, northeast, east, south, crimea. Or some thing that makes more sense to you in the context of our analysis.

Exploratory Exercise 02 - Compare source of radas

Problem

Please see "./analysis/task/02-compare-rada-sources" for detailed description of the problem and fuller data context.

# We have two data files mapping radas to hromadas
# The first dataset we called  `rada_local` comes from the file
# "Центр суспільних даних. Місцеві ради 2014"  https://docs.google.com/spreadsheets/d/1iEbUsZSDGbJUzl_6wC3vgoVJ7GzOlc9f/edit?usp=sharing&ouid=106674411047619625756&rtpof=true&sd=trueентр суспільних даних. Місцеві ради 2014
rada_local
#  this data set stores information on N = _______ radas
rada_local %>% pull(rada_code) %>% unique() %>% length() %>% scales::comma()

#  the SECOND dataset we called `rada_united` comes from the file
# Центр суспільних даних. Обєдання громад - https://docs.google.com/spreadsheets/d/1xAFUDx8nf2oaIezWSBLaqitdxwEiQaOw/edit?usp=sharing&ouid=106674411047619625756&rtpof=true&sd=true
rada_united
# the list of radas in this file counts N = ________ radas
rada_united %>% pull(rada_code) %>% unique() %>% length() %>% scales::comma()
# this file records what radas makes up hromadas at the end of the amalgamation (2021)
# TODO:
# Explore the discrepancy between these two files
# Using the labels in the dataset `ds_admin`,  describe what radas/hromadas are
# missing from each file and speculate/expolain why. 

# Answer the following question:
# If we disregard the "Local" source and use only rada_united, will we miss anything relevant to our project? 
# In other words, if we need to rely on the mapping between radas and hromadas,
# are we safe to use the mapping derived from the "United" source? ( I think yes,
# but we need the proof)

# Notes:
# 1. Occupied territories is the most likely culprit, but there might be something else 
# 2. The report should compile into an html document
# 3. Please use the "main" branch, but create a separate script with your solution
# and call it "./analysis/tasks/02-compare-rada-sources-yourname.R"

Create descriptive labels for economic metrics

@izasimovych , please follow the pattern for populating vector metric_name_label on line 40 of ./manipulation/ellis-economics.R to create descriptive labels for economic measured of hromadas stored in
App 3. Показники фінансвої спроможності тергромад 1 кв 2022 (в ІАС)

image

Notes:

  • Try to keep it as short as possible. Ideally we don't want to be longer that 50-70 characters. The shorter the better.
  • Please use the main branch and the same file to contribute, but DO NOT commit any other lines outside of the specified in this issue.

Exploratory Exercise 03 - Graph temporal composition of hromadas

  • 1. Застосувати алгоритм перетворення з тестових даних до даних датасету громад (привести до вигляду "id-date-code")
  • 2. Створіть графік зміни кількості рад в громадах з 2015 по 2020
  • 3. Створіть скрипт у ./analysis/temporal-composition/tc.R у якому буде створений цей графік, використовуючи дані, створені ./manipulation/1-ellis.R

Error in ellis-demography

When replicating, the script ./manipulate/ellis-demography.R generates the following error, seemingly from cause by line 132:

Error in `mutate()`:
! Problem while computing `hromada_name = str_replace(hromada_name, "i", "і")`.
Caused by error in `stri_replace_first_regex()`:
! object 'hromada_name' not found
Run `rlang::last_error()` to see where the error occurred.

Exploration of the economics data

Task

Develop a series of graphs that describe the available data assets that deal with economic indicators. Specifically, work with the product of the ./manipulation/ellis-economics.R (which digests App 3. Показники фінансвої спроможності тергромад 1 кв 2022 (в ІАС ) We don't know yet what those graphs will look like, but we want to:

  • look at univariate distribution of each indicator
  • look at bivariate distributions among indicators
  • look at how indicators change with time
  • how oblasts and regions vary among each other

Notes:

  1. Use ./analysis/economic-outcomes/economic-outcomes.R as the starting point.
  2. Store work in ./analysis/economic-outcomes/economic-outcomes-yourname.R script, I will integrate successful compositions in the main script ./analysis/economic-outcomes/economic-outcomes.R .
  3. Do not commit graphs
  4. See this commit for an example.
  5. Contain each graph in a dedicated chunk (e.g. graph-2)

Clarify the behavior of Cyrillic characters

When performing string manipulations on Ukrainian characters, it sometimes does not recognize and/or transforms the matched characters:

Sys.setlocale("LC_CTYPE", "russian")
Sys.setlocale("LC_CTYPE", "ukr")
d <- tibble::tribble(
  ~a , ~ b,
  "громада", "область"
)
d %>% mutate(a = str_remove(a,"гр"))

image

Please investigate this behavior and report possible solutions

EDA - UA population in 2022

Explore population of Ukraine in 2022 using the official statistics from the State Statistics Service.

Serhii @Tytser is the dedicated driver of the analysis. This means that only he should be editing the script "./analysis/ua-pop-2022.R`. Other analysts, who want to contribute to the efforts, need to create a named version of the script (e.g. "./analysis/ua-pop-2022/ua-pop-2022-andriy.R" and alert the driver of the proposed changed

Recommend Projects

  • React photo React

    A declarative, efficient, and flexible JavaScript library for building user interfaces.

  • Vue.js photo Vue.js

    🖖 Vue.js is a progressive, incrementally-adoptable JavaScript framework for building UI on the web.

  • Typescript photo Typescript

    TypeScript is a superset of JavaScript that compiles to clean JavaScript output.

  • TensorFlow photo TensorFlow

    An Open Source Machine Learning Framework for Everyone

  • Django photo Django

    The Web framework for perfectionists with deadlines.

  • D3 photo D3

    Bring data to life with SVG, Canvas and HTML. 📊📈🎉

Recommend Topics

  • javascript

    JavaScript (JS) is a lightweight interpreted programming language with first-class functions.

  • web

    Some thing interesting about web. New door for the world.

  • server

    A server is a program made to process requests and deliver data to clients.

  • Machine learning

    Machine learning is a way of modeling and interpreting data that allows a piece of software to respond intelligently.

  • Game

    Some thing interesting about game, make everyone happy.

Recommend Org

  • Facebook photo Facebook

    We are working to build community through open source technology. NB: members must have two-factor auth.

  • Microsoft photo Microsoft

    Open source projects and samples from Microsoft.

  • Google photo Google

    Google ❤️ Open Source for everyone.

  • D3 photo D3

    Data-Driven Documents codes.