Comments (35)
 monfardineL
commented on May 20, 2024
1
monfardineL
commented on May 20, 2024
1
Hi @monfardineL ,
I want to check if this is issue with the proxy that we are starting in mizu, so just to eliminate this I suggest you will do the following:
- running mizu as you did previously
- while you waiting for it, run "kubectl proxy" in another terminal (you can do it with this command:
kubectl proxy)- go to
http://127.0.0.1:8001/api/v1/namespaces/mizu/services/mizu-api-server:80/proxy/echoand tell me if you see message from mizu agent.This will just validate that agent is working and approve that this is proxy issue that we might need to investigate (I know you did something similar but now it will be without mizu proxy so we will validate it is not proxy issue that you have that not related to mizu)
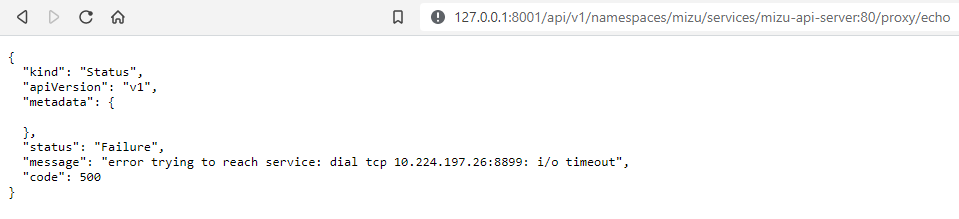
Got the same error as before:
{
  "kind": "Status",
  "apiVersion": "v1",
  "metadata": {

  },
  "status": "Failure",
  "message": "error trying to reach service: dial tcp 10.224.197.26:8899: i/o timeout",
  "code": 500
}
from kubeshark.
 gadotroee
commented on May 20, 2024
1
gadotroee
commented on May 20, 2024
1
Ok, all information you supplied is very helpful.
I will try to explain as many things as possible but first you can also join out slack channel and we can help there (which might be easier than Github issue. also we can schedule f2f meeting (zoom or in slack) to try to solve this interactively.
(this link is invite to our slack - https://join.slack.com/t/up9/shared_invite/zt-tfjnduli-QzlR8VV4Z1w3YnPIAJfhlQ)
From the last logs you shared I can tell that we created the daemon set successfully and there should be tapper pod created on this node: "ip-10-171-106-191.eu-west-1.compute.internal".
(I can see it in the env var which contains node to tapping information and it is the values we are using in the daemon set affinity)
if you do have this node and after running you don't see any pods created (daemon set on 0 DESIRED), it will help me to get the yaml of the resource (k get ds -n mizu -o yaml) to see that the node affinity is correct.
about the service mesh option, it can improve the behavior but not required to make it work so you can skip this settings until you are getting working application.
btw. I tried to run it in EKS cluster (old one that I have) and it seems to work ok and if all of those actions will not help I think it might be permissions issue (or other tool that changes the resource (Daemon set) before creation and the yaml will help me to ensure it is not changed (if you know about any tool that do those kind of changes you are welcome to share about them and I will try to reproduce it with them)
[if you are sharing result from a new run, you can attach the new logs and it will give some context for the information in the message]
from kubeshark.
 dalvarezquiroga
commented on May 20, 2024
1
dalvarezquiroga
commented on May 20, 2024
1
Hi, @dalvarezquiroga
just wanted to let you know that we understand the issue that occurred to you and (most likely), and there is a new unstable release that might work for you.
if you want to give it another try, please consider using this https://github.com/up9inc/mizu/releases/tag/31.0-dev61, soon we will create stable release but in the meantime you can take this and check if it is working for you.
We are here for any questions if you have.
You are totally right! :-) Thanks for write me! I tested this release and now it works like a charm. During next weeks I will test this tool to be able to see all requests and the memory consuption etc...

from kubeshark.
 mertyildiran
commented on May 20, 2024
mertyildiran
commented on May 20, 2024
@jinxin-fu are you able to reproduce the error consistently? If so, does the mizu-api-server pod crash (or non-existing among the list of pods) when the error happens? Since the error is a name lookup error, it makes me think mizu-api-server pod is gone for some reason.
from kubeshark.
 github-actions
commented on May 20, 2024
github-actions
commented on May 20, 2024
This issue is stale because it has been open for 30 days with no activity.
from kubeshark.
 alegmal
commented on May 20, 2024
alegmal
commented on May 20, 2024
@mertyildiran I have the same issue with clean new installation using just tap (tried few times - same result).
gke private cluster
latest mizu version (as per github readme)
mizu-tab.log
mizu-pod.log
mizu_cli.log
from kubeshark.
mertyildiran
commented on May 20, 2024
Might be a related issue: kubernetes/kubectl#1004
The error is thrown on line: https://github.com/kubernetes/kubectl/blob/764d523af876fae3eeaf9dc4e44816c79f3e7f47/pkg/proxy/proxy_server.go#L147
There seems like a test case for that: https://github.com/kubernetes/kubectl/blob/67359a916e3f7bb009b5c42b20d965c9ae725786/pkg/drain/drain_test.go#L97
@RamiBerm you might want to take a look.
from kubeshark.
gadotroee
commented on May 20, 2024
Hi @alegmal
Thanks for reaching out.
It looks like an issue in the proxy, and I can suggest you the following:
-
You can Run the command
API_SERVER_RETRIES=100 mizu tap "*”(We’ve added the option to extend the retries count in order to give more time to debug the problem) -
Try to reach the following url:
http://localhost:8899/api/v1/namespaces/mizu/services/mizu-api-server/proxy/, do you see Mizu UI? -
Can you try to run
kubectl proxydo you see any errors? Can you navigate now to the proxy served url and get response from k8s (you should be able to see the "version" endpoint - (in my laptop it is 8001 by default so I can go tohttp://127.0.0.1:8001/versionand see k8s version details?
Last option that can help is adding --set dump-logs=true to the mizu tap command and it will give you a zip archive at the end of the run that you can share here and we will investigate with more details.
Thanks!
from kubeshark.
 Rushmead
commented on May 20, 2024
Rushmead
commented on May 20, 2024
I found that I got this exact same error in my OpenShift cluster, it seems that for whatever reason it's unable to resolve the api server when the name contains the '.cluster.local'. I'm not sure if this is an issue with my clusters setup or not, but changing the API server URL in the daemonset made it work for me :)
from kubeshark.
monfardineL
commented on May 20, 2024
I have this same error when trying to connect to a private GKE cluster. The mizu-api-server is running fine into the cluster, but then the client keeps having the context canceled error until the timeout.

From the URL http://localhost:8899/api/v1/namespaces/mizu/services/mizu-api-server/proxy/ I get the following error:
{
  "kind": "Status",
  "apiVersion": "v1",
  "metadata": {

  },
  "status": "Failure",
  "message": "error trying to reach service: dial tcp 10.224.210.123:8899: i/o timeout",
  "code": 500
}
from kubeshark.
gadotroee
commented on May 20, 2024
Hi @monfardineL,
Thanks for reaching out, can you please share the log file (/root/.mizu/mizu_cli.log) so I will be able to see if there is any extra information to explain the issue?
Also it is possible to run mizu with --set dump-logs=true and this will create zip file in the end of the run that you can share (it will include some k8s events and pods logs so we can see if the issue is maybe there)
Thanks
from kubeshark.
monfardineL
commented on May 20, 2024
Hi @monfardineL,
Thanks for reaching out, can you please share the log file (/root/.mizu/mizu_cli.log) so I will be able to see if there is any extra information to explain the issue?
Also it is possible to run mizu with
--set dump-logs=trueand this will create zip file in the end of the run that you can share (it will include some k8s events and pods logs so we can see if the issue is maybe there)Thanks
@gadotroee here it goes.
mizu_cli.log
mizu_logs_2022_01_06__15_34_27.zip
from kubeshark.
gadotroee
commented on May 20, 2024
Hi @monfardineL ,
I want to check if this is issue with the proxy that we are starting in mizu, so just to eliminate this I suggest you will do the following:
- running mizu as you did previously
- while you waiting for it, run "kubectl proxy" in another terminal (you can do it with this command:
kubectl proxy) - go to
http://127.0.0.1:8001/api/v1/namespaces/mizu/services/mizu-api-server:80/proxy/echoand tell me if you see message from mizu agent.
This will just validate that agent is working and approve that this is proxy issue that we might need to investigate (I know you did something similar but now it will be without mizu proxy so we will validate it is not proxy issue that you have that not related to mizu)
from kubeshark.
monfardineL
commented on May 20, 2024
I don't know if it helps on anything, but I tried to cURL the Mizu pod from inside the cluster and the result looks like what's expected for me:

from kubeshark.
gadotroee
commented on May 20, 2024
Thanks, @monfardineL
It does help.
I understand the problem is when working from the laptop after starting the proxy (no matter in which way proxy was started).
I have one last suggestion that might be used as workaround (just to let you experience mizu until we understand the reason for this and solve the case of context canceled)
The suggestion is to create (or change) service with type Load Balancer and see if we can access it.
to do this debugging and be sure that mizu will not clean itself after checking if available you can add env var API_SERVER_RETRIES which cause it to retry more times (you can give it value of 100 for example) and then your command will look like API_SERVER_RETRIES=100 mizu tap ....
while this command is running you can do one of the following:
- create another service of type Load Balancer using this command:
$ kubectl expose deployment -n mizu --port 80 --target-port 8899 mizu-api-server --type=LoadBalancer --name=mizu-lb(taken from here if you want to read more https://github.com/up9inc/mizu/wiki/Accessing-Mizu#example-loadbalancer) - change the service that has been created by mizu to type "Load Balancer"
After some time you should get public ip for this service and see if you can run / use mizu.
(just ti be sure you understand, after those 100 retries mizu will go out so this is workaround to see it is working)
I'm investigating the issue and try to come with a better solution in the near future.
Thanks for the details and I hope it will work for you so you will give more feedback about the usage..
from kubeshark.
monfardineL
commented on May 20, 2024
Thanks, @monfardineL It does help. I understand the problem is when working from the laptop after starting the proxy (no matter in which way proxy was started).
I have one last suggestion that might be used as workaround (just to let you experience mizu until we understand the reason for this and solve the case of context canceled)
The suggestion is to create (or change) service with type Load Balancer and see if we can access it. to do this debugging and be sure that mizu will not clean itself after checking if available you can add env var API_SERVER_RETRIES which cause it to retry more times (you can give it value of 100 for example) and then your command will look like
API_SERVER_RETRIES=100 mizu tap ....while this command is running you can do one of the following:
- create another service of type Load Balancer using this command:
$ kubectl expose deployment -n mizu --port 80 --target-port 8899 mizu-api-server --type=LoadBalancer --name=mizu-lb(taken from here if you want to read more https://github.com/up9inc/mizu/wiki/Accessing-Mizu#example-loadbalancer)- change the service that has been created by mizu to type "Load Balancer"
After some time you should get public ip for this service and see if you can run / use mizu. (just ti be sure you understand, after those 100 retries mizu will go out so this is workaround to see it is working)
I'm investigating the issue and try to come with a better solution in the near future.
Thanks for the details and I hope it will work for you so you will give more feedback about the usage..
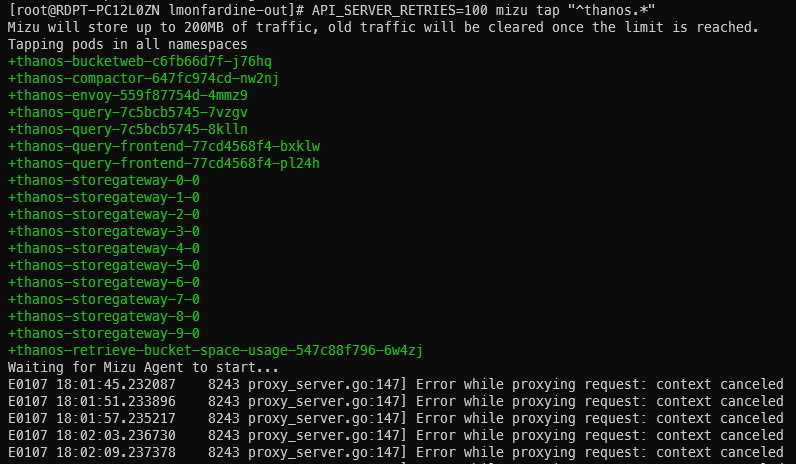
@gadotroee I had to do a little change in the command, from deployment to pod, since the mizu app isn't creating a deploy, so:
kubectl expose pod -n mizu --port 80 --target-port 8899 mizu-api-server --type=LoadBalancer --name=mizu-lb did the job and the loadbalancer was created without problems. After a while I had an IP to access mizu.
Now, I don't to want mix things, so if you think this is unrelated (as I do), I can open a second issue later, but I noticed this, while accessing Mizu through the Loadbalancer:

Nothing being tracked.
Confirmation that I did got a few pods at start:
And logs from Mizu pod running:
mizu-api-server mizu-api-server [GIN] 2022/01/07 - 18:08:58 | 200 |     161.807µs |   10.224.188.26 | GET      "/"
mizu-api-server mizu-api-server [2022-01-07T18:08:58.161+0000] INFO  ▶ Websocket event - Browser socket disconnected, socket ID:  7 ▶ [1 socket_server_handlers.go:46 WebSocketDisconnect]
mizu-api-server mizu-api-server 2022/01/07 18:08:58 Reached EOF on server connection.
mizu-api-server mizu-api-server [GIN] 2022/01/07 - 18:08:58 | 200 |  6.335944914s |   10.224.188.21 | GET      "/ws"
mizu-api-server mizu-api-server [GIN] 2022/01/07 - 18:08:58 | 200 |      50.357µs |   10.224.188.26 | GET      "/status/auth"
mizu-api-server mizu-api-server [GIN] 2022/01/07 - 18:08:58 | 200 |      29.242µs |   10.224.188.20 | GET      "/status/tap"
mizu-api-server mizu-api-server [GIN] 2022/01/07 - 18:08:58 | 200 |      74.994µs |   10.224.188.29 | GET      "/status/recentTLSLinks"
mizu-api-server mizu-api-server [2022-01-07T18:08:58.853+0000] INFO  ▶ Websocket event - Browser socket connected, socket ID: 8 ▶ [1 socket_server_handlers.go:34 WebSocketConnect]
mizu-api-server mizu-api-server 2022/01/07 18:08:58 Client connected from 127.0.0.1:57214
mizu-api-server mizu-api-server [GIN] 2022/01/07 - 18:08:58 | 200 |   14.823628ms |   10.224.188.29 | GET      "/status/analyze"
mizu-api-server mizu-api-server 2022/01/07 18:08:58 Client connected from 127.0.0.1:57216
mizu-api-server mizu-api-server 2022/01/07 18:08:58 Reached EOF on server connection.
mizu-api-server mizu-api-server 2022/01/07 18:08:58 Client at 127.0.0.1:57216 disconnected.
I did a second run without any pod filter (the whole cluster) and the result is the same.
from kubeshark.
gadotroee
commented on May 20, 2024
I don't know if it helps on anything, but I tried to cURL the Mizu pod from inside the cluster and the result looks like what's expected for me:
Ok, this is a good progress.
First, I'm sorry that this command didn't work (we have a way to run mizu in a deployment mode and then it will work but it is not your case)
It seems that the issue is not really related but it might tell us some more information,
I will investigate a little bit and come back with some more answers as soon as I can.
Thanks for the corporation and sharing your status, we will be in touch soon and have a good weekend.
from kubeshark.
gadotroee
commented on May 20, 2024
Hi @monfardineL,
unfortunately I don't have any new findings about this issue - the main suspect is the web-socket connection that we have between mizu site that you are viewing and the api server in the cluster.
(it might be related or not to the proxy issue that you had before)
Is it possible to arrange meeting and trying to solve it (maybe when we see the cluster and can "debug live" it can help to understand what is the root cause).
Thanks
from kubeshark.
monfardineL
commented on May 20, 2024
Hi @monfardineL,
unfortunately I don't have any new findings about this issue - the main suspect is the web-socket connection that we have between mizu site that you are viewing and the api server in the cluster. (it might be related or not to the proxy issue that you had before)
Is it possible to arrange meeting and trying to solve it (maybe when we see the cluster and can "debug live" it can help to understand what is the root cause).
Thanks
Hey @gadotroee I have one question that you can help me clarify so maybe I can do some checks with my network team before we proceed.
The mizu app connects to the pod the same way as a "kubectl proxy" would do, or does it try to open some other kind of connection using port 8899?
If my network team doesn't find anything suspect, we can sure schedule a meeting.
from kubeshark.
gadotroee
commented on May 20, 2024
Hi @monfardineL,
unfortunately I don't have any new findings about this issue - the main suspect is the web-socket connection that we have between mizu site that you are viewing and the api server in the cluster. (it might be related or not to the proxy issue that you had before)
Is it possible to arrange meeting and trying to solve it (maybe when we see the cluster and can "debug live" it can help to understand what is the root cause).
ThanksHey @gadotroee I have one question that you can help me clarify so maybe I can do some checks with my network team before we proceed. The mizu app connects to the pod the same way as a "kubectl proxy" would do, or does it try to open some other kind of connection using port 8899?
If my network team doesn't find anything suspect, we can sure schedule a meeting.
Hi @monfardineL,
I will try to answer it and hope it will help them (or you) to understand how mizu works and potentially find a good solution to all issues you currently have.
The think is that you are publishing components to you cluster (mizu api server and the tapper daemon set (which starts only on nodes that has "tapped" pods).
As long as you run in just "./mizu tap" those components live as long as the mizu cli is running (it started from there and cleaned up when you close the terminal - as you already saw).
To be able to see that traffic that mizu captured and actually use mizu - the cli starts proxy (that is very close to the kubectl proxy but with one major change that gives you way to access only specific service (mizu-api-server) [there is replacements that we do to redirect any request that you are doing locally to this service in the cluster]
so when you are going to "http://localhost:8899" you are actually accessing something like "http://127.0.0.1:8899/api/v1/namespaces/mizu/services/mizu-api-server:80/proxy"
and then you are getting the "home page" (mizu UI that you accessed with the load balancer service)
this page is the frontend of mizu and making request to the api-server in 2 ways - HTTP requests and long living web socket connection.
(it will be interesting to see if you can give some details about those requests (when you are working with the load balancer which is the only way you actually was able to see the UI. (e.g by going to the chrome dev tools and maybe we can understand from there if there are any failures in those requests and which kind of failures)
I hope it is not too much details and I'm here to help if needed in anything else.
btw, you can join our community slack channel - here is the invite link if you want https://join.slack.com/t/up9/shared_invite/zt-tfjnduli-QzlR8VV4Z1w3YnPIAJfhlQ, there are some details there and we might answer more quickly.
from kubeshark.
monfardineL
commented on May 20, 2024
Hey @gadotroee just passing by to inform I didn't abandon the case. Just hadn't time (neither network team) to follow on the subject. But I'll join the slack channel as soon as possible.
from kubeshark.
gadotroee
commented on May 20, 2024
We have release pre-release version https://github.com/up9inc/mizu/releases/tag/0.22.13 that should help in this case.
from kubeshark.
gadotroee
commented on May 20, 2024
Hi @jinxin-fu, as you are the original reporter of this issue, I would like to know if this solves your issue. (using version 0.22.13 and above)
Thanks.
from kubeshark.
dalvarezquiroga
commented on May 20, 2024
Hello guys, thanks for this tool, for the moment I cannot test because I have exactly the same problem that OP described.
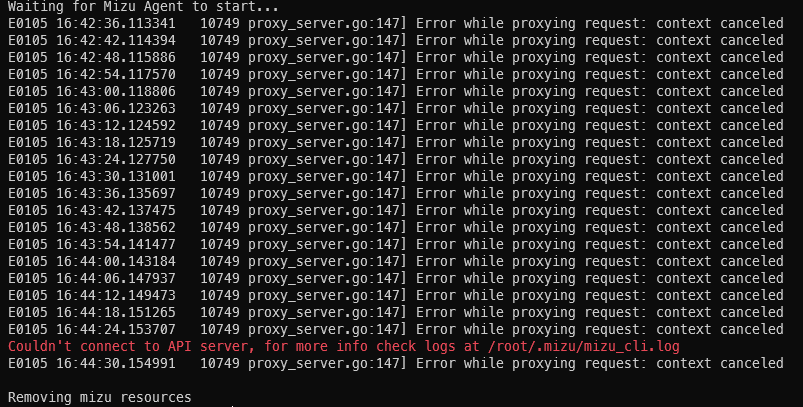
Waiting for Mizu Agent to start...
Mizu is available at http://localhost:8899
E0217 17:21:32.323558 713 proxy_server.go:147] Error while proxying request: context canceled
E0217 17:21:32.489560 713 proxy_server.go:147] Error while proxying request: context canceled
mizu version
Version: 27.1 (main)
kubectl version
Client Version: version.Info{Major:"1", Minor:"22", GitVersion:"v1.22.0", GitCommit:"c2b5237ccd9c0f1d600d3072634ca66cefdf272f", GitTreeState:"clean", BuildDate:"2021-08-04T18:03:20Z", GoVersion:"go1.16.6", Compiler:"gc", Platform:"linux/amd64"}
Server Version: version.Info{Major:"1", Minor:"21+", GitVersion:"v1.21.5-eks-bc4871b", GitCommit:"5236faf39f1b7a7dabea8df12726f25608131aa9", GitTreeState:"clean", BuildDate:"2021-10-29T23:32:16Z", GoVersion:"go1.16.8", Compiler:"gc", Platform:"linux/amd64"}
from kubeshark.
gadotroee
commented on May 20, 2024
Hi @dalvarezquiroga,
can you attach your logs (~/.mizu/mizu_cli.log) or even better to run with --set dump-logs=true and then attach the created zip? it will help us understand the specific problem..
Thanks
from kubeshark.
dalvarezquiroga
commented on May 20, 2024
Sure @gadotroee if I can help with the debug, you can find here attached using --set dump-logs=true. Thanks.
mizu_logs_2022_02_18__10_29_39.zip
from kubeshark.
gadotroee
commented on May 20, 2024
Thanks for the logs and for the help and I hope we will find solution so you will be able to run and use mizu..
Ok, from first look over the logs everything looks good.
I can see that after running the command we are successfully got valid response (after creating proxy), and then at some time we got termination signal.
some questions that I have now to be sure I understand correctly:
- Are you using private cluster? (the case in this issue was private cluster and we fixed it so version 27.1 which you are running should work with it but I want to get context.
- did you get any valid page when you access "http::/localhost:8899" (even for a short time after you start the mizu)
I hope it make senes I will try to investigate it and come back as soon as I can with more information.
from kubeshark.
dalvarezquiroga
commented on May 20, 2024
Thanks!
Are you using private cluster? (the case in this issue was private cluster and we fixed it so version 27.1 which you are running should work with it but I want to get context.

- I am using EKS service in AWS.

did you get any valid page when you access "http::/localhost:8899" (even for a short time after you start the mizu)

- Sure, I have the webpage but I am not able to see any events or traffic.
from kubeshark.
gadotroee
commented on May 20, 2024
Thanks for the answers.
I will validate it in EKS cluster on Amazon, but it is good to hear that you are able t see mizu.
Also I'm not sure it is the same problem because the problem that mentioned here before is when you cant get to the mizu app page.
If you do see it, it is probably another issue, do you see any information on the top bar of pods that we detect that and should be tapped? When you are "hover" on it you should see list of pods and "v" or "x" to know that we have pod of mizu (tapper pod, which is part of daemon set) that should see them.
If you can share screen shot it might help too.
from kubeshark.
dalvarezquiroga
commented on May 20, 2024
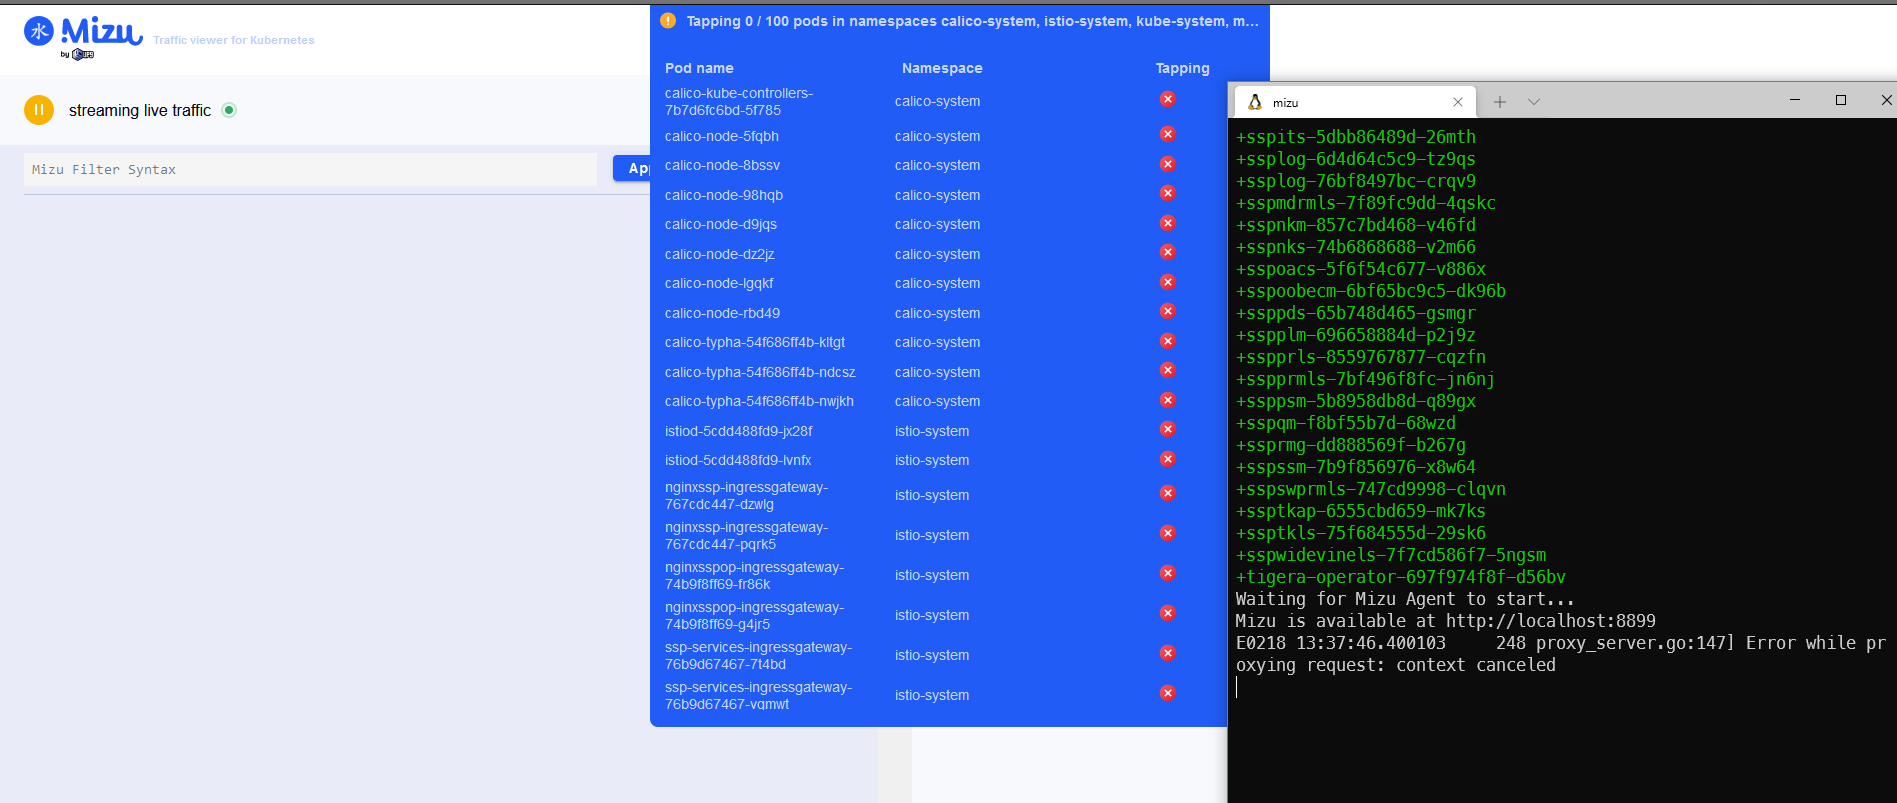
Thanks @gadotroee , yeah sorry maybe is not the correct issue to discuss about my problem. Sure I attached a screenshot that you can see that all of pods are with X. And the message from console.
from kubeshark.
gadotroee
commented on May 20, 2024
Ok, I think this is what I need for now, might take me some time to reproduce or investigate, hope to come back with answer in a the next few days.
Two things that you can do:
-
just to double check you can try to run the the tap command with regex for less pods to match (maybe even exact name of specific pod), and see if in this case it is working (I suspect it is issues when tapping big number of pods)
-
After running you should see tapper pod, it is daemon set that will start pods in nodes that has pods that should be tapped, you can try and check that those pods are really created and working (they are probably not because than you would see a green "V" instead of red "X"
The logs from --set dump-logs=true gets the log of those pods so they might help me too (I'm still need to read the zip that you send before because I thought you don't really see the UI and now it is different problem)
from kubeshark.
dalvarezquiroga
commented on May 20, 2024
Hello, no problem, take your neccesary time it's only for testing the tool in our kubernetes cluster.
Answering your points:
-
I think is not the problem with only 1 pod to "tap" here the test. Same behaviour.

-
Yes , I see the POD running mizu-api-server ready 2/2 is okay. The daemon set has been created, yes but it looks like doesn't contain any pod...
k get pods -n mizu NAME READY STATUS RESTARTS AGE mizu-api-server 2/2 Running 0 13m
k get ds -n mizu NAME DESIRED CURRENT READY UP-TO-DATE AVAILABLE NODE SELECTOR AGE mizu-tapper-daemon-set 0 0 0 0 0 <none> 14m
k describe ds mizu-tapper-daemon-set -n mizu
Name: mizu-tapper-daemon-set
Selector: app=mizu-tapper
Node-Selector:
Labels: app.kubernetes.io/created-by=mizu-cli
app.kubernetes.io/managed-by=mizu
Annotations: deprecated.daemonset.template.generation: 1
Desired Number of Nodes Scheduled: 0
Current Number of Nodes Scheduled: 0
Number of Nodes Scheduled with Up-to-date Pods: 0
Number of Nodes Scheduled with Available Pods: 0
Number of Nodes Misscheduled: 0
Pods Status: 0 Running / 0 Waiting / 0 Succeeded / 0 Failed
Pod Template:
Labels: app=mizu-tapper
app.kubernetes.io/created-by=mizu-cli
app.kubernetes.io/managed-by=mizu
Service Account: mizu-service-account
Containers:
mizu-tapper:
Image: docker.io/up9inc/mizu:27.1
Port:
Host Port:
Command:
./mizuagent
-i
any
--tap
--api-server-address
ws://mizu-api-server.mizu.svc.cluster.local/wsTapper
--nodefrag
Limits:
cpu: 750m
memory: 1Gi
Requests:
cpu: 50m
memory: 50Mi
Environment:
LOG_LEVEL: INFO
HOST_MODE: 1
TAPPED_ADDRESSES_PER_HOST: {"ip-10-171-106-191.eu-west-1.compute.internal":[{"metadata":{"name":"kiali-586ffd4f55-dblcb","creationTimestamp":null},"spec":{"containers":null},"status":{"podIP":"10.171.106.88"}}]}
GOGC: 12800
SENSITIVE_DATA_FILTERING_OPTIONS: {"IgnoredUserAgents":null,"PlainTextMaskingRegexes":null,"DisableRedaction":false}
NODE_NAME: (v1:spec.nodeName)
Mounts:
/app/config/ from mizu-config (rw)
/hostproc from proc (ro)
Volumes:
mizu-config:
Type: ConfigMap (a volume populated by a ConfigMap)
Name: mizu-config
Optional: false
proc:
Type: HostPath (bare host directory volume)
Path: /proc
HostPathType:
Events:
I am using Istio like service mesh but I didn't configure yet the following steps: (I don't know if are obligatory or optional )
https://github.com/up9inc/mizu/blob/main/docs/SERVICE_MESH.md
from kubeshark.
github-actions
commented on May 20, 2024
This issue is stale because it has been open for 30 days with no activity.
from kubeshark.
github-actions
commented on May 20, 2024
This issue was closed because it has been inactive for 14 days since being marked as stale.
from kubeshark.
gadotroee
commented on May 20, 2024
Hi, @dalvarezquiroga
just wanted to let you know that we understand the issue that occurred to you and (most likely), and there is a new unstable release that might work for you.
if you want to give it another try, please consider using this https://github.com/up9inc/mizu/releases/tag/31.0-dev61, soon we will create stable release but in the meantime you can take this and check if it is working for you.
We are here for any questions if you have.
from kubeshark.
Related Issues (20)
- Improve support for homebrew HOT 8
- Add Websocket support
- Detect socket creation errors using eBPF
- Kind support( pf-ring, ebpf, serviceMesh) HOT 8
- Specific PCAP TTL for Errors HOT 1
- Kubeshark with Bottlerocket? HOT 1
- kubeshark deployment DOSes `kube-apiserver` if k8s audit events enabled HOT 10
- Client OS: `windows 10`, chrome: `121.0.6167.185` failing HOT 1
- New Helper named Uniqe HOT 1
- Using kubeshark CLI with multiple kubeconfig files
- We can't verify pre-built binaries for windows/amd64 with checksum files HOT 1
- WebSockets in an IPv6 primary cluster fail HOT 2
- no push access for the kubeshark fork HOT 1
- Windows 11 Curl install does not work HOT 1
- Improve/Complete AMQP support
- Resolved K8s component name is inaccurate
- Does ICMP Traffic Capture is not possible?
- Upgrade fails HOT 1
- eBPF tracer Crashes for Kernel versions older than 5.5 HOT 7
- lost prefix docker-io for Pf ring kernel module
Recommend Projects
-
 React
React
A declarative, efficient, and flexible JavaScript library for building user interfaces.
-
Vue.js
🖖 Vue.js is a progressive, incrementally-adoptable JavaScript framework for building UI on the web.
-
 Typescript
TypeScript is a superset of JavaScript that compiles to clean JavaScript output.
-
TensorFlow
An Open Source Machine Learning Framework for Everyone
-
Django
The Web framework for perfectionists with deadlines.
-
 Laravel
A PHP framework for web artisans
-
D3
Bring data to life with SVG, Canvas and HTML. 📊📈🎉
-
Recommend Topics
-
javascript
JavaScript (JS) is a lightweight interpreted programming language with first-class functions.
-
web
Some thing interesting about web. New door for the world.
-
server
A server is a program made to process requests and deliver data to clients.
-
Machine learning
Machine learning is a way of modeling and interpreting data that allows a piece of software to respond intelligently.
-
Visualization
Some thing interesting about visualization, use data art
-
Game
Some thing interesting about game, make everyone happy.
Recommend Org
-
Facebook
We are working to build community through open source technology. NB: members must have two-factor auth.
-
Microsoft
Open source projects and samples from Microsoft.
-
Google
Google ❤️ Open Source for everyone.
-
Alibaba
Alibaba Open Source for everyone
-
D3
Data-Driven Documents codes.
-
Tencent
China tencent open source team.
from kubeshark.