Giter VIP home page Giter VIP logo

mmm-covid19-inc's Introduction

MMM-COVID19-Inc

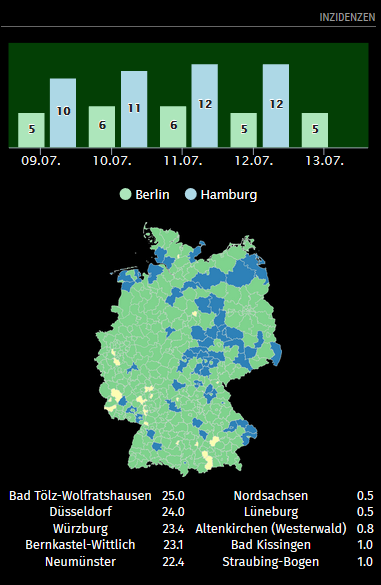
A MagicMirror module showing last days COVID19 incidence rates.
Uses data from RKI.
Only available for Germany

Installation

  1. Navigate into your MagicMirror's modules folder and execute git clone https://github.com/lavolp3/MMM-COVID19-Inc.git.
  2. Navigate into the module folder and install npm dependencies: cd MMM-COVID19-Inc && npm install
  3. Add the module in config.js placing it where you prefer.
{
    module: "MMM-COVID19-Inc",
    position: "top_right",   // see mirror settings for options
    header: "Inzidenzen",
    config: {
        width: 400,
        days: 7,
        districts: ['Berlin', 'Hamburg'],
        chartType: "line",  //use "line" or "bar"
        showGraph: true,
        showMap: true,
        showRanks: true,
        ranks: 5,
    },
},

Config options

Option Description
chartType Type of chart
Type: string
Values: 'line', 'bar'
Default: "line"
width Width of the graph
Type: Integer
Default: 400
chartHeight Height of the chart
Type: Integer
Default: 300
days Number of days to show
Type: Integer
Default: 7
districts Array with districts to show (see below!)
Type: array
Values:['region1', 'region2', ...]
Default: ['Berlin', 'Hamburg']
showYAxis Show Y-Axis of chart
Type: boolean
Default: false
showGraph Show graph of seleced regions
Type: boolean
Default: true
showMap Show heatmap of Germany
Type: boolean
Default: true
mapWidth Control the maps width/height with this
Type: integer
Default: 250
showRanks Show ranks of Regions with highest/lowest Incidence rates
Type: boolean
Default: true
ranks Number of entries with highest/lowest Incidence
Type: integer
Default: 5
debug Debug mode (increased console output)
Type: boolean
Default: false

Districts

You can have the module search for districts (Landkreise) by just including the name of the district.
If it doesn't show on the graph, you probably haven't used the proper name of the district.
E.g. "Wesel" will work (Kreis Wesel). "Moers" will not (part of "Kreis Wesel").

Screenshot

Incidence rates Screenshot

Source

Data provided by api.corona-zahlen.org, provided by Marlon Lückert
Thanks Marlon!

mmm-covid19-inc's People

Contributors

kristjanesperanto avatar lavolp3 avatar

Stargazers

 avatar  avatar  avatar

Watchers

 avatar  avatar  avatar

mmm-covid19-inc's Issues

Differenc between Districts and Cities

Hello,
I’ve been using your Covid19 module since last week. First class work!

But now I noticed something:
If I display the values ​​for "Nürnberg" and "Nürnberger Land" in the bar view of the incidences,
only the values ​​for the district of "Nürnberger Land" are displayed for both, not for the city of "Nürnberg".
The city of "Nürnberg" does not belong to the district of "Nürnberger Land".

The same applies to the district of "Amberg-Sulzbach" and the city of "Amberg".
The cities are listed separately at api.corona-zahlen.org/districts.

Is it not possible to compare town and district or am I getting something wrong?

Otherwise everything works fine.

Thank you for the module.

Greetings

Recommend Projects

  • React photo React

    A declarative, efficient, and flexible JavaScript library for building user interfaces.

  • Vue.js photo Vue.js

    🖖 Vue.js is a progressive, incrementally-adoptable JavaScript framework for building UI on the web.

  • Typescript photo Typescript

    TypeScript is a superset of JavaScript that compiles to clean JavaScript output.

  • TensorFlow photo TensorFlow

    An Open Source Machine Learning Framework for Everyone

  • Django photo Django

    The Web framework for perfectionists with deadlines.

  • D3 photo D3

    Bring data to life with SVG, Canvas and HTML. 📊📈🎉

Recommend Topics

  • javascript

    JavaScript (JS) is a lightweight interpreted programming language with first-class functions.

  • web

    Some thing interesting about web. New door for the world.

  • server

    A server is a program made to process requests and deliver data to clients.

  • Machine learning

    Machine learning is a way of modeling and interpreting data that allows a piece of software to respond intelligently.

  • Game

    Some thing interesting about game, make everyone happy.

Recommend Org

  • Facebook photo Facebook

    We are working to build community through open source technology. NB: members must have two-factor auth.

  • Microsoft photo Microsoft

    Open source projects and samples from Microsoft.

  • Google photo Google

    Google ❤️ Open Source for everyone.

  • D3 photo D3

    Data-Driven Documents codes.