Giter VIP home page Giter VIP logo

lightdash's Introduction

The open-source Looker alternative.


WebsiteWatch demoDocsJoin Slack Community

Enable everybody in your company to answer their own questions using data

connect your dbt project --> add metrics into dbt --> share insights with your team

If you're a fan, star the repo ⭐️ (we plant a tree for every GitHub star we get 🌱).

Come join the team, we're hiring.

Features:

  • 🙏 Familiar interface for your users to self-serve using pre-defined metrics
  • 👩‍💻 Declare dimensions and metrics in yaml alongside your dbt project
  • 🤖 Automatically creates dimensions from your dbt models
  • 📖 dbt descriptions and metadata synced for your users
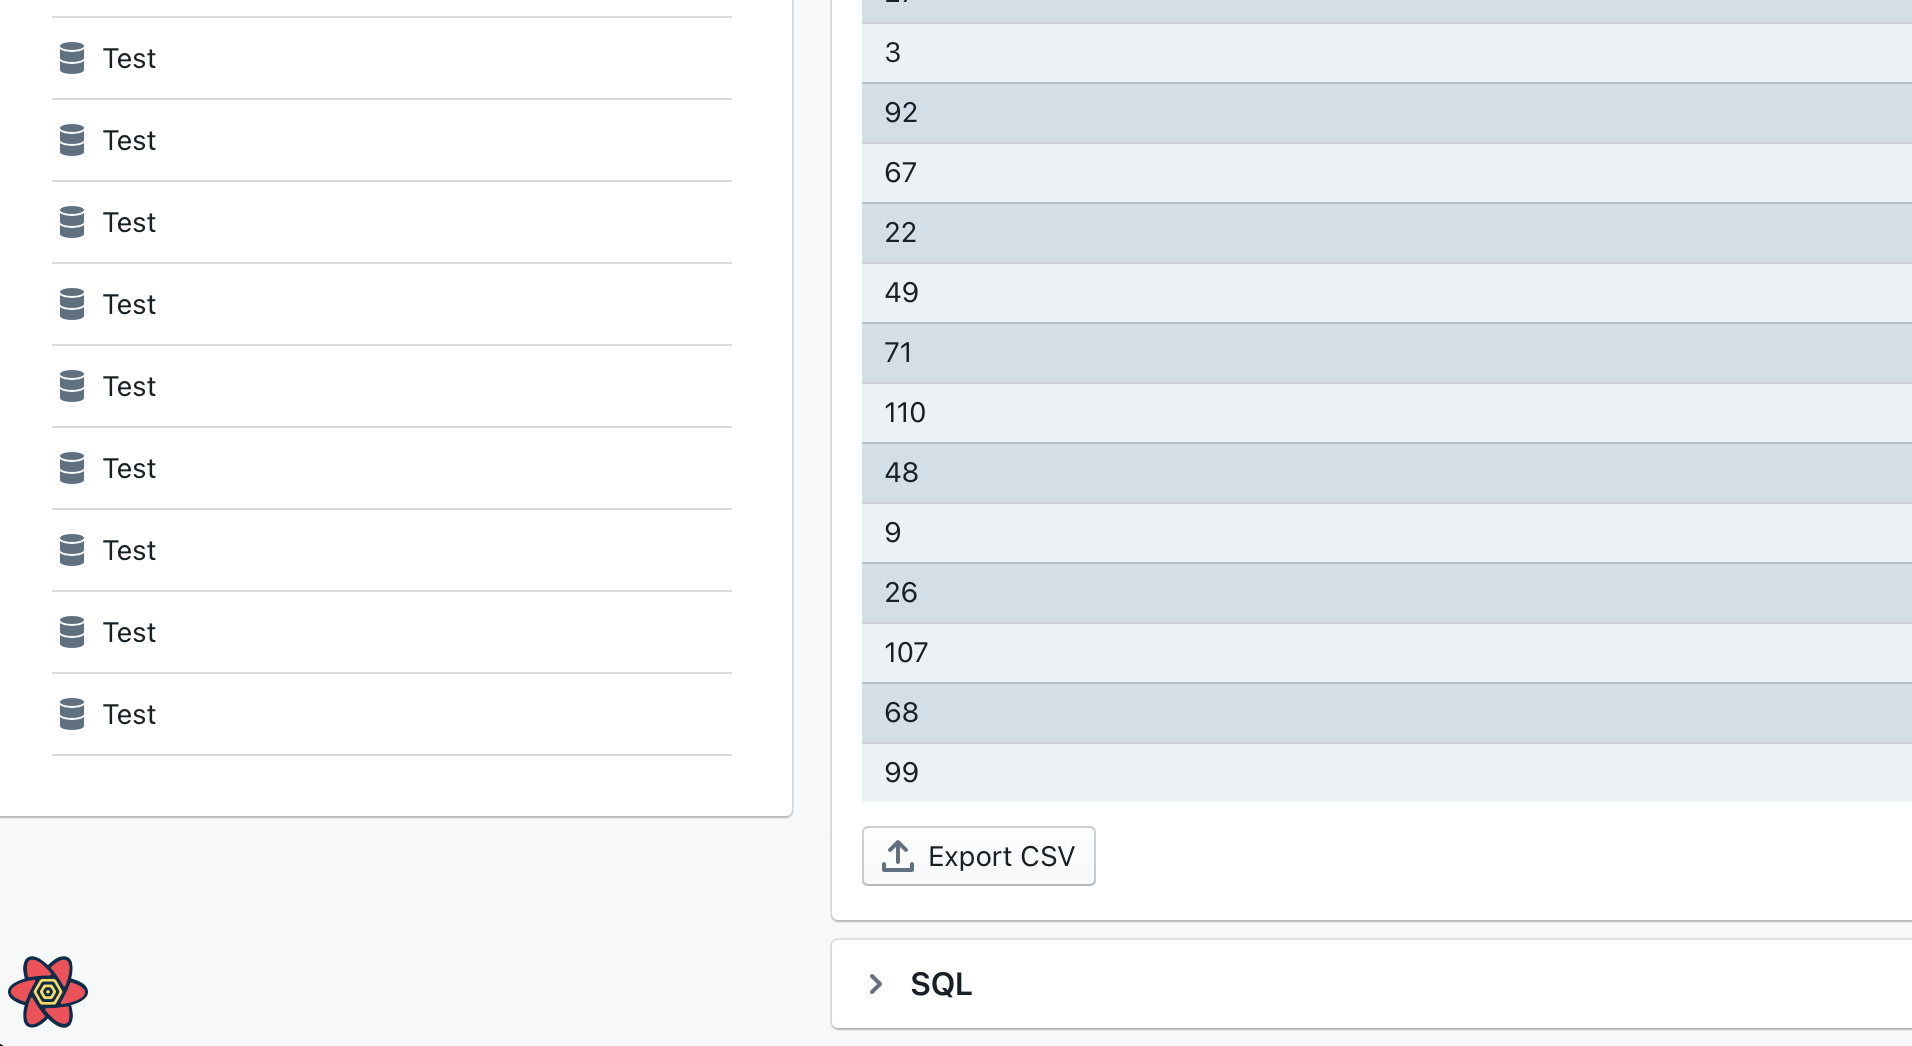
  • 🔍 Easily access to underlying records of charts as well as ability to data drill-down
  • 🧮 Table calculations make it easy to dig into your data, on the fly
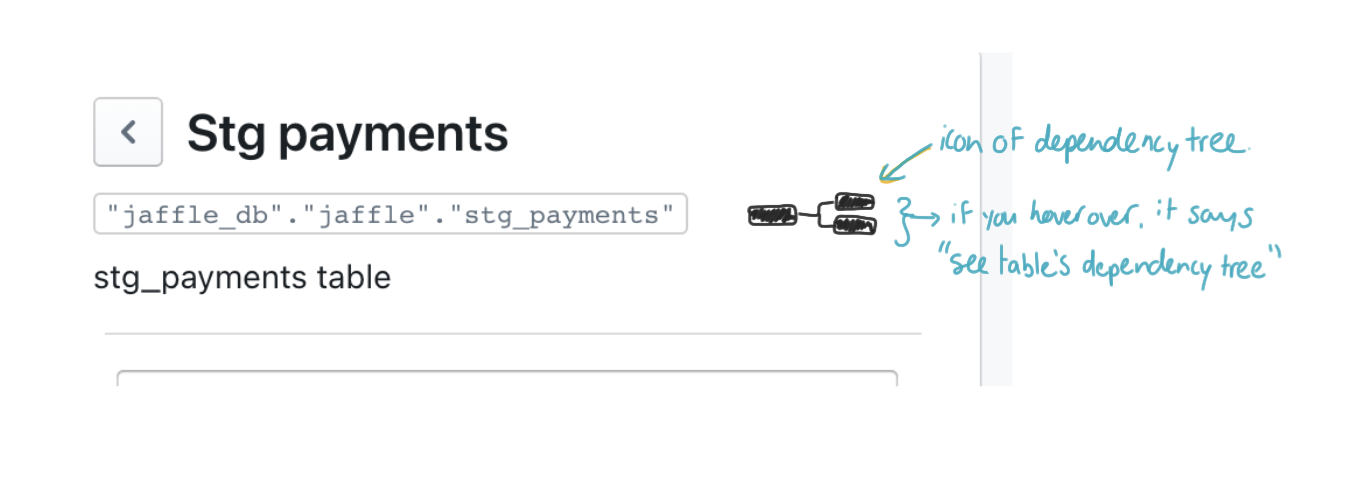
  • 🕵️‍♀️ Lineage lets you see the upstream and downstream dependencies of a model
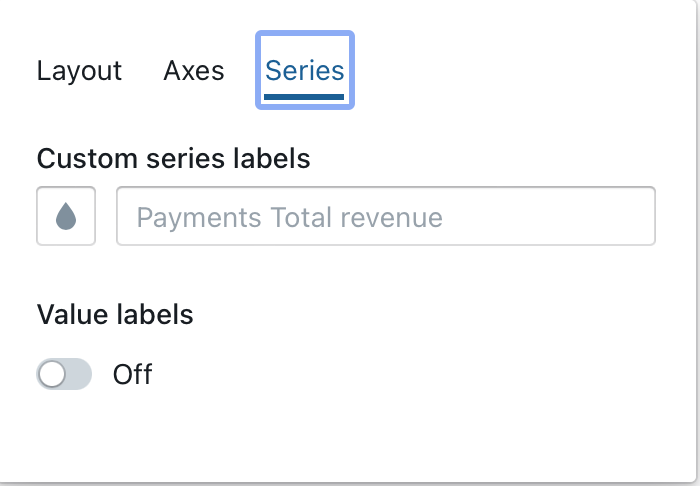
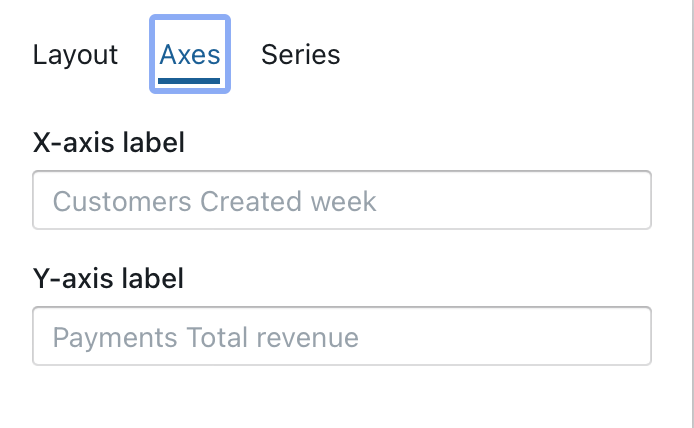
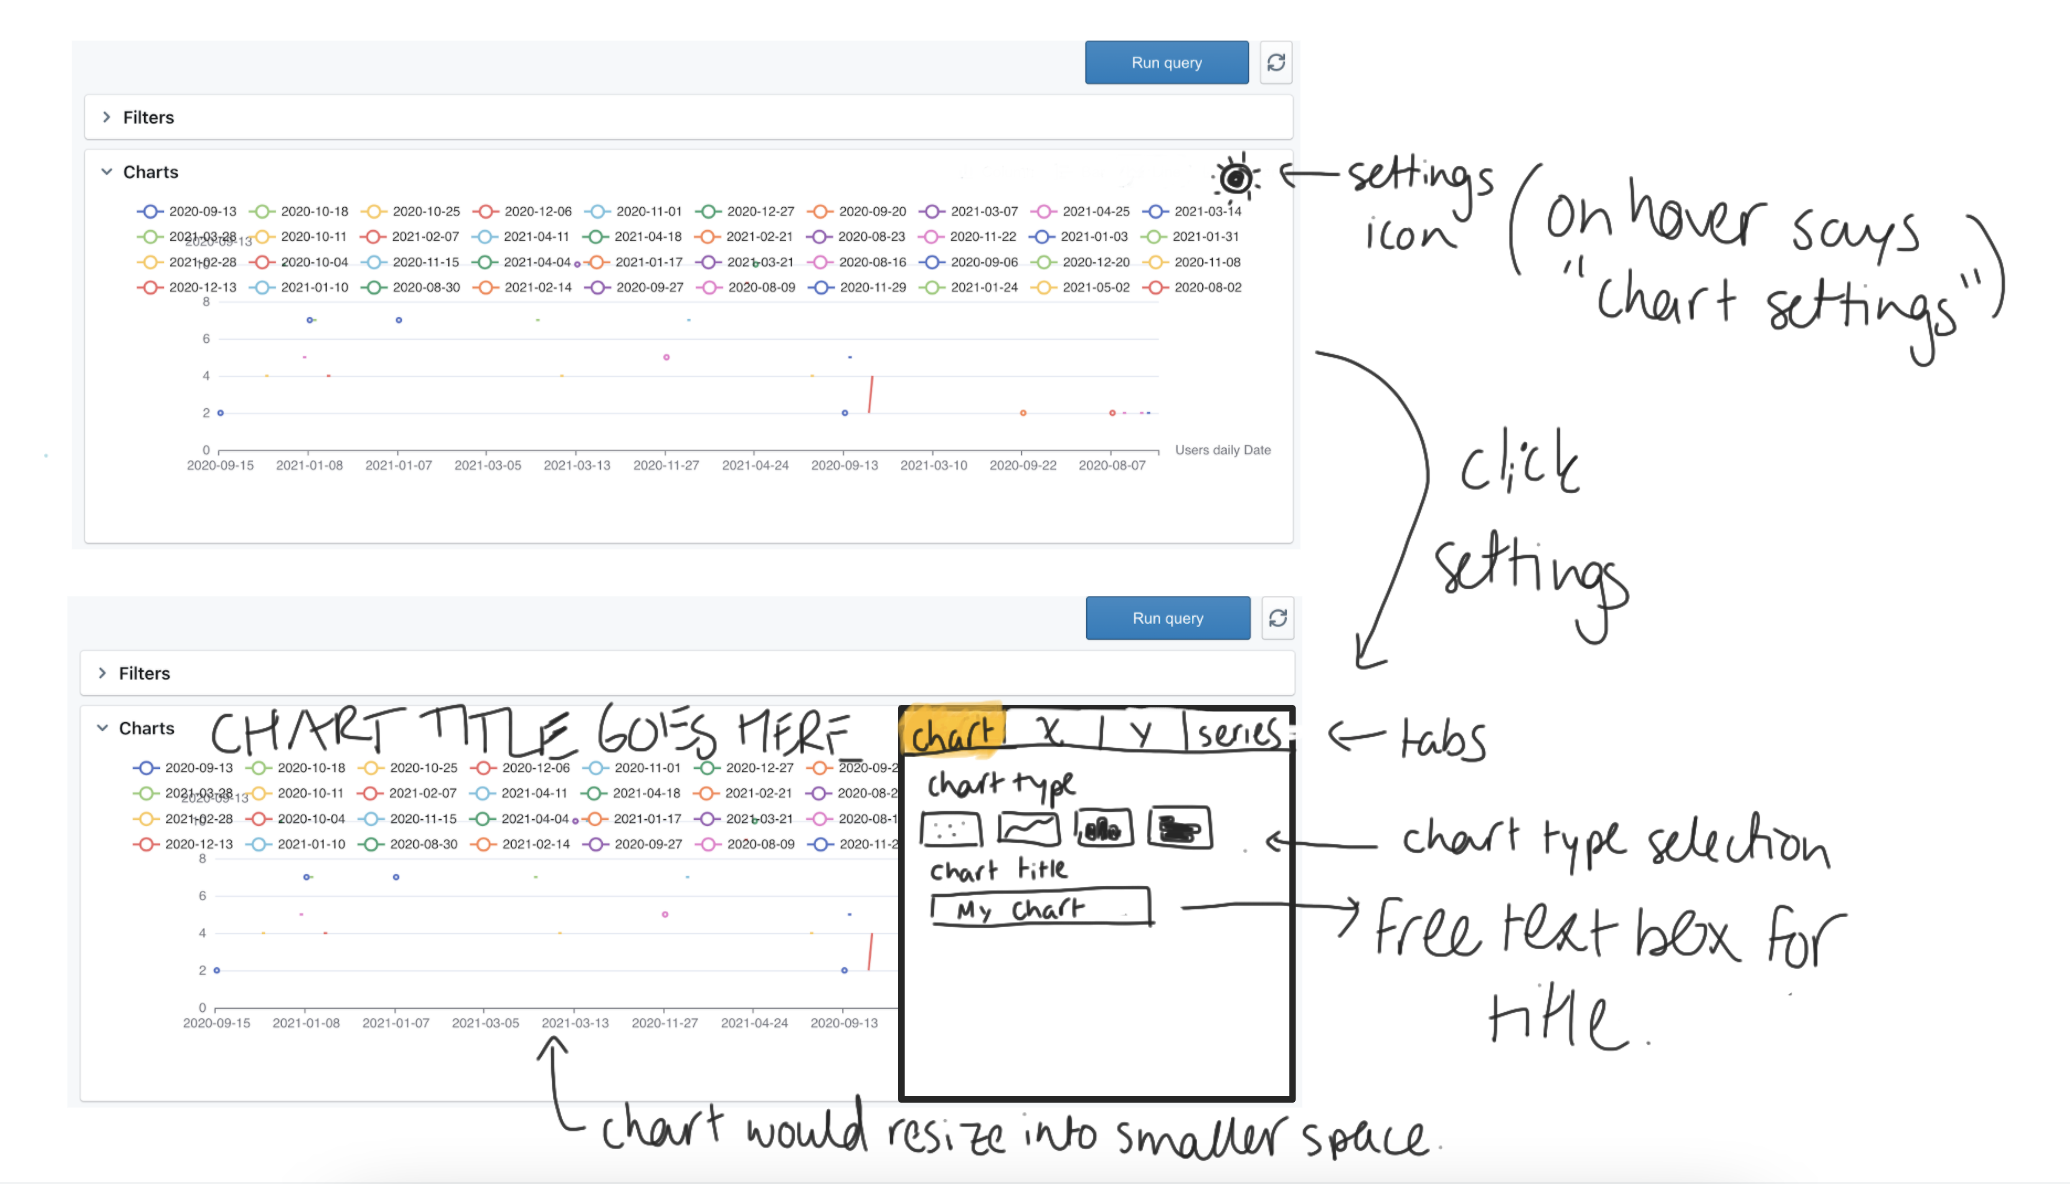
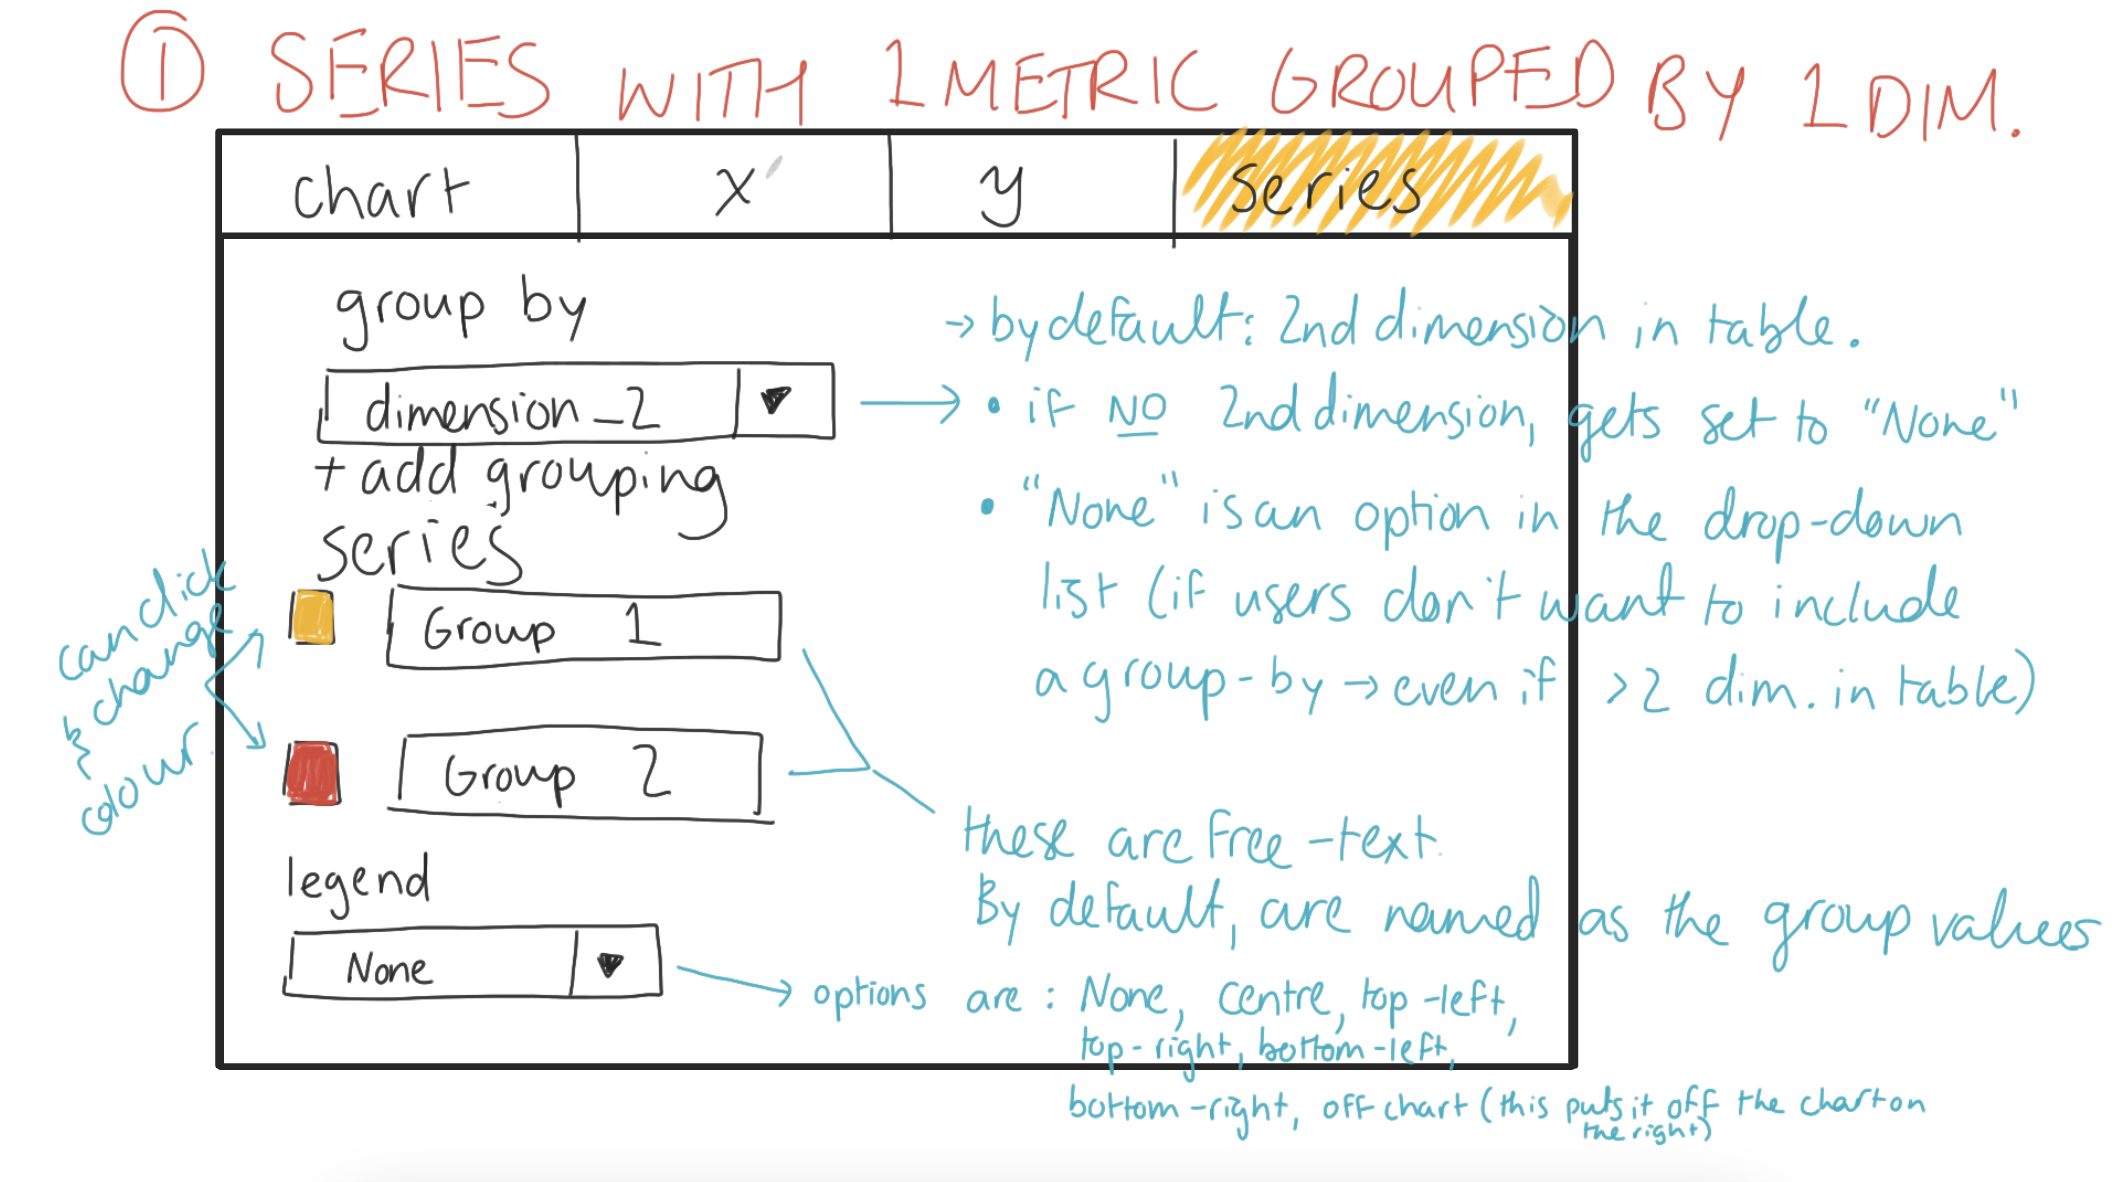
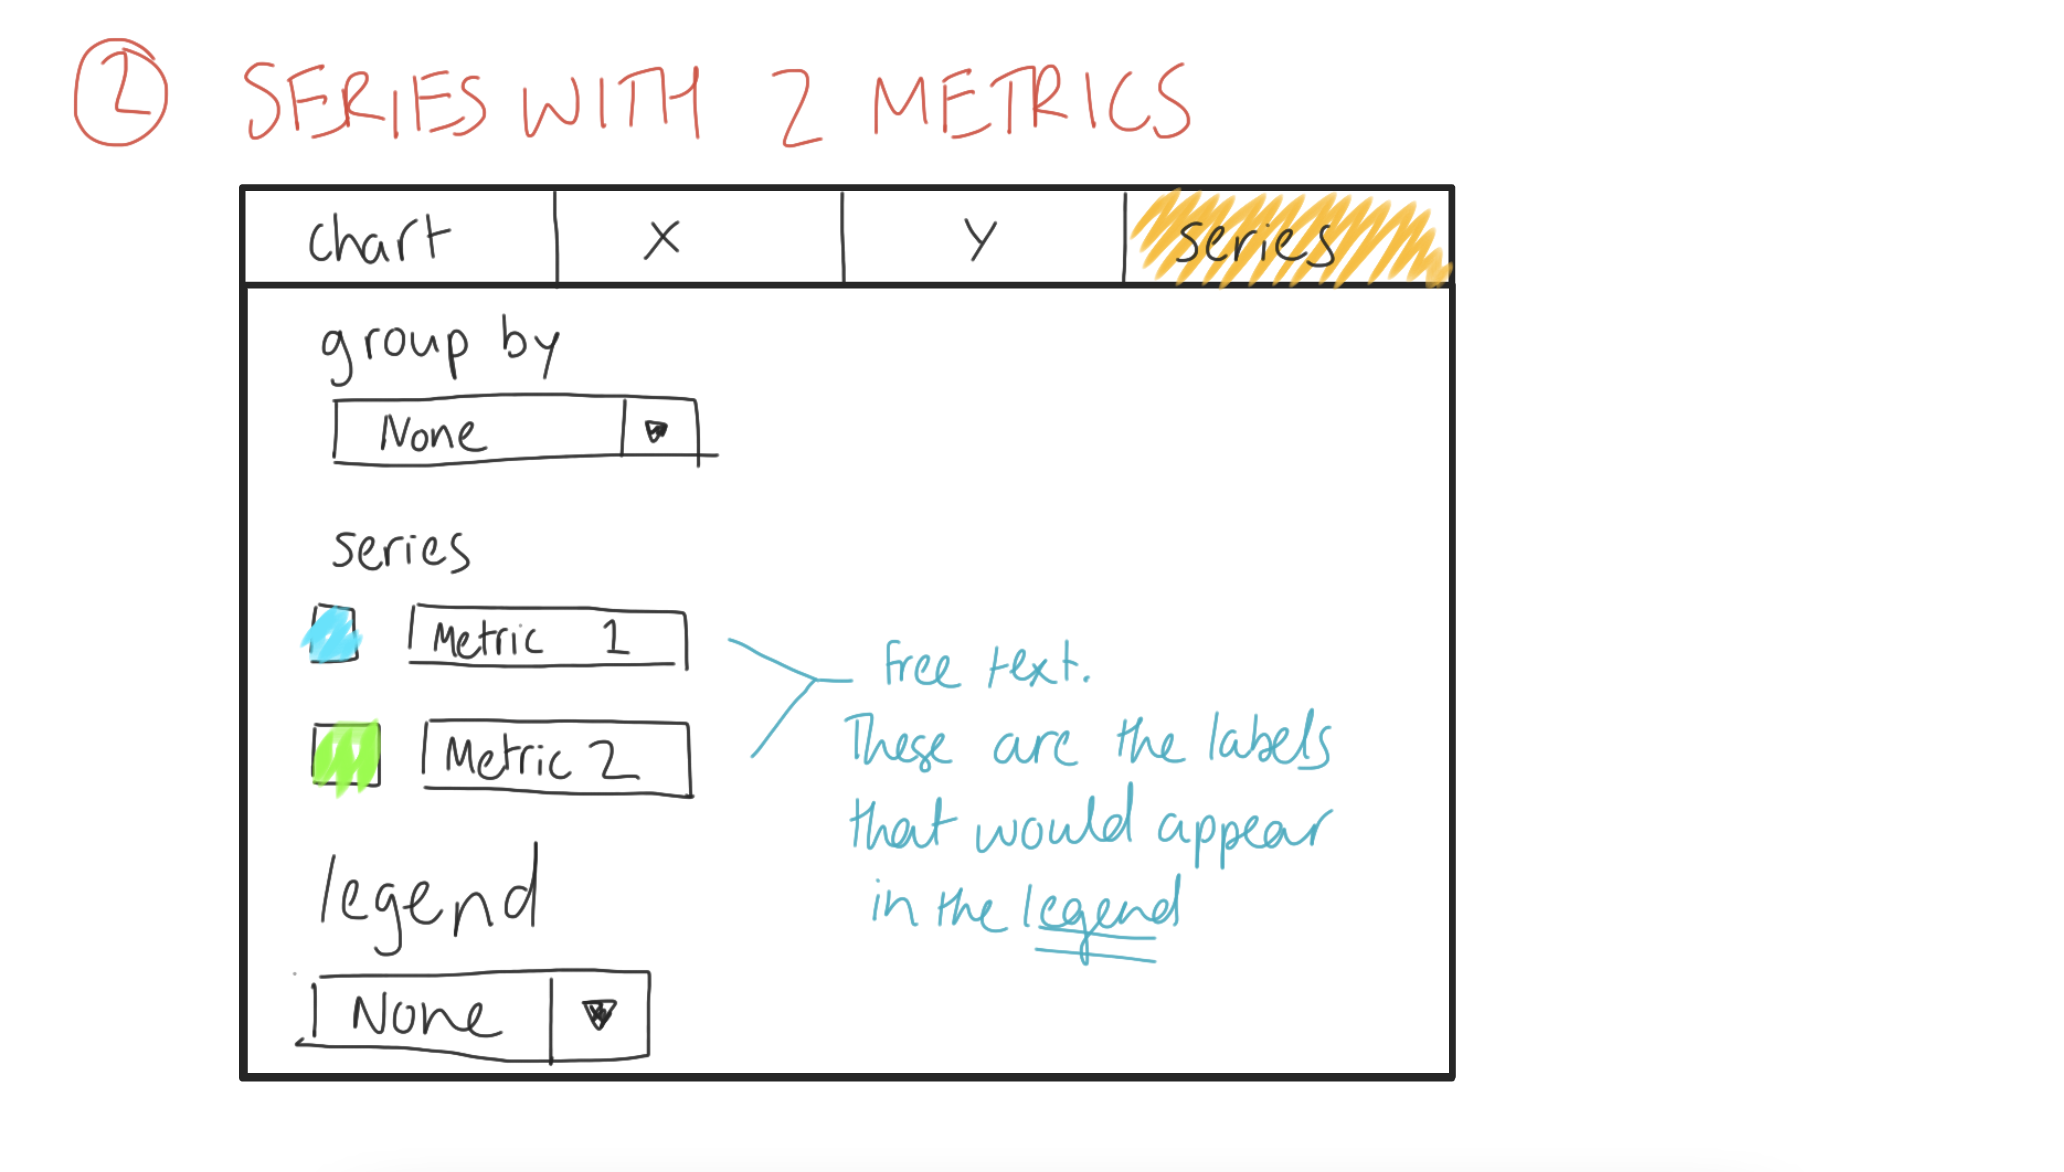
  • 📊 Comprehensive and intuitive data visualisation library for your metrics
  • 👷‍♂️ Save charts & build dashboards to share your insights with your team
  • 💻 Powerful developer experience including Preview BI Environments and automated content validation via CI/CD
  • 🔄 Explore version history of all your charts and roll-back at any point
  • 🚀 Easily share your work via URL or schedule deliveries via Slack or Email

Something missing? Check out our open issues to see if what you're looking for already exists (and give it a 👍). Otherwise, we'd love it if you'd open a new issue with your request 😊

Demo

Play with our demo app!

Quick start

Start with Lightdash Cloud

You can avoid the hassle of hosting and configuring Lightdash yourself by signing up for a free trial of Lightdash Cloud. More details on pricing available.

1-click deploy

Deploy Lightdash with 1-click on Render for free.

Run locally

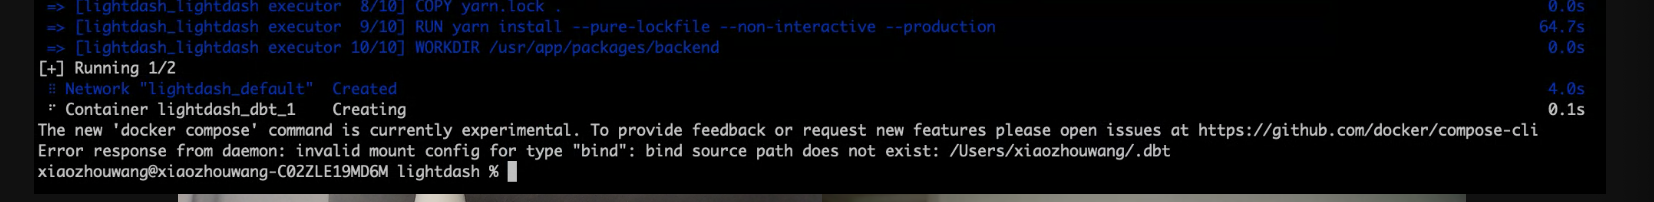
Take advantage of our installation script to easily run Lightdash locally.

git clone https://github.com/lightdash/lightdash
cd lightdash
./scripts/install.sh

Deploy to production

Follow our kubernetes guide to deploy Lightdash to production using our community helm charts.

Getting started

Step 1 - ⚡️ Self-host Lightdash (optional)

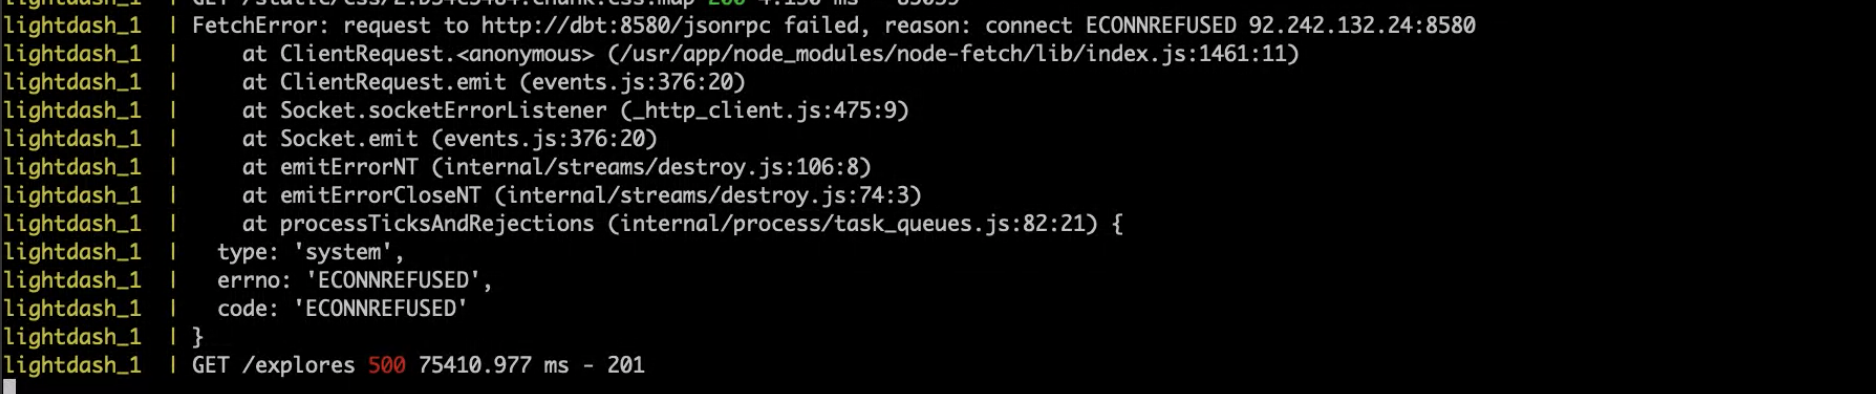
Step 2 - 🔌 Connect a project
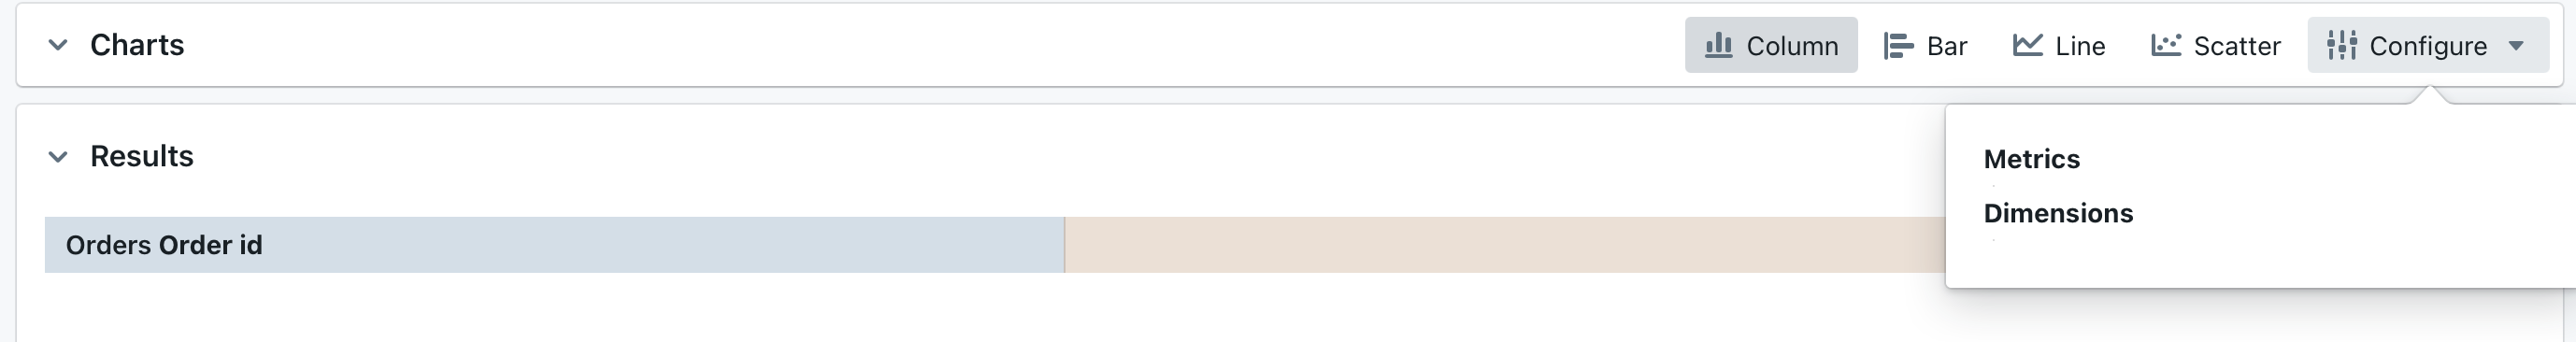
Step 3 - 👩‍💻 Create your first metric

Community Support

📣 If you want something a bit more, then head on over to our Slack Community where you’ll be able to chat directly with all of us at Lightdash and all the other amazing members of our community. We’re happy to talk about anything from feature requests, implementation details or dbt quirks to memes and SQL jokes!

You can also keep up to date with Lightdash by following us here:

About Lightdash

🗂 Keep all of your business logic in one place.

We let you define your metrics and dimensions directly in your dbt project, keeping all of your business logic in one place and increasing the context around your analytics.

No more deciding which of the four different values for total revenue is the right one (you can thank us later 😉).

🤝 Build trust in your data.

We want everyone at your company to feel like they can trust the data. So, why not show them that they can?

We bring the context you want around data quality into your BI tool so people know that they can trust the data.

🧱 Give users meaningful building blocks to answer their own data questions.

With Lightdash, you can leave the SQL to the experts. We give your data team the tools they need to build metrics and dimensions that everyone else can use.

So, anybody in the business can combine, segment, and filter these metrics and dimensions to answer their own questions.

📖 Open source, now and forever

Lightdash is built with our community, for our community.

We think that a BI tool should be affordable, configurable, and secure - and being open source lets us be all three 🙂

🤑 Affordable analytics

Love Looker, but don't love Looker's price tag?

With Lightdash, we offer a free self-hosted service (it's all just open source!), or an affordable cloud-service option if you're looking for an easy analytics set up.

Docs

Have a question about a feature? Or maybe fancy some light reading? Head on over to our Lightdash documentation to check out our tutorials, reference docs, FAQs and more.

Reporting bugs and feature requests

Want to report a bug or request a feature? Open an issue.

The Lightdash Forest

We're planting trees with the help of the Lightdash community.

Tree planting is one of the simplest and most cost-effective means of mitigating climate change, by absorbing CO2 from the atmosphere. So we thought it would be pretty neat to grow a forest while we grow Lightdash.

Want to help us grow our forest?

Just star this repo! We plant a tree for every star we get on Github. ⭐️ ➡️ 🌱

We plant trees with TIST, you can read all about them here: https://program.tist.org/.

Developing locally & Contributing

We love contributions big or small, check out our guide on how to get started.

See our instructions on developing Lightdash locally.

Contributors ✨

Thanks goes to these wonderful people (emoji key):

Rahul Jain
Rahul Jain

📖
Oliver Laslett
Oliver Laslett

💻 📖 🐛 🎨 🚇
Katie Hindson
Katie Hindson

🐛 📖 🎨 💻 🤔
Hamzah Chaudhary
Hamzah Chaudhary

📖 💻 🤔 🐛
Harry Grieve
Harry Grieve

📖
Dominik Dorfmeister
Dominik Dorfmeister

🎨
amin-nejad
amin-nejad

🐛
Mitja Potočin
Mitja Potočin

💻
Jose Rego
Jose Rego

💻 🎨 📖 🐛 ⚠️ 🚇
Rahul
Rahul

🐛 🎨 💻 📖
Jeshua Maxey
Jeshua Maxey

🐛
Sreejith Madhavan
Sreejith Madhavan

🐛
skame
skame

🐛 🎨
sgoley
sgoley

📖
djayatillake
djayatillake

🎨 💻 🤔
Mukesh
Mukesh

🔣 🐛
Andreia Freitas
Andreia Freitas

⚠️ 📖
jb
jb

💻 🐛 🎨
Amy Chen
Amy Chen

📖
John Keech
John Keech

🚇
Dr. Ernie Prabhakar
Dr. Ernie Prabhakar

🐛 🤔
PriPatel
PriPatel

🎨 🐛 🤔
NaomiJohnson
NaomiJohnson

🎨 🐛
Rich Shen
Rich Shen

💻 ⚠️ 🐛
David Gasquez
David Gasquez

🤔 🎨
xjaner
xjaner

🤔
Chris Bol
Chris Bol

🤔
Anil V
Anil V

🤔
rlebrao
rlebrao

🤔 🐛
philcarr-tsl
philcarr-tsl

🐛 🔣
HashimsGitHub
HashimsGitHub

🚇
Nathalia Buitrago Jurado

📖 💻 🐛 🎨
norbag
norbag

🐛
Shrpp
Shrpp

🐛
Cuong Vu
Cuong Vu

🐛
Takaaki Yoshikawa
Takaaki Yoshikawa

🤔
nkotlyarov
nkotlyarov

🐛
kim monzon
kim monzon

🤔
rverheijen
rverheijen

⚠️ 🐛
Spencer Carrucciu
Spencer Carrucciu

🤔
Mark Olliver
Mark Olliver

🐛
gary-beautypie
gary-beautypie

🐛
André Claudino
André Claudino

💻 🚇
Jim Park
Jim Park

🚇
gc-p
gc-p

🐛
Michał Łazowik
Michał Łazowik

💻
Chun Wei
Chun Wei

🤔
snyh-paulhenderson
snyh-paulhenderson

🤔
Frank Hoffsümmer
Frank Hoffsümmer

🐛
Sarah Moens
Sarah Moens

📖
Abhishek K M
Abhishek K M

💻
Javier Rengel Jiménez

💻 🐛 ⚠️ 🚇 📖
Fisa
Fisa

🐛
JoelAlander
JoelAlander

🐛
Chad Floyd
Chad Floyd

🤔
André Claudino
André Claudino

🤔
12ian34
12ian34

📖 🐛 💻
raphaelauv
raphaelauv

🐛 📖
BA-CY
BA-CY

🤔
John Romanski
John Romanski

🐛
Jamie Davenport
Jamie Davenport

🐛
Marcus Windmark
Marcus Windmark

🤔
Shruti Kuber
Shruti Kuber

📖
Fszta
Fszta

📖
Mohamed Muhsin
Mohamed Muhsin

💻
magants
magants

🤔
Martin Carlsson
Martin Carlsson

🤔 🐛
Tomas Čerkasas
Tomas Čerkasas

🤔
TiFaBl
TiFaBl

🤔
Eric Cecchi
Eric Cecchi

💻
KristyMayer
KristyMayer

🐛
rahulstomar08
rahulstomar08

🤔
Charles Picowski
Charles Picowski

🐛
Matt Machczynski
Matt Machczynski

🐛
Irakli Janiashvili
Irakli Janiashvili

💻 🐛 🎨 ⚠️
Gordon Lee
Gordon Lee

🤔 📖
Olly
Olly

🤔 🐛
gautamdoulani
gautamdoulani

📖
David Peitinho
David Peitinho

🐛
Istvan Meszaros
Istvan Meszaros

🤔
Rif
Rif

📖
Phillip W.
Phillip W.

🤔
XiaozhouWang85
XiaozhouWang85

🤔
Rebecca Sanjabi
Rebecca Sanjabi

🐛
Kailin L
Kailin L

🤔
Metin Karakus
Metin Karakus

💻
Yasmine
Yasmine

💻 🐛 🤔 🎨
Piotr Pilis
Piotr Pilis

💻
Judah Rand
Judah Rand

🐛
Annebelle Olminkhof
Annebelle Olminkhof

📖
Victor Apolonio
Victor Apolonio

💻
Rodolfo Ferreira
Rodolfo Ferreira

💻
Patrick Brusven
Patrick Brusven

💻
Thomas Purchas
Thomas Purchas

💻 🐛
Adrian Letchford
Adrian Letchford

🤔
Collins
Collins

💻
Paul van der Linden
Paul van der Linden

🐛
Chris
Chris

💻
Mike Thoun
Mike Thoun

💻
Leon Kozlowski
Leon Kozlowski

💻
Nathan Coleman
Nathan Coleman

💻
Nicolas Frati
Nicolas Frati

💻
Fred
Fred

📖
Victor Lindell
Victor Lindell

💻
stellar-ahmed
stellar-ahmed

🐛
Cooper Williams
Cooper Williams

💻
Lokeswaran Aruljothi

💻
João Viana
João Viana

📖 💻 🐛
Muhammad Jufry
Muhammad Jufry

🐛
Patrik Braborec
Patrik Braborec

📖 🐛
David Flanagan
David Flanagan

💻 🚇
Moulik Aggarwal
Moulik Aggarwal

💻
Chandaluri Vamsi Krishna

💻
Elton Okawa
Elton Okawa

💻
JAY ANAND
JAY ANAND

💻
Yu Ishikawa
Yu Ishikawa

💻 🤔
magnew
magnew

💻 🐛
Advith Chelikani
Advith Chelikani

🐛
Sai Pranavdhar Reddy N

💻
Ujwal Kumar
Ujwal Kumar

💻
Nimit Haria
Nimit Haria

💻
Teghan Nightengale
Teghan Nightengale

💻
David Mattia
David Mattia

📖
Ayush Trivedi
Ayush Trivedi

💻
Zoltan K.
Zoltan K.

📖
Ankush Banik
Ankush Banik

💻
Karan Handa
Karan Handa

💻
Rohit Verma
Rohit Verma

💻
David Witkowski
David Witkowski

📖
iMac
iMac

💻
Andy Kish
Andy Kish

💻
Bilal Ahmad Bhat
Bilal Ahmad Bhat

🤔 💻
Shifan Gu
Shifan Gu

🐛 💻
Daniel Reis
Daniel Reis

💻 🐛
Jogeshwar Singh
Jogeshwar Singh

💻
lancerael
lancerael

💻 🐛
Ulises Gascón
Ulises Gascón

💻
Gary James
Gary James

💻
Bruno Almeida
Bruno Almeida

💻
Filipe Dobreira
Filipe Dobreira

📖 💻
Joe Milton
Joe Milton

💻
Andras Lassu
Andras Lassu

💻
Chase Wu
Chase Wu

📖
agha4to
agha4to

💻

This project follows the all-contributors specification. Contributions of any kind welcome!

lightdash's People

Contributors

12ian34 avatar allcontributors[bot] avatar almeidabbm avatar ankush263 avatar chrischuck avatar cvamsi27 avatar dependabot[bot] avatar filp avatar hamzahc1 avatar imac7 avatar iraklijani avatar jayanand05 avatar jim80net avatar joaoviana avatar jogeshwar01 avatar la55u avatar magnew avatar muhsinkamil avatar nathaliabj avatar owlas avatar rahul3v avatar rephus avatar semantic-release-bot avatar shifan-gu avatar silentninja avatar turinglovesdeathmetal avatar ujwalkumar1995 avatar yasmin-e avatar yu-iskw avatar zerego avatar

Stargazers

 avatar  avatar  avatar  avatar  avatar  avatar  avatar  avatar  avatar  avatar  avatar  avatar  avatar  avatar  avatar  avatar  avatar  avatar  avatar  avatar  avatar  avatar  avatar  avatar  avatar  avatar  avatar  avatar  avatar  avatar  avatar  avatar  avatar  avatar  avatar  avatar  avatar  avatar  avatar  avatar  avatar  avatar  avatar  avatar  avatar  avatar  avatar  avatar  avatar  avatar  avatar  avatar  avatar  avatar  avatar  avatar  avatar  avatar  avatar  avatar  avatar  avatar  avatar  avatar  avatar  avatar  avatar  avatar  avatar  avatar  avatar  avatar  avatar  avatar  avatar  avatar  avatar  avatar  avatar  avatar  avatar  avatar  avatar  avatar  avatar  avatar  avatar  avatar  avatar  avatar  avatar  avatar  avatar  avatar  avatar  avatar  avatar  avatar  avatar  avatar

Watchers

 avatar  avatar  avatar  avatar  avatar  avatar  avatar  avatar  avatar  avatar  avatar  avatar  avatar  avatar  avatar  avatar  avatar  avatar  avatar  avatar  avatar  avatar  avatar  avatar  avatar  avatar

lightdash's Issues

Customise min and max values on chart

I'd like to be able to change the minimum and maximum value of the ticks on the chart axes.

User acceptance criteria:

  • By default, the range on the chart is: [min value, max value]
  • if you toggle off auto-range, you get the min + max values that pop up (pre-filled with the auto-range values)
  • I can set the Min + Max values for my y-axes and my x-axes
  • I can only set the Min + Max values when I have numeric types on my axes (decimal, integer, float)
  • I can set only my max or only my min value. If I only set the min value, then the max stays at the default max value, if I only set my max, then the min stays at the default min value.
  • If a value has been formatted to a %, then I would need to set min = 0.2 to get a min value at 20%. Or, if it's easier to have a min value = 20 to limit the % to 20%, then let's do it that way! Basically, don't feel like we have to add any more complexity to setting min + max values for percentages. Just use whichever of the two is easiest.

Other tasks:

  • add documentation for customizing min/max values
  • add tracking for customizing min/max values
    • added to lightdash_server_saved_chart_created + lightdash_server_saved_chart_updated (custom_axis_range as TRUE/FALSE)
    • created new event: lightdash_webapp_custom_axis_range_toggle_clicked

Internal design ticket: https://github.com/lightdash/lightdash-internal-work/issues/299

Store most recent query state in URL

As suggested by the amazing team at react query: TanStack/query#2363

Currently

The URL encodes the currently selected dimensions, metrics, filters, etc. But that is sometimes counterintuitive because you're more likely to want to share the config for the last set of successful results, rather than an in-flight config that hasn't been run yet.

Better

Changing dimensions, metrics, etc. doesn't change the URL until you hit "run query"

Add linter & prettier

We should add prettier + eslint + husky ( or another pre-commit hook ) to lint and format the code being committed.
This keeps the code consistent, catches potential bugs, prevents merge conflicts and makes it easier to review PR's.

Better unfurls when sharing a query

e.g in slack they currently look like this
Screenshot 2021-06-07 at 11 49 15

A quick win would be to use meta tags. For slack we could have something more custom to improve unfurling.

One potential challenge with this (and with share urls in general) is if the dimensions/metrics/filters contain sensitive information.

Add rudderstack to app

Let's add rudderstack analytics to the app.

Why?

  • So we can track people visiting the demo app https://demo.lightdash.com
  • Teams can add their own rudderstack API key and track their usage on their own deployment
  • Finally, we will have an opt-in for users to contribute their usage to our analytics. Perhaps we can make this a kind of contribution to the project?

What do you think?

All metrics should be compiled on server start

On server start, dbt runs an initial compile but we wait for the first request before compiling the metrics.

It would be better to compile on server start, so production deployments don't need to refresh. This would reduce cold starts on zero downtime deployments too

Catch invalid dimension references in config

If a dimension is declared with custom sql: then it can reference other dimensions. These references may not be valid and currently that throws an error at query time.

We can catch these earlier during compilation of all metrics.

How to deploy to production?

We don't have docs showing users how to deploy to a production environment.

Create an example repo and some docs pages

Error with multiple joins

Get error message "unexpected keyword LEFT" when running a query in the UI

I have a model specifying two joins with the jaffle_shop demo. When I remove either of the two joins it works.

Localhost Database inaccessible

My DBT project accesses the database from localhost. The database itself is remote but the connection is tunnelled to localhost:5433 as it can only be accessed using a VPN from a particular host. Anyway, all this to say that if your ~/.dbt/profiles.yml host key has localhost as a value, then you get an error like the below after it tries and fails to access the database for some time:

DbtError: Error returned from dbt while executing method 'poll': Database Error
  could not connect to server: Connection refused
  	Is the server running on host "localhost" (127.0.0.1) and accepting
  	TCP/IP connections on port 5433?
  could not connect to server: Cannot assign requested address
  	Is the server running on host "localhost" (::1) and accepting
  	TCP/IP connections on port 5433?

I use a mac and I can bypass this by changing localhost to host.docker.internal if running Docker 18.03 or later but it would be nice if there was a better solution that didn't require me changing this. Also not sure what non-mac users need to do in order to access localhost from within the container. This should be mentioned in your docs as it seems you are assuming everyone's database is remote. My particular case is probably niche but many may be using a local database for dev purposes

Option to add/remove data in visualization

When you have a bunch of dimensions + measures in your table, you should be able to remove/add them to the visualization (in case you don't want all of them)

Two ways of doing this:

  1. we put an 👁️ icon beside the names of the columns. If you click on the eye, it would add a / over the eye and remove it from the visualization. You can then click on the crossed-out eye to make it re-appear in the visualization.

  2. We can add a gear symbol beside the name of the column. This could become the settings space for columns (e.g. you could say add filter or sort, etc. within this space eventually). If you click on the gear, there would be a drop-down menu that would let you select hide from chart (or show in chart)

image

dbt cloud support

We should have support for dbt cloud.

There are two components to how Lightdash relies on a dbt project:

  1. The manifest.json and catalog.json - these are available from dbt cloud and have all the info we need
  2. The raw project files. We plan to use this when the user is locally developing to detect changes on disk, and to map Lightdash syntax errors back to source files.

We should be able to support dbt cloud for production use cases, but will be harder for us to provide the "development" type features.

Also we currently don't have a nice way in the UI to distinguish between using "files" as the backend vs "dbt cloud". we might also add "GitHub" here. These are basically different source locations, each with their own features that they support in the UI. Could spiral quickly.

A quick hack would be to take dbt cloud credentials as an environment variable.

Add second y-axis for multi metrics

When plotting multiple series, you should be able to assign them to separate axes.

Blocked by #1565

What does this look like?

Update the series tab in the chart configuration to give the option to map the series to the left or right axis (for horizontal charts this should be the top or bottom axis)

The axis label tab will need an additional entry too.

IMG_7613

Screenshot 2022-03-22 at 14 27 08

Screenshot 2022-03-22 at 14 27 52

Installation guide link broken

Installation guide link:

Demos are fun and all, but to get the full Lightdash experience, we recommend working through our installation guide and hooking it up to your own project 😊

Returns a 404

Cannot find credentials file for BigQuery method: service-account

Summary:
When using BigQuery service-account method [0] the app throws an error because it cannot find the credentials file.

Screenshot 2021-06-18 at 16 57 31

Reproduction steps:
Precondition: dbt project with a profile using BigQuery service-account method
Run lightdash (via docker)

# Go to your project
cd /path/to/my/dbt/project

export DBT_PROJECT_DIR=${PWD}
export DBT_PROFILES_DIR=${HOME}/.dbt
export LIGHTDASH_PORT=8080

docker run -p "${LIGHTDASH_PORT}:8080" -v "${DBT_PROJECT_DIR}:/usr/app/dbt" -v "${DBT_PROFILES_DIR}:/usr/app/profiles" lightdash/lightdash

[0] https://docs.getdbt.com/reference/warehouse-profiles/bigquery-profile#service-account-file

dbt connection timeout if gcloud config is missing

If using a bigquery profile and method: oauth (relying on gcloud sdk authentication) and lightdash is run without having a ~/.config/gcloud directory available, then dbt is polled infinitely and eventually errors on timeout

Deploying on cloud run

A request was made for cloud run but I don't think Lightdash is well built for server less yet.

Should test this

Make charts downloadable

It would be great if I could export a chart as a .png etc for external presentation.

This is built into ECharts

A metric can be defined using free-text SQL

Currently, metrics are limited to using one of the (predefined types we have available)[https://docsite.onrender.com/references/metrics#metric-types].

For us to be able to do more complex aggregations (and not have a bajillion pre-defined metric types), users should be able to write custom SQL aggregations to define metrics.

E.g. you'd be able to build the metric for 7d rolling average number of weekly active users

Error: Could not find adapter type sqlserver

Docker Desktop on Windows 10.
dbt project and profile.yml working.

Running
docker run -p "8080" -v "C:\projects\myproject" -v "C:\Users\myuser.dbt" lightdash/lightdash

(after downloading docker images) gives the result:

_yarn run v1.22.5
$ node dist/index.js
| | | | | | |
| | | | | | |
| | | | | | |
\ | / \ | / \ | / \ | / \ | / \ | / \ | /
|/ |/ |/ |/ |/ |/ |/

Launch lightdash at http://localhost:8080

/|\ /|\ /|\ /|\ /|\ /|\ /|
/ | \ / | \ / | \ / | \ / | \ / | \ / |
| | | | | | |
| | | | | | |
| | | | | | |
(node:28) UnhandledPromiseRejectionWarning: Error: spawn dbt ENOENT
at Process.ChildProcess.handle.onexit (internal/child_process.js:269:19)
at onErrorNT (internal/child_process.js:467:16)
at processTicksAndRejections (internal/process/task_queues.js:82:21)
(Use node --trace-warnings ... to show where the warning was created)
(node:28) UnhandledPromiseRejectionWarning: Unhandled promise rejection. This error originated either by throwing inside of an async function without a catch block, or by rejecting a promise which was not handled with .catch(). To terminate the node process on unhandled promise rejection, use the CLI flag --unhandled-rejections=strict (see https://nodejs.org/api/cli.html#cli_unhandled_rejections_mode). (rejection id: 2)
(node:28) [DEP0018] DeprecationWarning: Unhandled promise rejections are deprecated. In the future, promise rejections that are not handled will terminate the Node.js process with a non-zero exit code.

and browsing to localhost:8080 says "This site can’t be reached"

Are there issues with running this on Windows?

Side bar fixed at 100vh in UI

When the main content overflows 100vh, the UI becomes scrollable but the sidebar stays at a fixed height.

I'm not sure whether we want the entire UI rendered within 100vh or to make it infinitely scrollable. Either way, the current implementation is inconsistent.

Screenshot 2021-06-20 at 13 12 48

Improve error messages when dbt is running, but it fails

When dbt’s running but it’s failed, it’s not obvious what the problem is. We need to improve these error messages.

The current error message looks something like this:

GET /api/v1/tables 500 283.331 ms - 634
(node:29) UnhandledPromiseRejectionWarning: DbtError: Error returned from dbt while executing method 'status'
    at /usr/app/packages/backend/dist/dbt.js:124:15
    at Generator.next (<anonymous>)
    at fulfilled (/usr/app/packages/backend/dist/dbt.js:5:58)
    at processTicksAndRejections (internal/process/task_queues.js:95:5)

Instead of just having this DbtError: Error returned from dbt while executing method 'status', we should have a bit that says ...and this is why it failed after it.

Add chart settings space

If you have more than one dimension + one measure in your table, you should be able to pick which things you want to have as the x, y and series.

image

image
image
image
image

Handle errors when dbt repo or profile can't be found

Currently this happens on the backend:

Error: spawn dbt ENOENT
    at Process.ChildProcess._handle.onexit (node:internal/child_process:282:19)
    at onErrorNT (node:internal/child_process:480:16)
    at processTicksAndRejections (node:internal/process/task_queues:81:21)

remove rudderstack config from source

Rudderstack is default configured in the docs minisite - but this should only be set on deployment.

This will allow:

  • no default rudderstack for people running the docs site themselves
  • users to configure their own rudderstack endpoint if they wanted

A metric (with one of the existing types) can be built from other metrics

Right now, we can only build metrics from dimensions. This limits the types of metrics that you can build/the things you can calculate in lightdash.

  • We should be able to define a metric with one of the existing types using other metrics and dimensions.
  • These other metrics come from the current model, or any metrics in a joined model

I'd imagine it would look something like this in the .yml file:

    columns:
      - name: user_id
        description: 'Unique identifier for a user.'
        tests:
          - unique
          - not_null
        meta:
          metrics:
            num_unique_users:
              type: count_distinct
            num_unique_7d_web_active_users:
              type: count_distinct
              sql: "IF(${is_7d_web_active}, ${user_id}, NULL)"
            num_unique_non_7d_web_active_users:
              type: sum
              sql: "${num_unique_users} - ${num_unique_7d_web_active_users}" # both are metrics coming from the base model
     - name: is_7d_web_active
        meta:
          metrics:
            avg_spend_per_7d_web_active_user:
              type: mean
              sql: "IF(${is_7d_web_active}, ${transactions.total_spend}, NULL" # this is an example where the transactions.total_spend is a metric that is coming from a joined model: transactions. 

Support SSO/SAML authentication and fine-grain ACL

Motivation

We use Google Cloud, BigQuery and dbt. We are looking for a better dbt-friendly BI tool. I love the idea of lightdash. So, if we want to practically use lightdash as a production-grade system, authentication and permission control is necessary. It would be great to support SSO/SAML authentication and fine-grain ACL.

Recommend Projects

  • React photo React

    A declarative, efficient, and flexible JavaScript library for building user interfaces.

  • Vue.js photo Vue.js

    🖖 Vue.js is a progressive, incrementally-adoptable JavaScript framework for building UI on the web.

  • Typescript photo Typescript

    TypeScript is a superset of JavaScript that compiles to clean JavaScript output.

  • TensorFlow photo TensorFlow

    An Open Source Machine Learning Framework for Everyone

  • Django photo Django

    The Web framework for perfectionists with deadlines.

  • D3 photo D3

    Bring data to life with SVG, Canvas and HTML. 📊📈🎉

Recommend Topics

  • javascript

    JavaScript (JS) is a lightweight interpreted programming language with first-class functions.

  • web

    Some thing interesting about web. New door for the world.

  • server

    A server is a program made to process requests and deliver data to clients.

  • Machine learning

    Machine learning is a way of modeling and interpreting data that allows a piece of software to respond intelligently.

  • Game

    Some thing interesting about game, make everyone happy.

Recommend Org

  • Facebook photo Facebook

    We are working to build community through open source technology. NB: members must have two-factor auth.

  • Microsoft photo Microsoft

    Open source projects and samples from Microsoft.

  • Google photo Google

    Google ❤️ Open Source for everyone.

  • D3 photo D3

    Data-Driven Documents codes.