Can we accurately forecast travel demand based on historical Grab bookings to predict areas and times with high travel demand?
I wasn't sure whether the test dataset could be used for generated the predictions by training the model, hence I uploaded backup models just in case.
Main Files:
GenerateFeatures.ipynb- builds features from source datatraining.ipynb- train necessary models (If allowed)PrepareNextFewPredictions.ipynb- Creates T+1 to T+5 predictionsGeneratePredictionT.py- Creates predictions for T+1GenerateFeatures.py- script for generating features in the process.submission.csv- final output
Other Files:
StaticValues- Static values for mapping of features that are generated previouslyScaler- scaler is generated during training to prevent data leakage
Please ensure the following Python packages are installed before running the codes from Jupyter Notebook
*pandas
*numpy
*matplotlib.pyplot
*random
*pickle
*xgboost
*sklearn
Run GenerateFeatures.ipynb to generate features from the test set. Change training.csv to what the test csv is called
Run training.ipynb to train models from the features. (Training took around 10-15 minutes using 16core aws instance during test of 14 days data)
Run PrepareNextFewPredictions.ipynb to generate T+1 to T+5 predictions. Uses prediction of T+1 as features for T+2
I had spent most of the time coming up with features and testing the effectiveness of it.
- Longitude, latitude
- X,Y,Z coordinates
- Total Distance from everywhere - finding places far from everyone
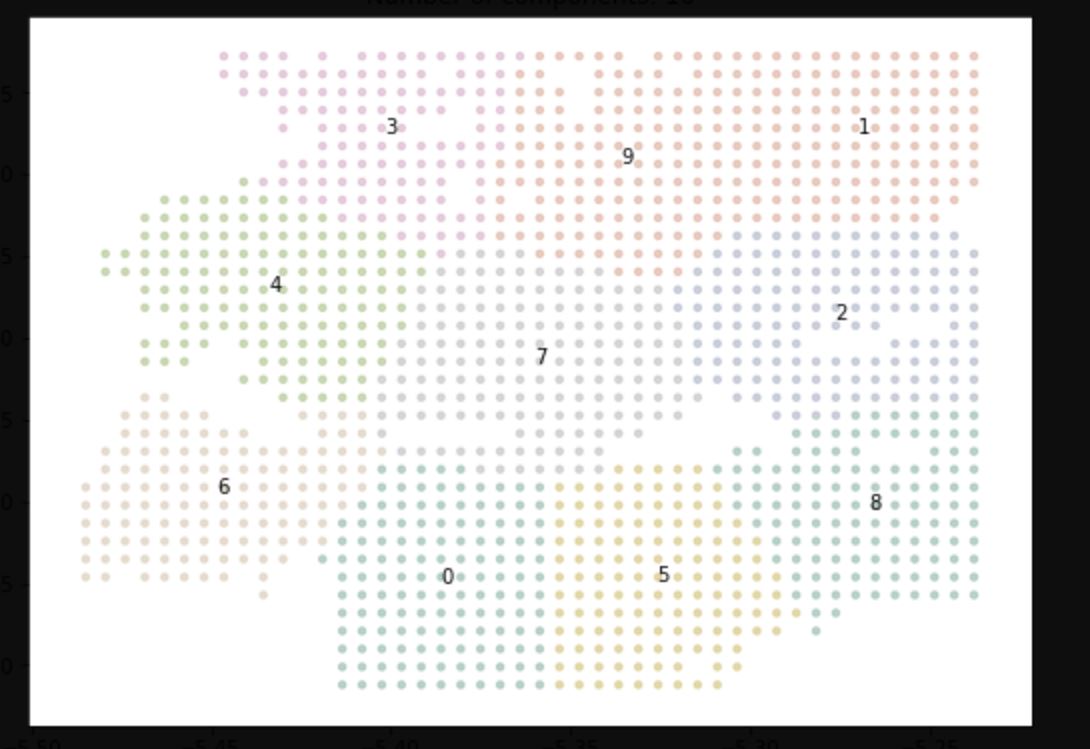
- Zones - Cluster the geohashes into 10 zones and reordered from highest demand to lowest
- Distance to high demand 5 - Distance to highest demand zone
- Distance to high demand 7 - Distance to second highest demand zone
- Hour and Minutes
- Sin and cos Hour
- Lagged demand (T-1 to T-7)
- Day of Week
- Peak Hours
- Split into cluster zones by demand with Kmeans
- Split into geohash4 and geohash5 zones
- Moving averages
- Exponential Moving averages
- Moving median
- Variance
- Standard Deviation
- Min
- Max
- High demand percentage for geohash
- last week's demand at same time
- Nearest neighbours
- Duration of high demand
- Log scale distance
- Validation done on training dataset. Did a 4 fold validation using 14 days of data and testing on next day.
- Xgboost:6 xgboost models trained in rolling window fashion from 14 days
- Xgboost(backup) 5 xgboost models trained from 4 week rolling windows from 60 days dataset
- Model hyperparameters were manually adjusted.
- Tried an ensemble with KNNRegressor and Stacked LSTM but results wasn't so good
- Tried adding models trained using a specific day of week only, applied bagging and used it to predict the day of week, did not improve results significantly
Many thanks to grab and sponsor AWS for providing credits. I am truly grateful for the opportunity to work on this challenge as I have learnt alot from it. My laptop crashed a day before submission and I had to rewrite most of the code so I was thankful for the cloud credits available for me to continue my work. Some of the code that generated the static values might not be there as I am unable to recover it from my laptop yet, but it can be provided upon request.

