Time series charting library based on d3.js
npm install d3-timeseries --save
Time series charting library based on d3.js
Time series charting library based on d3.js
npm install d3-timeseries --save


How would I go about binding a function on mouseclick event in the chart area (that could pass the date on that position)?
Dear Author,
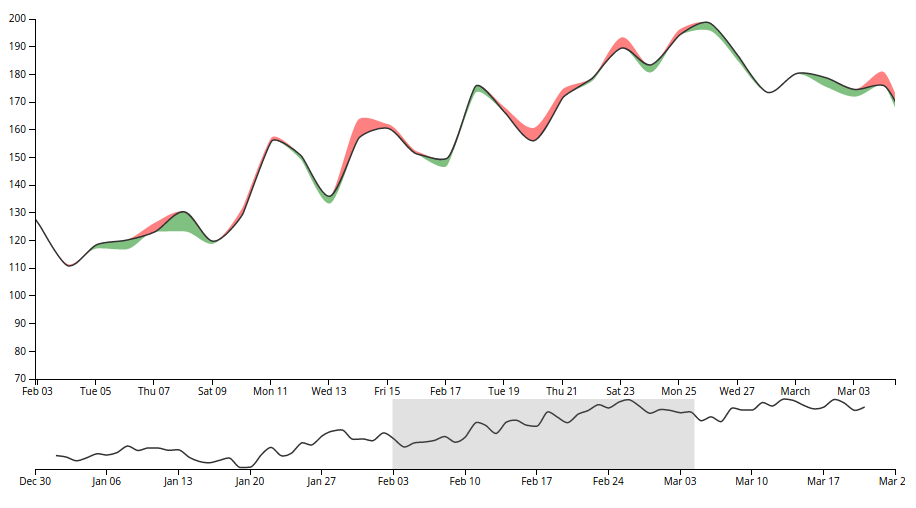
In your first example shown `
| // [{date:new Date('2013-01-01'),n:120,n3:200},...]
| var chart = d3.timeseries()
| .addSerie(data,{x:'date',y:'n',diff:'n3'},{interpolate:'monotone',color:"#333"})
| .width(900)
|
| chart('#chart')
`
I am wondering how do you define "#chart" in your examples. I did not find it in your source code.
Thanks a lot for your help! Much appreciated!
Best,
Tingting
Hello, If i use a new version of d3, then things break. specifically in d3_timeseries.js, things like scale.linear dont work. could you update to work with the new version of d3?
Hello Mcaule
Can you tell me how to set the resize y Axis when select a new time?
Or, if you have the time, can you add that feature?
Thanks!
node.js doesn't support ES2016 import/exports, and so I'm running in to errors... I tried using webpack/babel, but it'll take a while to figure these tools out and make it work...
any suggestions as to how I might get it to work with my current set-up?
also, i'm trying to pass data to it from server-side, can i just pass it with EJS?, e.g.:
app.get('/', (req, res) => {
  function().then((data) => {
    res.render('home', {data: data});
  })
})
then
<html>
   <head>
     <script>
       var chart = d3_timeseries()
                     .addSerie(<%= data %>,{x:'date',y:'value',diff:'currency_in'},
                     {interpolate:'monotone',color:"#333"})
                     .width(820)
       chart('#chart')
     </script>
   </head>
<body>
  <div id="chart"></div>
</body>
</html>
is it possible to render a chart as canvas instead of svg?
i asume that large timseries/dats sets will not work with a svg rendering
Specified legend label doesn't appear.
let chart1 = d3_timeseries()
.addSerie(b1Items, {
x: 'date',
y: 'signalStrength',
}, {interpolate: 'monotone', label:"B1 Signal Strength"})
I'm a bit stuck with featuring different visualizations on a dashboard I'm making. Some features rely on d3v3 and your latest version of d3-timeseries relies on d3v4...
I'm trying to get an older version of your git repo working (when it was still d3v3) but this doesn't seem to work... Is the sample code so much different when using commit 985d107? when I load the given JS file it doesn't recognise d3_timeseries in the statement chart = d3_timeseries();
I thought that maybe I had to "build" the JS file with the given bower.json.
As you probably figured, I'm not a routined frontend developer at all, so this is a bit confusing.
Any hints on how to get the older version working? Do I call a different function?
I'm trying to include the time in the tooltip with
xscale.tickFormat(d3.timeFormat("%e %b %-I:%M %p"))
but it allways print 0 as hour
I'm looking for assistance in understanding the tooltip display.
Problem: I only see the minimal date text in the tooltip, instead of the additional label and coloring.

This bit of code is why
serie.find = function (date) {
    var bisect = d3.bisector(fk(aes.x)).left;
    var i = bisect(serie.data, date) - 1
    if (i == -1)
        return null
    //look to far after serie is defined
    if (i == serie.data.length - 1 && serie.data.length > 1 &&
        Number(date) - Number(serie.data[i][aes.x]) > Number(serie.data[i][aes.x]) - Number(serie.data[i - 1][aes.x]))
        return null /******** this is always returned *************/
    return serie.data[i]
}
Data looks like this
[{query_type: "jobset", count: 100, created: 1488393368058}]
Chart config:
var chart = d3.timeseries()
        .addSerie(
        data,
        { x: 'created', y: ofX },
        { interpolate: 'linear', width: 3 }
        )
        .margin.left(65)
        .width(650)
Any ideas greatly appreciated!
A declarative, efficient, and flexible JavaScript library for building user interfaces.
🖖 Vue.js is a progressive, incrementally-adoptable JavaScript framework for building UI on the web.
TypeScript is a superset of JavaScript that compiles to clean JavaScript output.
An Open Source Machine Learning Framework for Everyone
The Web framework for perfectionists with deadlines.
A PHP framework for web artisans
Bring data to life with SVG, Canvas and HTML. 📊📈🎉
JavaScript (JS) is a lightweight interpreted programming language with first-class functions.
Some thing interesting about web. New door for the world.
A server is a program made to process requests and deliver data to clients.
Machine learning is a way of modeling and interpreting data that allows a piece of software to respond intelligently.
Some thing interesting about visualization, use data art
Some thing interesting about game, make everyone happy.
We are working to build community through open source technology. NB: members must have two-factor auth.
Open source projects and samples from Microsoft.
Google ❤️ Open Source for everyone.
Alibaba Open Source for everyone
Data-Driven Documents codes.
China tencent open source team.