Giter VIP home page Giter VIP logo

vscode-js-debug-companion's Introduction

js-debug-companion

A companion extension to js-debug to enable remote Chrome debugging. You probably don't want to install this extension by itself, but for your interest, this is what it does.

The scenario is if you are developing in a remote environment—like WSL, a container, ssh, or VS Codespaces—and are port-forwarding a server to develop (and debug) in a browser locally. For remote development, VS Code runs two sets of extensions: one on the remote machine, and one on your local computer. js-debug is a "workspace" extension that runs on the remote machine, but we need to launch and talk to Chrome locally.

That's where this companion extension comes in. This helper extension runs on the local machine (in the "UI") and registers a command that js-debug can call to launch a server. js-debug requests a port to be forwarded for debug traffic, and once launching a browser the companion will connect to and forward traffic over that socket.

vscode-js-debug-companion's People

Contributors

andreamah avatar connor4312 avatar dependabot[bot] avatar kimadeline avatar lszomoru avatar rzhao271 avatar sandy081 avatar sbatten avatar

Stargazers

 avatar  avatar  avatar  avatar  avatar  avatar  avatar

Watchers

 avatar  avatar  avatar  avatar  avatar  avatar  avatar  avatar  avatar  avatar  avatar  avatar  avatar  avatar  avatar  avatar  avatar

vscode-js-debug-companion's Issues

Support virtual workspaces

👋 Hi there, Martin here, from the VS Code team.

Recently we've announced the Remote Repository feature that lets you browse and edit files and folders directly on GitHub.

Open Remote Repository... opens VSCode on a folder or workspace located on a virtual file system. We call this a virtual workspace. We observed that not all extension support this well, either because they can not, or they haven't thought about it.

It would be fantastic if you could test whether your extension can handle virtual workspaces:

Check out the Virtual Workspaces Extension Author Guide on how to do that.

When done, set the new virtualWorkspaces capability in your 'package.json'.

{
  "capabilities": {
    "virtualWorkspaces": true | false
  }
}
  • Use "virtualWorkspaces": true if your extension is prepared for virtual workspaces
  • Use "virtualWorkspaces": false if your extension should be disabled when a virtual workspace is opened

For questions and comments please use the Virtual Workspaces Tracking Issue.

Thanks for the support and the great work! ❤️

Support Workspace Trust

Hello 👋 I'm from the VS Code team.

Recently, we have been exploring a security feature we refer to as Workspace Trust. This feature is intended to centralize and unify a security conscious decision required by a variety of VS Code features. With workspace trust, the user will be able to declare whether or not they trust the folder that is opened in VS Code before these features are executed.

Why you should care

Your extension is incredibly popular with VS Code users! We want to make sure that those users have a delightful experience with workspace trust and that includes extension authors deciding how much of their extension is supported in an untrusted workspace.

Workspace Trust experience

You can enable the feature with the following setting security.workspace.trust.enabled. Once enabled, you will see the following dialog when opening folders in VS Code.
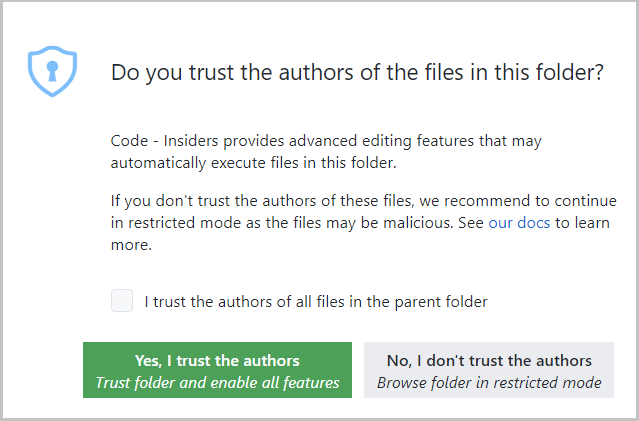
Workspace Trust Startup Dialog

This dialog is important for allowing the user to make a decision early and understand the impact of their decision. Once you understand the feature, you may want to customize when to display the dialog using the setting security.workspace.trust.startupPrompt.

You can follow the development of Workspace Trust and provide feedback in issue #106488.

Workspace trust API

First off, all of what I am about to say can be found in issue #120251. That issue will include discussion of the feature and any updates to the feature.

The Workspace Trust extension API is now in stable. This allowed us to release the first cut of our guide for onboarding your extension to Workspace Trust. The API is small, so here is a quick look.

You can declare your extension to provide complete, partial or no support in untrusted workspaces using the untrustedWorkspaces capability in package.json.

The following example declares that the extension is supported completely in untrusted workspaces. In this case, the extension is enabled in untrusted workspaces.

"capabilities": {
  "untrustedWorkspaces": {
    "supported": true
  }
}

The next example declares that the extension is not supported in untrusted workspaces. In this case, the extension is disabled in untrusted workspaces.

"capabilities": {
  "untrustedWorkspaces": {
    "supported": false
  }
}

The third option is to declared limited support. There are three tools provided to you when you select the limited option.

First, if you have a setting that can be configured in the workspace but requires the workspace to be trusted in order to apply the workspace value, then you can include the setting using restrictedConfigurations array property in untrustedWorkspaces object. Doing so, VS Code will ignore the workspace value of these restricted settings when your extension reads these settings values using the VS Code Workspace Configuration API.

The following example declares the settings that are restricted in untrusted workspaces.

"capabilities": {
  "untrustedWorkspaces": {
    "supported": "limited",
    "restrictedConfigurations": [
      "markdown.styles"
    ]
  }
}

Next, you can also check and listen if the current workspace is trusted or not programmatically using the following API:

export namespace workspace {
  /**
   * When true, the user has explicitly trusted the contents of the workspace.
   */
  export const isTrusted: boolean;
  /**
   * Event that fires when the current workspace has been trusted.
   */
  export const onDidGrantWorkspaceTrust: Event<void>;
}

Lastly, you can hide commands or views declaratively with the isWorkspaceTrusted context key in your when clauses.

A far more detailed guide on how to onboard which will be updated as we receive feedback can be found in issue #120251.

Rollout plan

Workspace Trust will remain disabled for the month of May, but we are planning on enabling this by default in the future. To prepare for that day, we would love for you to try it out and provide feedback.

We'd love your feedback

Since this issue was created in an automated fashion, we won't be monitoring the responses in this issue (our notifications would explode!). Instead we ask you to drop questions, and feedback in issue #120251 as we've mentioned above.

We're excited to see what you do with workspace trust!

Evaluate launch.json variables on the thin client side

I'm not exactly sure if this is where this should happen, but I like to keep a single Chrome profile for all debugging so I can have my react devtools installed. I've currently got my userDataDir set to
"userDataDir": "C:\\Users\\mcoomber\\chrome-vscode-debug",
which works great, but I'd love for it to be user agnostic so if another dev comes along to the project it will create a Chrome data dir in the right place. As such, I've tried setting it to
"userDataDir": "${env:HOMEDRIVE}${env:HOMEPATH}\\chrome-vscode-debug", which works fine as long as I'm not developing over remote ssh. Is there any way that this side of the chrome debugger can evaluate the environment variables rather than the remote client?

Google Chrome cannot read and write to the data directory: [object Promise]

My existing launch configuration suddenly started launching Chrome with flag --user-data-dir=[object Promise], resulting in Chrome showing a dialog at launch with message "Google Chrome cannot read and write to the data directory: [object Promise]", which I've now traced to this change.

Here's my launch config:

{
    "name": "Test with Chrome",
    "type": "pwa-chrome",
    "request": "launch",
    "browserLaunchLocation": "ui",
    "url": "http://localhost:8080"
}

connect ECONNREFUSED 127.0.0.1

Started receiving this error yesterday. Was working fine before this. I have tried to check if I can do javascript debugging from either chrome or edge and both give me this error now.

image

I'm current running Windows 10 64bit on AMD. VS Code and WSL 2 instance of Ubuntu. I reset my entire operating system (Win 10) and started from scratch and was still receiving this error. Regardless of if I attach or launch with either chrome/edge it gives me this error. On launch it will just close down the browser automatically.

after 10 seconds VS code will give the timed out waiting for browser connection error.
image

I have tried restarting, resetting the pc, etc. The chrome debugger configuration is correctly set to --remote-debugging-port=9222 with my launch.json
{ "type": "chrome", "request": "attach", "name": "Attach to Chrome", "url": "http://localhost:1337", "port": 9222, "webRoot": "${workspaceFolder}" }

I even upgraded to insider builds beta channel to see if possibly there was something that broke.

Missing Icon for RUN

Issue Type: Bug

missing icon:
image

Extension version: 1.0.2
VS Code version: Code - Insiders 1.46.0-insider (1d268b701376470bc638100fbe17d283404ac559, 2020-05-28T08:45:32.560Z)
OS version: Darwin x64 19.5.0

System Info
Item Value
CPUs Intel(R) Core(TM) i7-4770HQ CPU @ 2.20GHz (8 x 2200)
GPU Status 2d_canvas: enabled
flash_3d: enabled
flash_stage3d: enabled
flash_stage3d_baseline: enabled
gpu_compositing: enabled
metal: disabled_off
multiple_raster_threads: enabled_on
oop_rasterization: disabled_off
protected_video_decode: unavailable_off
rasterization: enabled
skia_renderer: disabled_off_ok
video_decode: enabled
viz_display_compositor: enabled_on
viz_hit_test_surface_layer: disabled_off_ok
webgl: enabled
webgl2: enabled
Load (avg) 14, 5, 4
Memory (System) 16.00GB (2.56GB free)
Process Argv -psn_0_794818
Screen Reader no
VM 0%

Recommend Projects

  • React photo React

    A declarative, efficient, and flexible JavaScript library for building user interfaces.

  • Vue.js photo Vue.js

    🖖 Vue.js is a progressive, incrementally-adoptable JavaScript framework for building UI on the web.

  • Typescript photo Typescript

    TypeScript is a superset of JavaScript that compiles to clean JavaScript output.

  • TensorFlow photo TensorFlow

    An Open Source Machine Learning Framework for Everyone

  • Django photo Django

    The Web framework for perfectionists with deadlines.

  • D3 photo D3

    Bring data to life with SVG, Canvas and HTML. 📊📈🎉

Recommend Topics

  • javascript

    JavaScript (JS) is a lightweight interpreted programming language with first-class functions.

  • web

    Some thing interesting about web. New door for the world.

  • server

    A server is a program made to process requests and deliver data to clients.

  • Machine learning

    Machine learning is a way of modeling and interpreting data that allows a piece of software to respond intelligently.

  • Game

    Some thing interesting about game, make everyone happy.

Recommend Org

  • Facebook photo Facebook

    We are working to build community through open source technology. NB: members must have two-factor auth.

  • Microsoft photo Microsoft

    Open source projects and samples from Microsoft.

  • Google photo Google

    Google ❤️ Open Source for everyone.

  • D3 photo D3

    Data-Driven Documents codes.