Comments (19)
This is the definition: https://chromedevtools.github.io/devtools-protocol/tot/Profiler/#type-Profile
from vscode-js-profile-visualizer.
or a given ProfileNode, should callFrame.lineNumber and callFrame.columnNumber refer to the location of the function definition itself, right?
Yep
with positionTicks, is the idea that if I have a ProfileNode, and say that node appears n times in the samples array, then this node can have a number of elements in positionTicks, and the sum of the ticks for the entire ProfileNode should equal n?
I'm not sure actually, though that would make sense
from vscode-js-profile-visualizer.
It looks like there's a cycle in the profile you posted -- call frame 15 has frame 16 as a child, and 16 has 15 as a child.
Do I need to collapse these sequence onto each other so that they form trees?
There should be a unique node per call stack which led up to it. For instance if I make a call from foo() -> bar() -> baz() and then from oof() -> bar() -> baz(), you should end up with 6 unique nodes (with 4 unique call frames). However, if I call foo() -> bar() -> baz() and baz also calls oof (foo() -> bar() -> oof()), there should be only be four different nodes since the foo() -> bar() prefix is the same.
from vscode-js-profile-visualizer.
Nice! I don't think time difference is your fault, I noticed there was different for JS profiles vesus Chrome and correcting that has been on my todo for a little while. Super cool to see it working for you!
from vscode-js-profile-visualizer.
Nice!
Also, table is fixed in microsoft/vscode-js-debug#561 so I'll go ahead and close this issue.
Great work with the extension 🙂
from vscode-js-profile-visualizer.
It could. Right now this is still a bit of an exploration.
Soon (this month or next month) I'll be adding support for the other types of profiles that can be taken from JavaScript targets (microsoft/vscode-js-debug#435). We'll become more generic at that point, which could open the door for visualizing other types of profiles. Or you could generate .cpuprofiles yourself--the format is fairly simple, happy to answer questions if you have any.
from vscode-js-profile-visualizer.
Yeah, I thought that we could just generate .cpuprofiles that seems the easiest option. I did google around a bit and found some info on the format, but nothing authorative. Do you have a link with a spec? Or just some good starting point to understand the details of the format?
from vscode-js-profile-visualizer.
Alright, I've got so far that I can export a Julia profile result as a .cpuprofile file that can be opened with the VS Code UI :) It is pretty incomplete, though, right now I'm not exporting the tree structure.
One thing that would be helpful is to understand which optional fields from the spec you need to have present for the UI to show something useful. I believe both samples and timeDeltas are needed, right?
What about hitCount and positionTicks?
Also, am I right that some of these fields essentially hold data that is kind of duplicate in the spec? I.e. couldn't something like hitCount be computed from just the data in samples?
from vscode-js-profile-visualizer.
Awesome!
Sample and timeDeltas are where we build most data from. I don't look at hitCount at all, I don't think it's included in recent versions of V8. positionTicks are used for displaying line information in the code lenses, you can get a glance of what they look like in the gif I made for the upcoming release: https://github.com/microsoft/vscode-docs/blob/vnext/release-notes/images/1_45/js-debug-profiling.gif
Unfortunately "ticks" aren't directly correlated to time so they're not as clear to users as they could be (like, a certain number of ms per line). If Julia gives you wall clock time per-line you could just say 1 tick = 1ms... or wait until I support Tracing API profiles which have real per-line time and will require me to build support for that 🙂
By the way, the table-based visualizer is now built-in on Insiders; if you run the vscode.open command on a cpuprofile, it will be displayed nicely for people on Insiders.
from vscode-js-profile-visualizer.
Ah, super helpful!
By the way, the table-based visualizer is now built-in on Insiders
Yes, I found that, makes it a lot easier to play with this :)
Another quick question: for a given ProfileNode, should callFrame.lineNumber and callFrame.columnNumber refer to the location of the function definition itself, right? Not a specific line inside the function, right?
And then, with positionTicks, is the idea that if I have a ProfileNode, and say that node appears n times in the samples array, then this node can have a number of elements in positionTicks, and the sum of the ticks for the entire ProfileNode should equal n?
from vscode-js-profile-visualizer.
@connor4312 I hope you don't mind me asking more questions :) I was working on converting from Julia internal format to .cpuprofile.
We have a sampling profiler that provides backtraces/stackframes. Right now in julia-vscode/ChromeProfileFormat.jl#3 I am converting each sampled stack frame into a linear sequence. Do I need to collapse these sequence onto each other so that they form trees? Each ProfileNode corresponds to a unique instruction pointer and so it only has one child. Is a ProfileNode in the Javascript world a single function? Each positionTick a location inside said function and each child the function called at said location?
from vscode-js-profile-visualizer.
With my most recent changes (in which I tried out my comments above), I produced https://gist.github.com/vchuravy/c38cf8dd5118f7575359f648d0653e8e which breaks the viewer with a "CallStack exhausted message". But I could open it in https://www.speedscope.app/
from vscode-js-profile-visualizer.
It looks like there's a cycle in the profile you posted -- call frame 15 has frame 16 as a child, and 16 has 15 as a child.
Yeah there is recursion in the example.
Okay gotcha. What about:
foo():3 -> bar(), foo():5->bar(). E.g. calls to the same function but on different lines? Should those be different nodes?
from vscode-js-profile-visualizer.
Those ones should be the same nodes.
from vscode-js-profile-visualizer.
Okay thank you for the hints! I think I implemented that correctly, but the extension fails with "Cannot read property 'selfTime' of undefined" when loading https://gist.github.com/vchuravy/cd5729b94ed6d3a18e341d891a1a4c99 https://www.speedscope.app/ does load it, albeit not rendering the children of the top-level function... Manually inspecting my file it seems fine, so I am not sure what the issue is.
from vscode-js-profile-visualizer.
After ironing out some of the kinks, I think I got it to work and an update of my VSCode got rid of the error message.
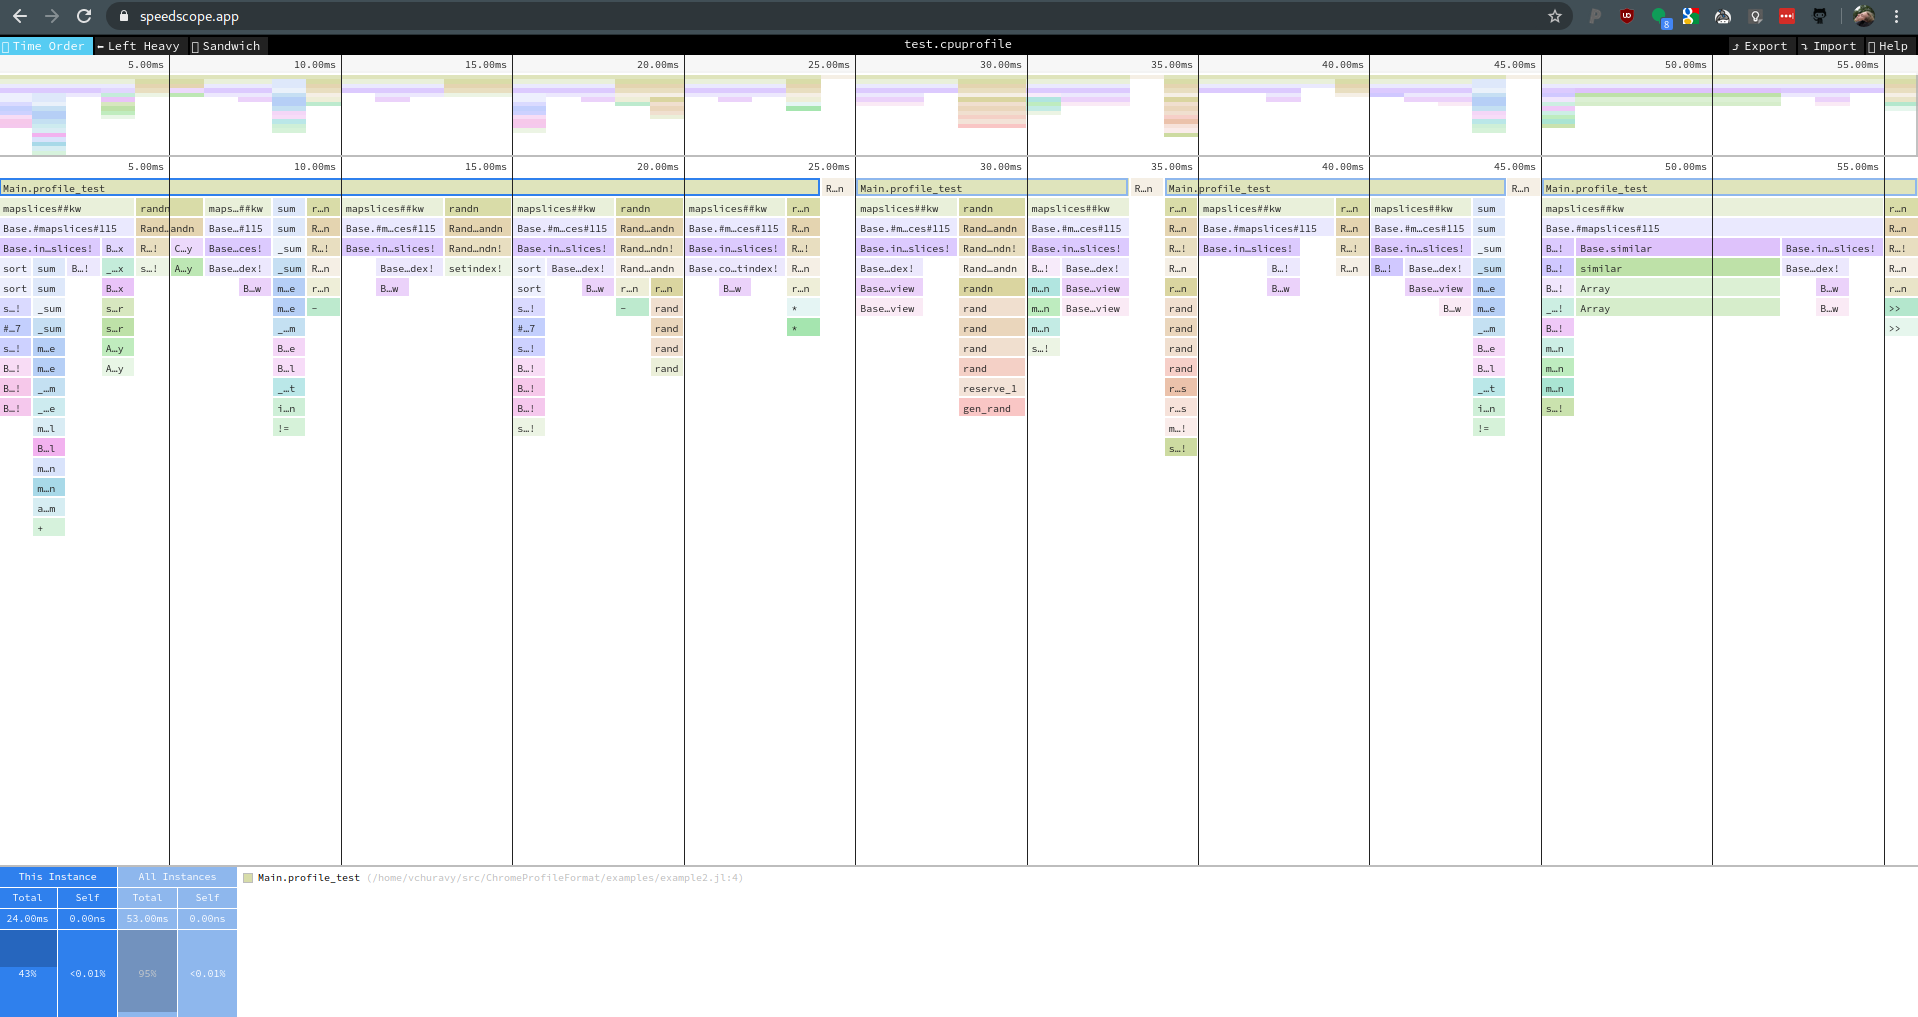
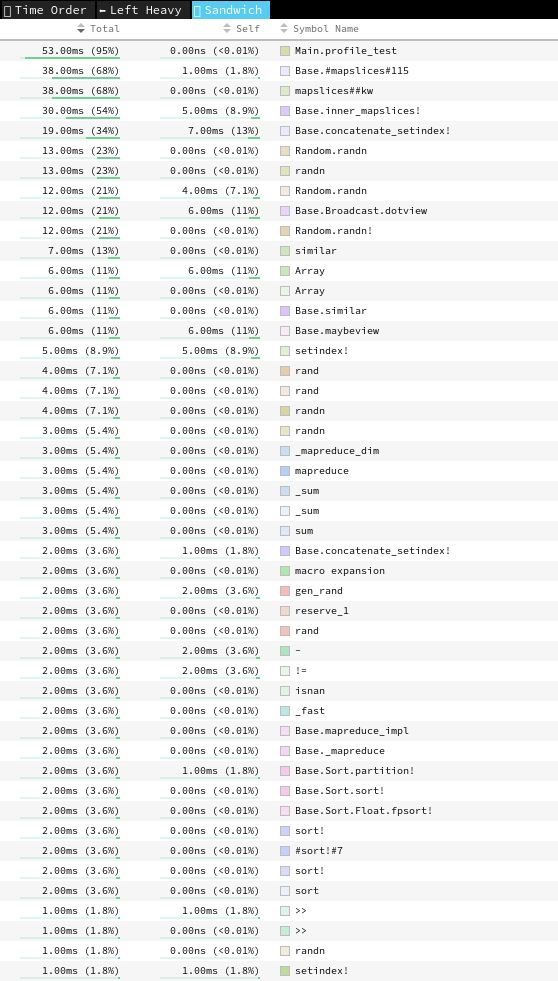
Now comparing a profile that I took from some code that runs in about ~50-60ms I noticed that VSCode seems to drop the top-most function in this case called Main.profile_test from both the table view and the flame graphs. Additionally the total time seems off. VSCode reports ~250ms whereas the code run in 50-60ms and speedscope got it right. Maybe I am emitting the wrong positionTicks? I emit one everytime I pass through that node in the graph for the line that is active.
The profile is available here (slightly different than the one in the screenshots). https://gist.github.com/vchuravy/b12d64ae069678a5ee35ff5618da3257
from vscode-js-profile-visualizer.
in the Rust world we can measure rust binaries using measureme and crox which generates a chrome_profiler.json (this is the file you can upload to chrome performance).
I wonder if this could be shown in using this plugin?
I don't know what format this plugin needs but currently it generates the format Chrome performance Tab understands.
Example Usage
boa-dev/boa#317 (comment)
from vscode-js-profile-visualizer.
The performance tab uses the "Tracing" profile, which is a separate type of profile but on my todo.
from vscode-js-profile-visualizer.
We shipped a new Julia extension with support for this! See here.
from vscode-js-profile-visualizer.
Related Issues (20)
- Flame chart times aren't useful when looking at sub 10ms
- Left or right clicking resets zoom
- Extend timestamp bars the whole way down
- Allow quickly measuring a section using shift
- Consider enabling retainContextWhenHidden
- Hovering rows in the table shows the text caret cursor
- Implement tree (top down)
- Mention "CPU profile" in description
- Improve readme for in product and marketplace viewing
- Changing CSS in vscode-js-profile-core won't apply until the watch task is restarted
- Function names are truncated by large file names
- Restrict repo to the VS Code team
- Saving gives an error
- Hover can be obscured by selected element info
- Allow changing current call stack box without removing the previously focused one
- CPU profile annotations show doubled values HOT 1
- Opening multiple large .cpuprofile files seems to crash the webview HOT 3
- Support virtual filesystems HOT 1
- improve array index checks HOT 1
- Flame chart text rendering is not synchronized with rectangles
Recommend Projects
-
 React
React
A declarative, efficient, and flexible JavaScript library for building user interfaces.
-
Vue.js
🖖 Vue.js is a progressive, incrementally-adoptable JavaScript framework for building UI on the web.
-
 Typescript
TypeScript is a superset of JavaScript that compiles to clean JavaScript output.
-
TensorFlow
An Open Source Machine Learning Framework for Everyone
-
Django
The Web framework for perfectionists with deadlines.
-
Laravel
A PHP framework for web artisans
-
D3
Bring data to life with SVG, Canvas and HTML. 📊📈🎉
-
Recommend Topics
-
javascript
JavaScript (JS) is a lightweight interpreted programming language with first-class functions.
-
web
Some thing interesting about web. New door for the world.
-
server
A server is a program made to process requests and deliver data to clients.
-
Machine learning
Machine learning is a way of modeling and interpreting data that allows a piece of software to respond intelligently.
-
Visualization
Some thing interesting about visualization, use data art
-
Game
Some thing interesting about game, make everyone happy.
Recommend Org
-
Facebook
We are working to build community through open source technology. NB: members must have two-factor auth.
-
Microsoft
Open source projects and samples from Microsoft.
-
Google
Google ❤️ Open Source for everyone.
-
Alibaba
Alibaba Open Source for everyone
-
D3
Data-Driven Documents codes.
-
Tencent
China tencent open source team.


from vscode-js-profile-visualizer.