Hello 👋 I'm from the VS Code team.
Recently, we have been exploring a security feature we refer to as Workspace Trust. This feature is intended to centralize and unify a security conscious decision required by a variety of VS Code features. With workspace trust, the user will be able to declare whether or not they trust the folder that is opened in VS Code before these features are executed.
Why you should care
Your extension is incredibly popular with VS Code users! We want to make sure that those users have a delightful experience with workspace trust and that includes extension authors deciding how much of their extension is supported in an untrusted workspace.
Workspace Trust experience
You can enable the feature with the following setting security.workspace.trust.enabled. Once enabled, you will see the following dialog when opening folders in VS Code.
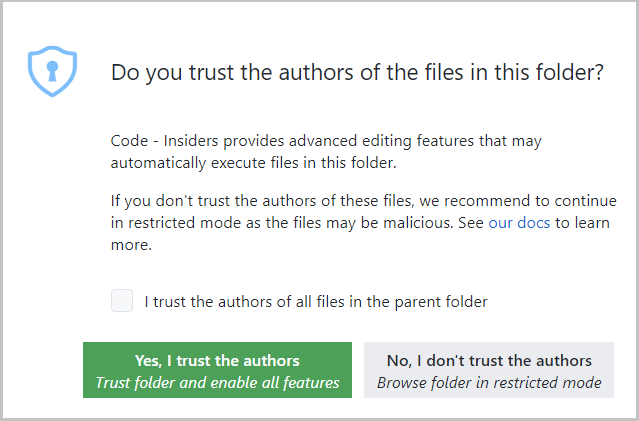
This dialog is important for allowing the user to make a decision early and understand the impact of their decision. Once you understand the feature, you may want to customize when to display the dialog using the setting security.workspace.trust.startupPrompt.
You can follow the development of Workspace Trust and provide feedback in issue #106488.
Workspace trust API
First off, all of what I am about to say can be found in issue #120251. That issue will include discussion of the feature and any updates to the feature.
The Workspace Trust extension API is now in stable. This allowed us to release the first cut of our guide for onboarding your extension to Workspace Trust. The API is small, so here is a quick look.
You can declare your extension to provide complete, partial or no support in untrusted workspaces using the untrustedWorkspaces capability in package.json.
The following example declares that the extension is supported completely in untrusted workspaces. In this case, the extension is enabled in untrusted workspaces.
"capabilities": {
  "untrustedWorkspaces": {
    "supported": true
  }
}
The next example declares that the extension is not supported in untrusted workspaces. In this case, the extension is disabled in untrusted workspaces.
"capabilities": {
  "untrustedWorkspaces": {
    "supported": false
  }
}
The third option is to declared limited support. There are three tools provided to you when you select the limited option.
First, if you have a setting that can be configured in the workspace but requires the workspace to be trusted in order to apply the workspace value, then you can include the setting using restrictedConfigurations array property in untrustedWorkspaces object. Doing so, VS Code will ignore the workspace value of these restricted settings when your extension reads these settings values using the VS Code Workspace Configuration API.
The following example declares the settings that are restricted in untrusted workspaces.
"capabilities": {
  "untrustedWorkspaces": {
    "supported": "limited",
    "restrictedConfigurations": [
      "markdown.styles"
    ]
  }
}
Next, you can also check and listen if the current workspace is trusted or not programmatically using the following API:
export namespace workspace {
  /**
   * When true, the user has explicitly trusted the contents of the workspace.
   */
  export const isTrusted: boolean;
  /**
   * Event that fires when the current workspace has been trusted.
   */
  export const onDidGrantWorkspaceTrust: Event<void>;
}
Lastly, you can hide commands or views declaratively with the isWorkspaceTrusted context key in your when clauses.
A far more detailed guide on how to onboard which will be updated as we receive feedback can be found in issue #120251.
Rollout plan
Workspace Trust will remain disabled for the month of May, but we are planning on enabling this by default in the future. To prepare for that day, we would love for you to try it out and provide feedback.
We'd love your feedback
Since this issue was created in an automated fashion, we won't be monitoring the responses in this issue (our notifications would explode!). Instead we ask you to drop questions, and feedback in issue #120251 as we've mentioned above.
We're excited to see what you do with workspace trust!


![dependabot[bot] avatar](https://avatars.githubusercontent.com/in/29110?v=4 "dependabot[bot]")