modeloriented / shapper Goto Github PK
View Code? Open in Web Editor NEWAn R wrapper of SHAP python library
Home Page: https://modeloriented.github.io/shapper/
An R wrapper of SHAP python library
Home Page: https://modeloriented.github.io/shapper/
Is it possible to combine shapper with custom build models? I do not want to use a predefined algorithm like RandomForest.
Hey please enable the setting of a custom plot title.
Hi there!
I have found this package before go die! Thanks, it's very great. It haven't the shap value return function, but in python have. Sometime I want to do analysis with the shap value and exception value. I found it in the source code when I was confused! So I have do little modify to return the shap value. I download the source code, modify and rebuild, and it can work.
I modify the individual_variable_effect.R file.
individual_variable_effect.explainer <- function(x,
                                                 new_observation,
                                                 method = "KernelSHAP",
                                                 nsamples = "auto",
                                                 ...) {
  # extracts model, data and predict function from the explainer
  model <- x$model
  data <- x$data
  predict_function <- x$predict_function
  label <- x$label
  if("return_shap_value" %in% names(x)){
    return_shap_value <- x$return_shap_value
  }else{
    return_shap_value <- False
  }

  individual_variable_effect.default(
    model,
    data,
    predict_function,
    new_observation = new_observation,
    label = label,
    method = method,
    nsamples = nsamples,
    return_shap_value = return_shap_value,
    ...
  )
}


#' @importFrom utils tail
#' @export
#' @rdname individual_variable_effect
individual_variable_effect.default <-
  function(x,
           data,
           predict_function = predict,
           new_observation,
           label = tail(class(x), 1),
           method = "KernelSHAP",
           nsamples = "auto",
           return_shap_value = False,
           ...) {
    # check if data correct
    if(!all(colnames(data)==colnames(new_observation))){
      stop("Columns in new obseravtion and data does not match")
    }
    # transform factors to numerics and keep factors' levels
    data_classes <- sapply(data, class)
    factors <- list()
    data_numeric <- data
    for (col in names(data_classes)) {
      if (data_classes[col] == "factor") {
        factors[[col]] <- levels(data[, col])
        data_numeric[, col] <- as.numeric(data_numeric[, col]) - 1
      }
    }

    # force nsamples to be an integer
    if (is.numeric(nsamples))
      nsamples <- as.integer(round(nsamples))

    p_function <- function(new_data) {
      new_data <- as.data.frame(new_data)
      colnames(new_data) <- colnames(data)
      for (col in names(factors)) {
        new_data[, col] <- factor(new_data[, col],
                                  levels = c(0:(length(factors[[col]]) - 1)),
                                  labels = factors[[col]])
      }
      res <- as.data.frame(predict_function(x, new_data))
      if (nrow(res) == 1) {
        res[2, ] <- 0
        res <- r_to_py(res)
        res$drop(res$index[1], inplace = TRUE)
      }
      return(res)
    }
    explainer = shap_reference$KernelExplainer(p_function, data_numeric)


    new_observation_releveled <- new_observation
    new_observation_numeric <- new_observation
    for (col in names(factors)) {
      new_observation_releveled[, col] <-
        factor(new_observation_releveled[, col], levels = factors[[col]])
      new_observation_numeric[, col] <-
        as.numeric(new_observation_releveled[, col]) - 1
    }
    shap_values = explainer$shap_values(new_observation_numeric, nsamples = nsamples)
    expected_value = explainer$expected_value
    if (return_shap_value){
        data <- list()
        data[["shap value"]] <- shap_values
        data[["expected_value"]] <- expected_value
        return(data)
    }
It work. But get the shap value and plot need do two times individual_variable_effect, very low efficiency. There must be a better way to do it. Thanks!
Kindly enable plotting of multiple individual variable effects that are stored in a list or vector
Dear maintainer,
Thank you for developing this interesting package. I was following your tutorial using random forest model for classification problem. I faced some problem when I tried using the plot() function:
library("shapper")
library("DALEX")
library("randomForest")
Y_train <- HR$status
x_train <- HR[ , -6]
set.seed(123)
model_rf <- randomForest(x = x_train, y = Y_train, ntree= 50)
p_function <- function(model, data) predict(model, newdata = data, type = "prob")
ive_rf <- individual_variable_effect(model_rf, data = x_train, predict_function = p_function,
                                     new_observation = x_train[1:2,], nsamples = 50)


plot(ive_rf) # error occur when running the plot function
error message:
Error in rounding_function(variable_values[numeric_values], digits) :
  non-numeric argument to mathematical function
Could you give me some suggestions on how to fix this issue? Thank you very much for your time!
Hello team, is there a feature for partial denpendecy plot?
Hi there,
Thank you for developing this package!
I have the issue that when I run individual_variable_effect() function on my data, R studio is terminated.
I have subset my data to a small sample and reduced n_samples to 10. Is there anything else I can do?
Thank you!
Code:
ive_rf <- shapper::individual_variable_effect(model, data = new_data[1:100,], predict_function = predict_model.bartMachine,
new_observation = new_data[101,], nsamples = 10)I am running SHAP from the library shapper in R for a classification model intrepetation on a Keras 1D CNN model:
library(keras)
library("shapper")
library("DALEX")
I made a simple reproductible example
mdat.train <- cbind(rep(1:2, each = 5), matrix(c(1:30), ncol = 3, byrow = TRUE))
train.conv <- array_reshape(mdat.train[,-1], c(nrow(mdat.train[,-1]), ncol(mdat.train[,-1]), 1))

mdat.test <- cbind(rep(1:2, each = 3), matrix(c(1:18), ncol = 3, byrow = TRUE))
test.conv <- array_reshape(mdat.test[,-1], c(nrow(mdat.test[,-1]), ncol(mdat.test[,-1]), 1))
My CNN model
model.CNN <- keras_model_sequential()
model.CNN %>%
  layer_conv_1d(filters=16L, kernel_initializer=initializer_he_normal(seed=NULL), kernel_size=2L, input_shape = c(dim(train.conv)[[2]],1)) %>%
  layer_batch_normalization() %>%
  layer_activation_leaky_relu() %>%

  layer_flatten() %>%
  layer_dense(50, activation ="relu") %>%
  layer_dropout(rate=0.5) %>%
  layer_dense(units=2, activation ='sigmoid')

model.CNN %>% compile(
  loss = loss_binary_crossentropy,
  optimizer = optimizer_adam(lr = 0.001, beta_1 = 0.9, beta_2 = 0.999, epsilon = 1e-08),
  metrics = c("accuracy"))

model.CNN %>% fit(
  train.conv, mdat.train[,1], epochs = 5, verbose = 1)
My Shap command
p_function <- function(model, data) predict(model.CNN, test.conv, type = "prob")
exp_cnn <- explain(model.CNN, data = train.conv)
ive_cnn <- shap(exp_cnn, data = train.conv, new_observation = test.conv, predict_function = p_function)
I am getting this error :
Error in py_call_impl(callable, dots$args, dots$keywords) :
  ValueError: operands could not be broadcast together with shapes (2,6) (10,)
Hi there,
is there any elaborated way to obtain SHAP Feature Importance using shapper?
Reading this https://christophm.github.io/interpretable-ml-book/shap.html#shap-feature-importance
...I would guess, doing a loop over "shapper::individual_variable_effect" and mean() the results of attributions per vname could do the trick.
Am I wrong?
Is there any plan to integrate the original functions, like summary_plot to obtain SHAP feature importance?
By the way, when I try to feed the function individual_variable_effect with multiple new observations new_observation = testX[1:5, ] I get errors.
Error in $<-.data.frame(tmp, "_attribution_", value = c(0, -0.365675633989662, : replacement has 140 rows, data has 70
After running example from readme, individual_variable_effect:
C:\Users\mstaniak\Anaconda3\envs\r-reticulate\lib\site-packages\sklearn\externals\joblib\externals\cloudpickle\cloudpickle.py:47: DeprecationWarning: the imp module is deprecated in favour of importlib; see the module's documentation for alternative uses
  import imp
Using 7847 background data samples could cause slower run times. Consider using shap.kmeans(data, K) to summarize the background as K weighted samples.
  0%|          | 0/1 [00:00<?, ?it/s]
 Show Traceback

 Rerun with Debug
 Error in py_call_impl(callable, dots$args, dots$keywords) :
  TypeError: unsupported operand type(s) for -: 'str' and 'str'
Hello,
The shapper package has introduced shapper for classification and regression analysis. I would like to inquire if the shapper package can be used for survival analysis? How to achieve it?
Looking forward to receiving your help!
Thanks!
Something is wrong with the configuration of Travis. Package is not building.
@maksymiuks could you please take a look on this? :)
We have very restricted computing environments which limits what packages we can have access to. As part of this, our institution's IT dept will only grab R packages that are available from Anaconda (!) (https://anaconda.org/r/repo).
Please consider submitting shapper for inclusion in anaconda's list. Thank you (and apologies for such a seemingly trivial request),
--sukie--
Is it possible to change r-reticulate envir to a different one?
Hey there!
Nice package! I'm primarily a python user, but many of my colleagues would find this useful. Will there be support for the visualization modules introduced in the original SHAP repo? Namely their summary and force plots? Happy to PR.
Thanks!
Any idea why results for the titanic are so strange?
library("DALEX")
library("randomForest")
load("models/titanic_rf_v6.rda")
load("models/titanic.rda")
explain_titanic_rf <- explain(model = titanic_rf_v6,
                              data = titanic[,c(1:4,6:8)],
                              y = titanic$survived == "yes",
                              label = "Random Forest v6")
johny_d <- data.frame(
  class = factor("1st", levels = c("1st", "2nd", "3rd", "deck crew", "engineering crew",
                                  "restaurant staff", "victualling crew")),
  gender = factor("male", levels = c("female", "male")),
  age = 8,
  sibsp = 0,
  parch = 0,
  fare = 72,
  embarked = factor("Southampton", levels = c("Belfast", "Cherbourg", "Queenstown", "Southampton"))
)

shapper_johny <- shapper::individual_variable_effect(titanic_rf_v6, titanic[,c(1:4,6:8)], DALEX:::yhat.randomForest, johny_d)
plot(shapper_johny)
The message in the console showed like this.
I have tried installing from CRAN or from Github and both way installed successfully.
I also installed numpy and pandas with reticulate::py_install function.
Everything seems all right, but got an error while requiring it.
Below is the error message
library(shapper)
錯誤: package or namespace load failed for ‘shapper’ in get(Info[i, 1], envir = env):
lazy-load database '/Library/Frameworks/R.framework/Versions/3.6/Resources/library/shapper/R/shapper.rdb' is corrupt
此外: Warning message:
In get(Info[i, 1], envir = env) : internal error -3 in R_decompress1
thank you for your reply.
Hi,
I know shap has implementation for XGBoost and LightGBM. But can shap be used for plain vanilla GBM as well?
The installation of shapper fails with the following error message:
Cannot install on Python version 3.12.0; only versions >=3.8,<3.12 are supported.
So, will you update for support of Python version 3.12.0?
Best regards
Eric Melse
Consider something like this

x <- ive

x$`_vname_` <- reorder(x$`_vname_`, x$`_attribution_`, function(z) -sum(abs(z)))
levels(x$`_vname_`) <- paste(sapply(1:6, substr, x="        ", start=1), levels(x$`_vname_`))

ggplot(x, aes(x=`_vname_`, xend=`_vname_`,
              yend = `_yhat_mean_`, y = `_yhat_mean_` + `_attribution_`,
              color=`_sign_`)) +
  geom_segment(arrow = arrow(length=unit(0.30,"cm"), ends="first", type = "closed")) +
  geom_text(aes(label = round(`_attribution_`, 2)), nudge_x = 0.45) +
  geom_segment(aes(x = "_predicted_",xend = "_predicted_",
                   y = `_yhat_`, yend = `_yhat_mean_`), size = 2, color="black",
               arrow = arrow(length=unit(0.30,"cm"), ends="first", type = "closed")) +
  geom_text(aes(x = "_predicted_",
                y = `_yhat_`, label = round(`_yhat_`, 2)), nudge_x = 0.45, color="black") +
  geom_hline(aes(yintercept = `_yhat_mean_`)) +
  facet_grid(`_ylevel_`~`_label_`) +
  scale_color_manual(values =  c(`-` = "#d8b365", `0` = "#f5f5f5", `+` = "#5ab4ac",
                                X = "darkgrey")) +
  coord_flip() + theme_minimal() + theme(legend.position="none") + xlab("") + ylab("")
Hello!
I am using plot_individual_variable_effect() and getting an unexpected behavior. My graph looks like this (note that the right y-values --- in pink --- are being cut off):
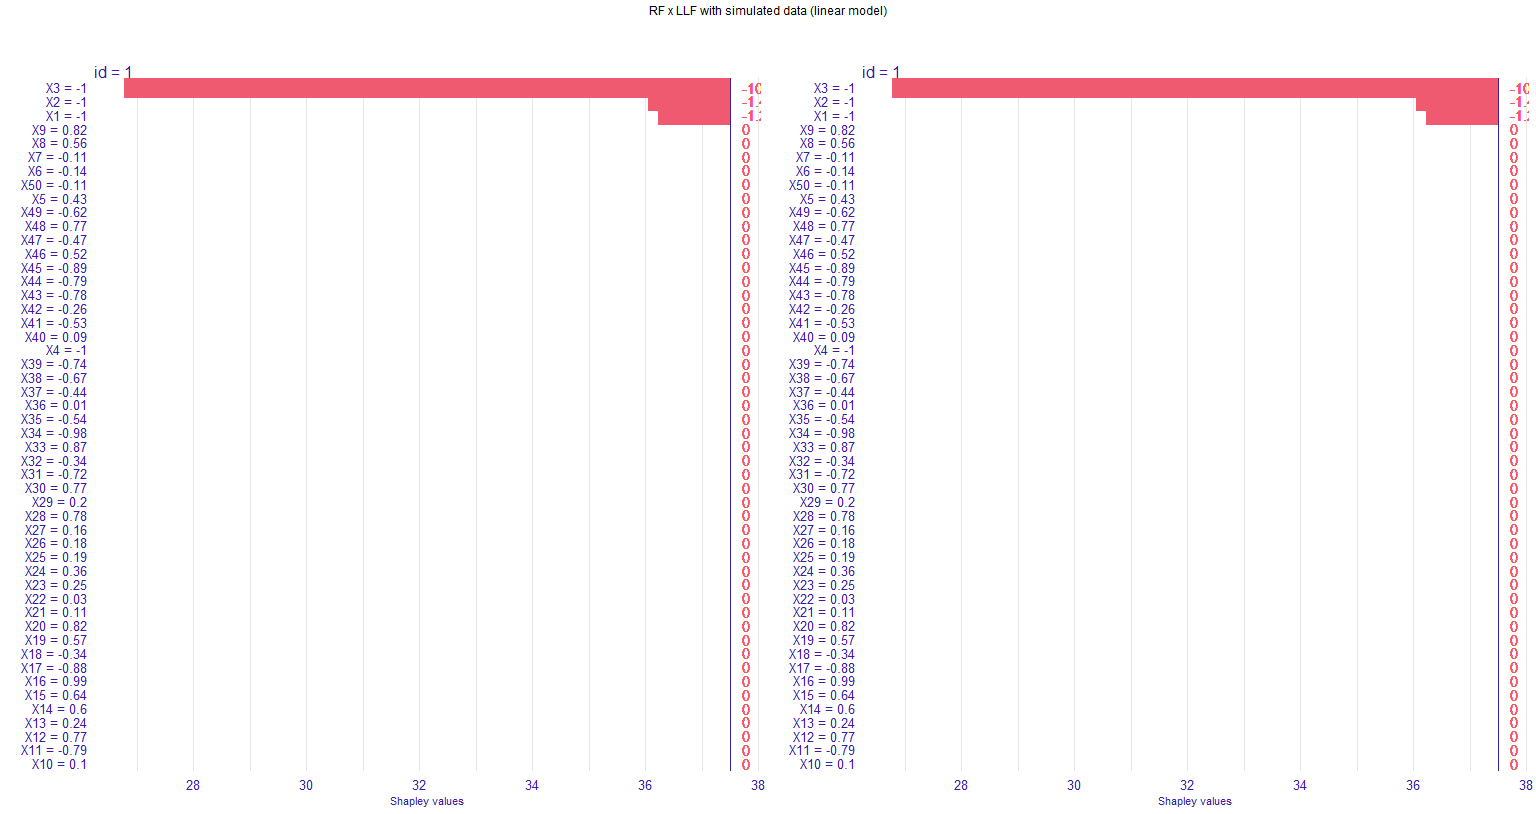
In my dataset, the Shapley values for all relevant variables are in the same direction, such that my bar plot only goes to the right. The values end up being cut from the graph when I use grid.arrange() to put two figures together. I tried to change the plot theme (using element_text()), but for some reason that "second" y-axis is unaffected.
I tried to plot without grid.arrange() (just using plot(g1, g2)), but this doesn't work (only one graph is displayed). I also tried to put some margins in the grid.arrange() by using grobs(); the graphs shrink but the axis values are still being cut.
Any ideas on how I can get the plot without the 'right' y-axis being cut?
Here a working code:
# Verify if a package is installed, if not, download and install before loading.
chooseCRANmirror(graphics = FALSE, ind = 10)
if (!require("pacman")) install.packages("pacman")
pacman::p_load(ggplot2, gridExtra, knitr, grid,randomForest, shapper, grf)
n = 1000
p = 50
sigma2 = 4
m = 50
sigma <- sqrt(sigma2)
X <- matrix(runif(n * p, -1, 1), nrow = n)
# Creates a new X matrix
X.test <- matrix(runif(m * p, -1, 1), nrow = m)
ticks <- seq(-1, 1, length = m)
# Computes Y and the test data
mu <- function(x1, x2, x3, x4){36+3.5*x1+3.25*x2+12*x3+0.01*x4}
Y <- mu(X[,1], X[,2], X[,3], X[,4]) + sigma * rnorm(n)
X.test[,1:4] <- ticks
# Fit the models
# Model using the regular random forest
forest <- regression_forest(X, Y)
# Local linear forest
ll.forest <- ll_regression_forest(X, Y, enable.ll.split = TRUE)
# Get the graphs from shapper
dfX <- data.frame(X)
dfY <- data.frame(Y)
dftestX <- data.frame(X.test)
ive_rf <- individual_variable_effect(forest, data = dfX[1:50,], new_observation = dftestX[1,])
plot(ive_rf, show_predicted = FALSE)
ive_llf <- individual_variable_effect(ll.forest, data = dfX[1:50,], new_observation = dftestX[1,])
ive_llf_filtered <- dplyr::filter(ive_rf, ylevel =="predictions")
g1 <- plot(ive_rf, show_predicted = FALSE, digits = 2)
g2 <- plot(ive_llf_filtered, show_predicted = FALSE, digits = 2)
# Plot g1 and g2 together as they are now cuts the right y axis
grid.arrange(g1, g2, nrow = 1, top=textGrob("RF x LLF with simulated data (linear model)", gp=gpar(fontsize=9,font=1)))
g1 <- g1 + theme(text = element_text(size = 8), strip.text.y = element_blank())
g2 <- g2 + theme(text = element_text(size = 8), strip.text.y = element_blank())
# Now the font size is decreased everywhere but the y-axis values are still being cut
grid.arrange(g1, g2, nrow = 1, top=textGrob("RF x LLF with simulated data (linear model)", gp=gpar(fontsize=9,font=1)))
Working through your vignette, I came across an issue in the plot function. If I write show_predicted = FALSE it does still show the predicted value. However, if I misspell it as show_predcited = FALSE then it correctly hides the predicted value from the plot. Should be a quick fix.
Currently in the shapper we have hard copies of drwhy themes
> library("shapper")
Attaching package: ‘shapper’
The following objects are masked from ‘package:DALEX’:
    theme_drwhy, theme_drwhy_colors, theme_drwhy_vertical
maybe we can use directly themes from DALEX package?
as it is done in iBreakDown
https://github.com/ModelOriented/iBreakDown/blob/master/R/plot_break_down.R#L25
this way we will not need to maintain separate copies of theme_*
When running the following example from the shapper regression vignette on CRAN:
library("shapper") ive_rf <- shap(exp_rf, new_observation = new_passanger) ive_rf
We get a warning from the SHAP package:
l1_reg="auto" is deprecated (in SHAP) and in the next version (v0.29) the behavior will change from a conditional use of AIC to simply "num_features(10)"!
Hi,
After installing "shapper" package and adding library, I run install_shap() function and the error message in the console is as follows.
ERROR: Could not find a version that satisfies the requirement slicer (from shap) (from versions: none)
ERROR: No matching distribution found for slicer (from shap)
Error: Error installing package(s): 'shap'
Thanks.
Hi,
In linux suse SLES 15 sp1 set up, I already had created a virtual environment and installed R and tensorflow .
I had a tensorflow model and I could successfully load the model in R.
But when I installed shapper successfully, then with library(shapper), installed shap with command shapper::install_shap(); after that I am getting error tensorflow not found while loading the tensorflow model. Please help. Please let me know if any more information is needed.
Also, I did not find a deep explainer in shapper which seems only available in shap ? if it is not true can you point me to the right implementation?
TF version - 2.4.1 shapper - 0.1.3 shap - 0.39.0
Regards,
Avishek
Any idea why this is not working?
# load datasets
library("DALEX2")
Y_train <- HR$status
x_train <- HR[ , -6]
x_train$gender <- as.numeric(x_train$gender)

# Let's build a model
library("randomForest")
set.seed(123)
model_rf <- randomForest(x = x_train, y = Y_train)

# here DALEX starts
library("DALEX2")
rf_explainer <- explain(model_rf, data = x_train)

# here shapper starts
library("shapper")
ive <- individual_variable_effect(rf_explainer,
                               new_observation = x_train[1,])

plot(ive)
How can the 'plot(ive, ylevel = c("ok", "fired"))' work for more classes/instances?
Maybe they can be drawn in consecutive columns?
A declarative, efficient, and flexible JavaScript library for building user interfaces.
🖖 Vue.js is a progressive, incrementally-adoptable JavaScript framework for building UI on the web.
TypeScript is a superset of JavaScript that compiles to clean JavaScript output.
An Open Source Machine Learning Framework for Everyone
The Web framework for perfectionists with deadlines.
A PHP framework for web artisans
Bring data to life with SVG, Canvas and HTML. 📊📈🎉
JavaScript (JS) is a lightweight interpreted programming language with first-class functions.
Some thing interesting about web. New door for the world.
A server is a program made to process requests and deliver data to clients.
Machine learning is a way of modeling and interpreting data that allows a piece of software to respond intelligently.
Some thing interesting about visualization, use data art
Some thing interesting about game, make everyone happy.
We are working to build community through open source technology. NB: members must have two-factor auth.
Open source projects and samples from Microsoft.
Google ❤️ Open Source for everyone.
Alibaba Open Source for everyone
Data-Driven Documents codes.
China tencent open source team.