I decided to try out exploring the New York Times API with R. For this example, I'm looking at their archives API. After parsing the data and seeing what was available and in what format, a good entry point seemed to be the Section Name variable. This post and the code below explores how the number of articles within different sections of the paper in a year has changed over ten years, from 2006 to 2016.
One of the two function I use to explore this particular questions parses the data and creates a frequency table for each month. The other function loops through twelve months, and calls the first funciton. It then combines all of the rows fromt these dataframes for each month. It then groups by section name, and then sums the Frequency counts of each group together.
The first function:
	newgetArchiveSectionName <- function(year, month, key) {

	  create_url <- paste("http://api.nytimes.com/svc/archive/v1/", year,"/",month,".json?api-key=",key, sep="")

	  g1 <- GET(create_url)

	  g2 <- content(g1, 'parsed')

	  g3 <- g2$response

	  g4 <- g3$docs

	  g5 <- data.frame(do.call(rbind, g4), stringsAsFactors=FALSE)

	  g6 <- g5$section_name

	  g7 <- lapply(g6, function(x) ifelse(x=="NULL", NA, x))
	  g8 <- lapply(g7, function(x) as.character((unlist(x))))
	  g9 <- as.data.frame(do.call(cbind, g8))

	  g9$ID <- seq.int(nrow(g9))

	  g10 <- as.data.frame(t(g9))

	  g11 <- as.data.frame(table(g10$V1, useNA="always"))

	  g12 <- cSplit(g11, 'Var1', ";")

	  names(g12)[2] <- 'Var1'

	  g13 <- g12 %>%
	          select(Var1, Freq) %>%
	          group_by(Var1) %>%
	          summarise_all(funs(sum))

	  return(g13)

	}

The second function:
newgetMonths <- function(year, key) {
  df_total = NULL

  for (i in 1:12) {
    i_string <- toString(i)
    assign(paste('sub',i,sep=''), getArchiveSectionName(year,i_string,key))
    name <- paste('sub', i, sep="")

  }

  freq_name <- paste('Freq', year, sep="-")

  cyear <- rbind(sub1, sub2, sub3, sub4, sub5, sub6, sub7, sub8, sub9, sub10, sub11, sub12) %>%
            group_by(Var1) %>%
            summarise_all(funs(sum)) %>%
            arrange(desc(Freq))

  g12 <- cSplit(cyear, 'Var1', ";")

  names(g12)[2] <- 'Var1'

  g13 <- g12 %>%
    select(Var1, Freq) %>%
    group_by(Var1) %>%
    summarise_all(funs(sum)) %>%
    rename(c("Freq" = freq_name))

  return(g13)

}
It took me several iterations of the second function, `newgetMonths`, to arrive at the solution that finally gave me reliable results, and for which I didn't have to massage the return value after calling the funciton for each year.

I could take this a step further and create a third function that then took a range of years and merged them together into one dataframe, which is what I do with the following code.
c17 <- newgetMonths('2017', api_key)
c16 <- newgetMonths('2016', api_key)
c15 <- newgetMonths('2015', api_key)
c14 <- newgetMonths('2014', api_key)
c13 <- newgetMonths('2013', api_key)
c12 <- newgetMonths('2012', api_key)
c11 <- newgetMonths('2011', api_key)
c10 <- newgetMonths('2010', api_key)
c09 <- newgetMonths('2009', api_key)
c08 <- newgetMonths('2008', api_key)
c07 <- newgetMonths('2007', api_key)
c06 <- newgetMonths('2006', api_key)

c06_16 <- c11 %>%
			left_join(c06, by="Var1_1") %>%
			left_join(c07, by="Var1_1") %>%
			left_join(c08, by="Var1_1") %>%
			left_join(c09, by="Var1_1") %>%
            left_join(c10, by="Var1_1") %>%
            left_join(c11, by="Var1_1") %>%
            left_join(c12, by="Var1_1") %>%
            left_join(c13, by="Var1_1") %>%
            left_join(c14, by="Var1_1") %>%
            left_join(c15, by="Var1_1") %>%
            left_join(c16, by="Var1_1") %>%
			arrange(desc(`Freq-2016`))

c06_16_new <- c06_16[1:10,]
I summed the frequencies for each year to make sure that the results looked consistent with what i was expecting (over 100K results for each month).

For example:
sum(c16$`Freq-2016`)
sum(c15$`Freq-2015`)
sum(c14$`Freq-2014`)
sum(c13$`Freq-2013`)
sum(c12$`Freq-2012`)
sum(c11$`Freq-2011`)
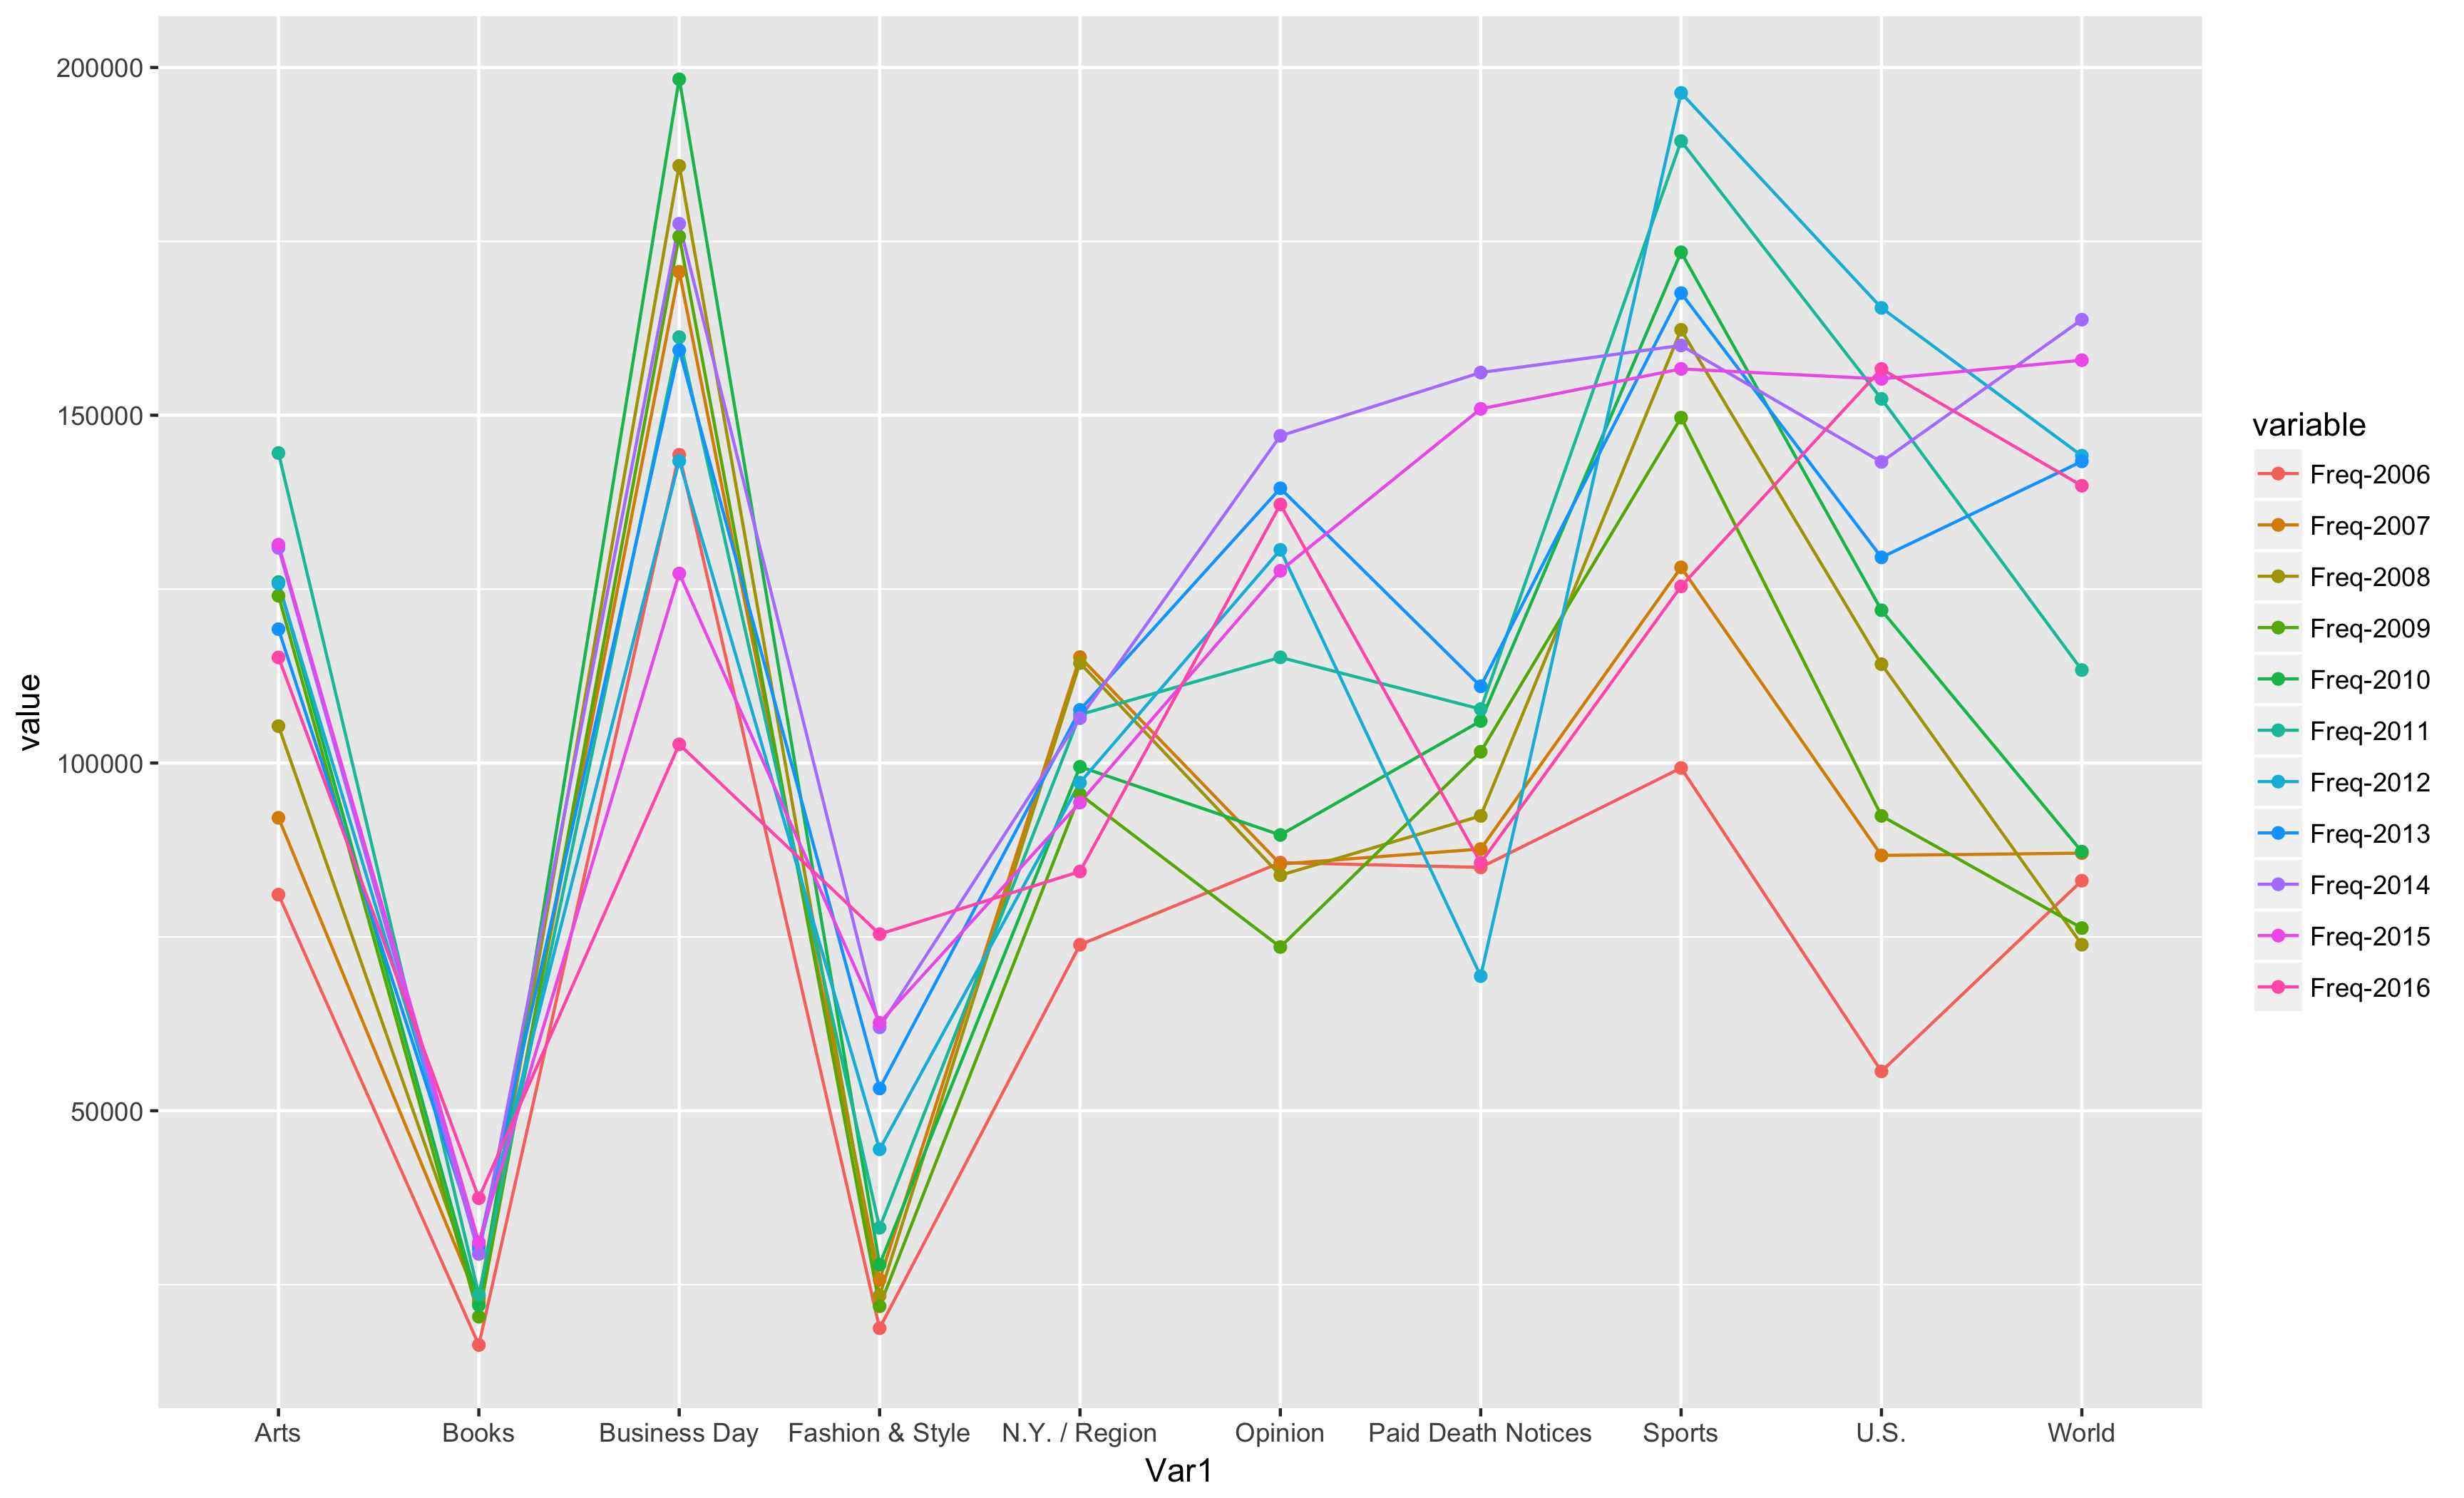
Here are the top 10 results for 2016, sorted descended by year 2016.
             Var1 `Freq-2006` `Freq-2007` `Freq-2008` `Freq-2009` `Freq-2010` `Freq-2011` `Freq-2012` `Freq-2013` `Freq-2014` `Freq-2015` `Freq-2016`
            <chr>       <int>       <int>       <int>       <int>       <int>       <int>       <int>       <int>       <int>       <int>       <int>
1 U.S. 55657 86713 114204 92394 121963 152347 165433 129560 143286 155219 156649 2 World 83078 87043 73883 76264 87254 113363 144174 143363 163739 157911 139863 3 Opinion 85675 85465 83861 73542 89651 115191 130648 139495 147034 127637 137165 4 Sports 99287 128128 162285 149652 173428 189409 196343 167555 160031 156664 125392 5 Arts 81072 92114 105298 124038 126005 144563 125807 119239 130932 131391 115178 6 Business Day 144314 170630 185855 175679 198297 161228 143418 159358 177536 127243 102682 7 Paid Death Notices 84991 87635 92389 101615 106034 107748 69359 111026 156140 150918 85645 8 N.Y. / Region 73872 115223 114361 95485 99465 106951 97171 107634 106451 94312 84400 9 Fashion & Style 18730 25692 23411 21892 27873 33176 44453 53203 61990 62645 75397 10 Books 16324 22404 22998 20381 22041 23556 30122 30515 29419 31078 37434
Articles appeared most in the U.S. section in 2016, and in the World section the year before. World was the second-highest in 2016, and in 2015, Sports was the second-highest. Sports was the fourth-highest in 2016. Business Day was the most frequent section in 2006, followed by sports.
This graph shows the top ten sections in 2016, and compares them across the prior 10 years.