Giter VIP home page Giter VIP logo

billboard.js's Introduction

billboard.js

Latest Version Next version bb
semantic-release React

CI Status Coverage Status Known Vulnerabilities download jsDelivr gzip size

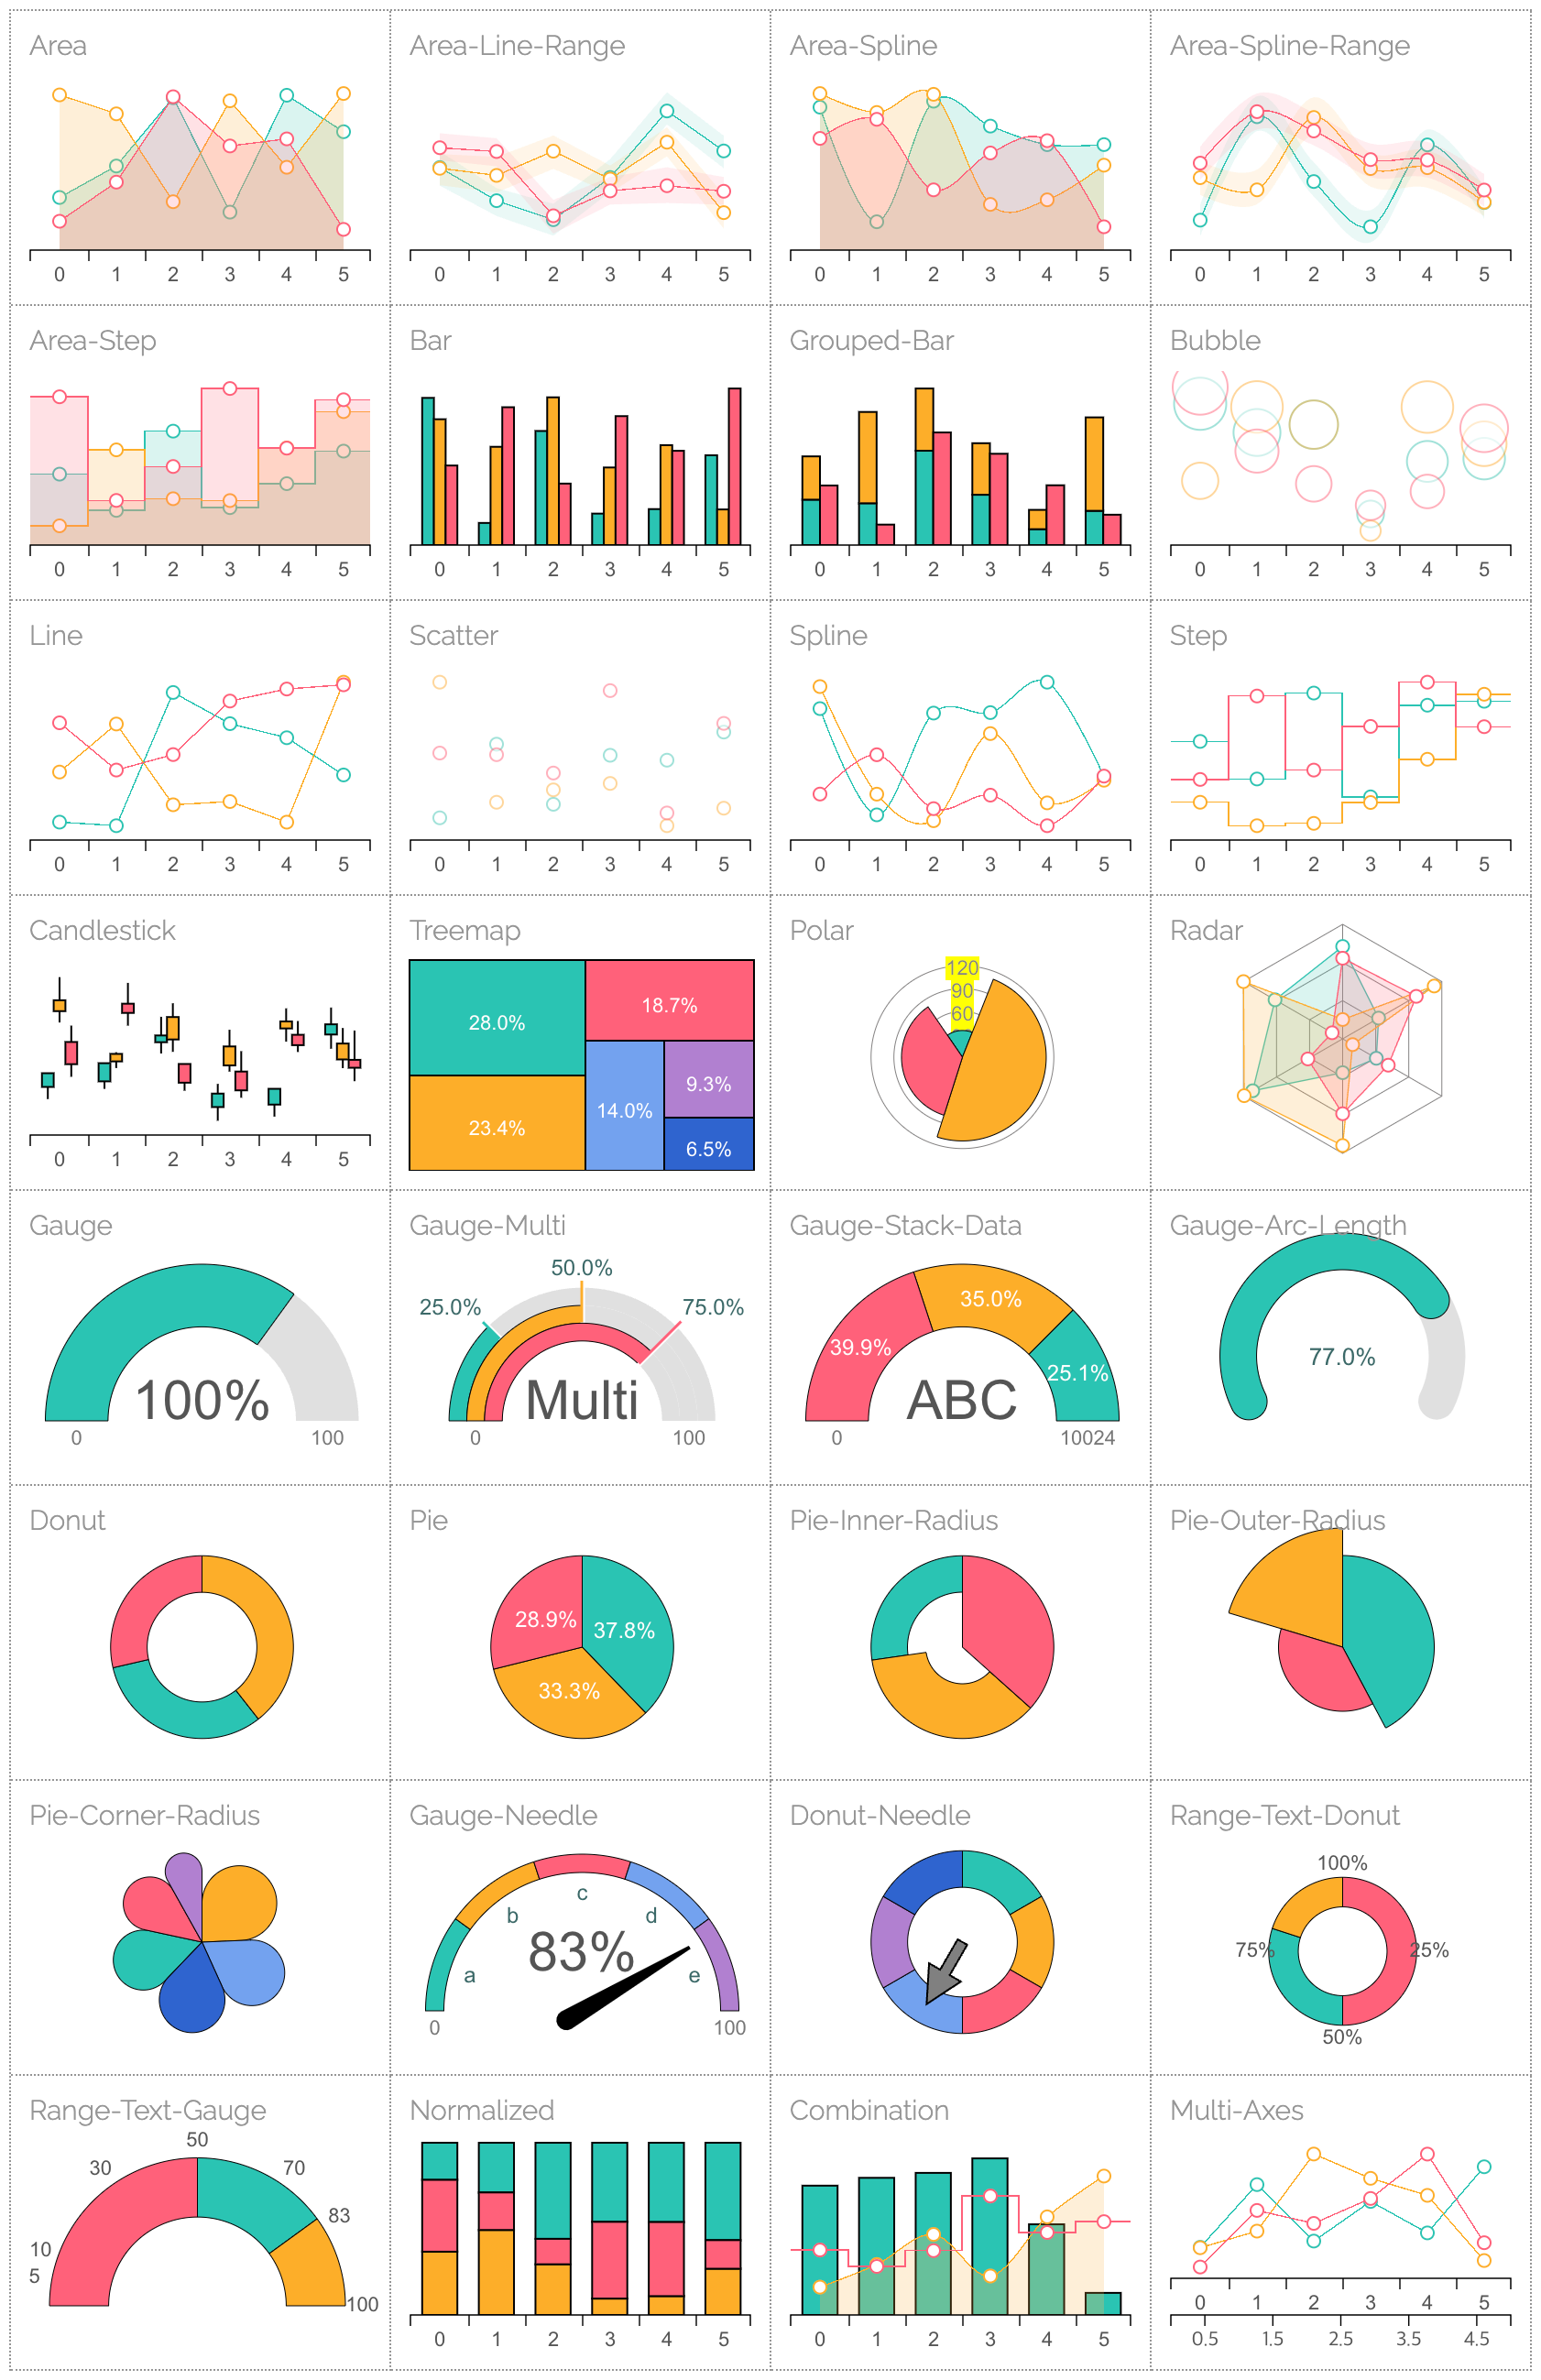
billboard.js is a re-usable, easy interface JavaScript chart library, based on D3.js.

The name "billboard" comes from the famous billboard chart which everybody knows.

Documents

Questions?

If you have any questions, checkout the previous posts or create a new one at:

Supported chart types

Download and Installation

Download dist files from the repo directly or install it via npm.

Dist file list from the repo. (click to expand)

For development (Uncompressed)

You can download the uncompressed files for development

Latest

Specific version

For production (Compressed)

You can download the compressed files for production

Latest

Specific version

Packaged version (with D3.js inclusion)

Packaged version is not an official distribution. It's to provide an easy way to load 'billboard.js' with dependency.

Themes

If you want apply themes, simply load one of the theme css file provided instead of the default css file.

Dist theme file list from the repo. (click to expand)

datalab

dark

insight

graph

modern

Nightly version

Nightly version is the latest build from the master branch. With nightly, you can try upcoming changes prior the official release.

The version info will be given as the build datetime: x.x.x-nightly-yyyymmddhhmmss

There're two ways to install from nightly branch directly.

// Specify on 'package.json' file
"dependencies": {
      ...
      "billboard.js": "naver/billboard.js#nightly"
},
# Run install command from shell
$ npm install git+https://github.com/naver/billboard.js.git#nightly --save

Next(Release Canditate) version

Next version is the 'release candidate' build, prior the latest official release.

# Run install command from shell
$ npm install billboard.js@next --save

Installation with npm

$ npm install billboard.js

Packages

Name For Description
bb React React component for billboard.js

Using CDN

If you want to use 'billboard.js' without installation, load files directly from one of the CDN providers.

Supported Browsers

  • Basically will work on all SVG and ES6+ supported browsers.
  • *Notes for legacy browsers:
    • Recommended to use packaged build or construct your own build following How to bundle for legacy browsers? instruction.
    • D3.js dropped the support of legacy browsers since v6.
    • The support isn't fully guaranteed.

Dependency by version

D3.js (required) billboard.js
4.x ~ 5.x 1.x ~ 2.x
6.x+ 3.x+

Load billboard.js after D3.js.

<!-- 1) Load D3.js and billboard.js separately -->
    <!-- Load D3: -->
    <script src="https://d3js.org/d3.v6.min.js"></script>

    <!-- Load billboard.js with base(or theme) style -->
    <link rel="stylesheet" href="$YOUR_PATH/billboard.css">
    <script src="$YOUR_PATH/billboard.js"></script>

<!-- 2) or Load billboard.js packaged with D3.js -->
    <link rel="stylesheet" href="$YOUR_PATH/billboard.css">
    <script src="$YOUR_PATH/billboard.pkgd.js"></script>

or use importing ESM.

📌 Also check: How to load as ESM directly from the browser?

// 1) import billboard.js
// as named import with desired shapes and interaction modules
// https://github.com/naver/billboard.js/wiki/CHANGELOG-v2#modularization-by-its-functionality
import {bb, area, bar, zoom} from "billboard.js";

// or as importing default
import bb, {area, bar, zoom} from "billboard.js";

// 2) import css if your dev-env supports. If don't, include them via <link>
import "billboard.js/dist/billboard.css";

// or theme style. Find more themes from 'theme' folder
import "billboard.js/dist/theme/insight.css"

Note

Basic usage example

1) Create chart holder element

<div id="chart"></div>

2) Generate a chart with options

// generate the chart
var chart = bb.generate({
    bindto: "#chart",
    data: {
      // for ESM import usage, import 'line' module and execute it as
      // type: line(),
      type: "line",
      columns: [
          ["data1", 30, 200, 100, 400, 150, 250]
      ]
    },
    zoom: {
      // for ESM import usage, import 'zoom' module and execute it as
      // enabled: zoom()
      enabled: true
    }
});

// call some API
chart.load( ... );

License

billboard.js is released under the MIT license.

Copyright (c) 2017 ~ present NAVER Corp.

Permission is hereby granted, free of charge, to any person obtaining a copy
of this software and associated documentation files (the "Software"), to deal
in the Software without restriction, including without limitation the rights
to use, copy, modify, merge, publish, distribute, sublicense, and/or sell
copies of the Software, and to permit persons to whom the Software is
furnished to do so, subject to the following conditions:

The above copyright notice and this permission notice shall be included in
all copies or substantial portions of the Software.

THE SOFTWARE IS PROVIDED "AS IS", WITHOUT WARRANTY OF ANY KIND, EXPRESS OR
IMPLIED, INCLUDING BUT NOT LIMITED TO THE WARRANTIES OF MERCHANTABILITY,
FITNESS FOR A PARTICULAR PURPOSE AND NONINFRINGEMENT.  IN NO EVENT SHALL THE
AUTHORS OR COPYRIGHT HOLDERS BE LIABLE FOR ANY CLAIM, DAMAGES OR OTHER
LIABILITY, WHETHER IN AN ACTION OF CONTRACT, TORT OR OTHERWISE, ARISING FROM,
OUT OF OR IN CONNECTION WITH THE SOFTWARE OR THE USE OR OTHER DEALINGS IN
THE SOFTWARE.

FOSSA Status

billboard.js's People

Contributors

adschm avatar bastiao avatar bjlbernal avatar chriskalmar avatar danelkhen avatar danielepiccone avatar dependabot-preview[bot] avatar dependabot[bot] avatar dpraul avatar dungsaga avatar ebencollins avatar edcartre avatar germainbergeron avatar greenkeeper[bot] avatar kc-dot-io avatar kt3k avatar masayuki0812 avatar michkami avatar netil avatar peterdavehello avatar pjschreifels avatar rexebin avatar sculove avatar semantic-release-bot avatar soyme avatar stof avatar su-docker avatar teichmaj avatar timopheym avatar yojeek avatar

Stargazers

 avatar  avatar  avatar  avatar  avatar  avatar  avatar  avatar  avatar  avatar  avatar  avatar  avatar  avatar  avatar  avatar  avatar  avatar  avatar  avatar  avatar  avatar  avatar  avatar  avatar  avatar  avatar  avatar  avatar  avatar  avatar  avatar  avatar  avatar  avatar  avatar  avatar  avatar  avatar  avatar  avatar  avatar  avatar  avatar  avatar  avatar  avatar  avatar  avatar  avatar  avatar  avatar  avatar  avatar  avatar  avatar  avatar  avatar  avatar  avatar  avatar  avatar  avatar  avatar  avatar  avatar  avatar  avatar  avatar  avatar  avatar  avatar  avatar  avatar  avatar  avatar  avatar  avatar  avatar  avatar  avatar  avatar  avatar  avatar  avatar  avatar  avatar  avatar  avatar  avatar  avatar  avatar  avatar  avatar  avatar  avatar  avatar  avatar  avatar  avatar

Watchers

 avatar  avatar  avatar  avatar  avatar  avatar  avatar  avatar  avatar  avatar  avatar  avatar  avatar  avatar  avatar  avatar  avatar  avatar  avatar  avatar  avatar  avatar  avatar  avatar  avatar  avatar  avatar  avatar  avatar  avatar  avatar  avatar  avatar  avatar  avatar  avatar  avatar  avatar  avatar  avatar  avatar  avatar  avatar  avatar  avatar  avatar  avatar  avatar  avatar  avatar  avatar  avatar  avatar  avatar  avatar  avatar  avatar  avatar  avatar  avatar  avatar  avatar  avatar  avatar  avatar  avatar  avatar  avatar  avatar  avatar  avatar  avatar  avatar  avatar  avatar  avatar  avatar

billboard.js's Issues

Reinforce test coverage

Description

Test coverage remains at 73%, it should be cover at least 80%+.
It needs add more test cases to increase.

Fulfill missing API

Description

Some data options aren't described on API doc

  • data.url
  • data.json
  • data.rows
  • data.columns
  • data.mimeType
  • data.keys

billboard.js + Chrome 59

After updating Chrome to v 59.0.3071.115 tooltips and hovering-highlight stopped working on charts.
It is even worse that it does not work for me also on the examples page of billboard.js (ie top bar chart here https://naver.github.io/billboard.js/)

Does anyone have any solution for that?

Edit: Important to mention that it works correctly in Firfox and even in Edge.
Edit2: What is interesting, when touching chart chunks on the touch screen of the very same computer it works correctly.

Padding on timeseries

Hello,

Description

I am trying to add a padding on a chart that use a timeseries based x axis. But nothing happens. What I'm trying to achieve is to prevent my points to be cut on left and right when they are on the edges of my chart (see below).

screenshot_5

Steps to check or reproduce

You can see this codepen to reproduce.

Thank you very much.

EDIT : I found a workaround by using min/max and substracting/adding some days on my boundaries. It works, but I think it would be better if we could use padding since it is made for that purpose I guess.

X-axis of timeseries-based-chart changes by the chart type

Description

Like I mentioned on the title, X-axis of timeseries-based-chart changes by the chart type
and I’d like to get timeseries charts w/ same x-axis .

On the bar chart example(check the bar chart below), there are some scratch areas on the very left and right side, which were generated automatically.
The thing is… on the line chart example, the scratch area doesn’t exit and the x-axis is differ from that of bar chart. (Even though they were rendered based on the totally same data)

I am getting through this problem by manipulating some padding.left & padding.right (or axis.x.padding.left, axis.x.padding.right).

As you may guess, sometimes, synchronizing each chart's x-axis is a huge deal.

It will be a big help for me, if you guys are willing to provide an way to get charts w/ same x-axis.
There must be someone who needs your solution on this matter as like I do.

Thanks, in advance. :)

Steps to check or reproduce

JS Bin on jsbin.com

issue3

The option to place the labels on the bottom

Description

AFAIK, the labels are rendered on the upper-side of the chart by default.
There's no option to manipulate the position of labels, so far.

The easiest way (but bothering ;() is increasing the 'y' value of element manually.
However, changing the 'y' value by hand may cause a blink.
Because, this re-rendering follows the default rendering on the default position.

I'd like to place the label on the bottom by handling the option which could be a solution to the above problem at the same time.

If you guys have a possible way, please add it to the following release.

I believe that there must be other users who seriously need it.

Thanks ~ :)

Steps to check or reproduce

        var chart = bb.generate({
            bindto: "#_temperature",
            interaction: {
                enabled: false
            },
            legend: {
                show: false
            },
            data: {
                x: "x",
                columns: [
                    ['x', 1, 2, 3, 4, 5],
                    ['data1', 7, 9, 13, 16, 20],
                    ['data2', 2, 2, 5, 7, 10]
                ],
                labels: true
            },
            axis: {
                x: {
                    show: false
                },
                y: {
                    show: false
                }
            },
            tooltip: {
                show: false
            },
            point:   {
                show: false
            }
        });

issue

Question

Hi!
How could I show/hide each label in a donut chart when the user do a mouse over or mouse out in each legend:

var chart = bb.generate({
  data: {
    columns: [...],
    type: 'donut'
  },
  legend: {
    item: {
      onover: function(id) {
        // code ¿?
      },
      onout: function(id) {
        // code ¿?
      }
    }
  },
  donut: {
    title: 'Title',
    label: {
      show: false
    }
  },
  bindto: '#donutChartContainer'
});

Thanks!

New option for data label position

Description

Currently data label value are shown above the data point.
In most cases is okay, but there're needs to change the label's position.

For example, in the case of #21

bar chart isn't working on master branch

Description

I want to create bar chart but, billboard draw line chart.
master branch version is broken.
but, packaged version is ok.

Steps to check or reproduce

 var chart = bb.generate({
  "data": {
    "columns": [
      [
        "data1",
        30,
        200,
        100,
        400,
        150,
        250
      ],
      [
        "data2",
        130,
        100,
        140,
        200,
        150,
        50
      ]
    ],
    "type": "bar"
  },
  "bar": {
    "width": {
      "ratio": 0.5
    }
  },
  "bindto": "#chart"
});

2017-06-18 4 35 28

The option to delete the axis

Description

I’m trying to render a chart w/o y and x axis.

The chart supposed to be rendered on the very lower side without any space, as I expected.

But the axis still does exist, even after adding the ‘axis.x.show = false’ & ‘axis.y.show = false’.

The axis’s visibility is set hidden, meaning still occupying the space.

So the solution what I am having is like below.

  1. Draw the chart bigger than I meant to
  2. Cut off the x and y axis on purpose

When I render a chart w/o the axis, I repeatedly do this and feel knackered.

I am hoping you to have a plan regarding the bothering works I mentioned above.

Thanks :)

Steps to check or reproduce

var oRes = {
    date: [
        '2016-10-15',
        '2016-11-01',
        '2016-12-01',
        '2017-01-01',
        '2017-02-01',
        '2017-03-01',
        '2017-04-01',
        '2017-05-01',
        '2017-06-01',
        '2017-07-01',
        '2017-08-01',
        '2017-09-01',
        '2017-10-01',
    ],
    data: [null, 42, 47, 37, 44, 40,
        33, 35, 32, 41, 46,
        50, 51]
};
this._aDate = (["date"]).concat(oRes.date);
this._aData = (["precipitation"]).concat(oRes.data);

var chart = Billboard.generate({
    bindto: "#_precipitation",
    interaction: {
        enabled: false
    },
    legend: {
        show: false
    },
    tooltip: {
        show: false
    },
    data: {
        x: "date",
        types:    {
            precipitation : "bar"
        },
        columns: [ this._aDate, this._aData],
        labels: true
    },
    padding: {
        right:  -10
    },
    bar: {
        width: 5,
        zerobased: true
    },
    point: {
        show: false
    },
    axis: {
        x: {
            // fit:  true,
            min:  "2016-10-15",
            max:  "2017-10-14",
            type: "timeseries",
            tick: {
                format: "%-m"
                /*culling: {
                    max: 12 // the number of tick texts will be adjusted to less than this value
                }*/
            },
            show: false,
            padding: {
                left: 0
            }
        },
        y: {
            show: false,
            padding: {
                bottom: 0
            }
        }
    },
    grid:    {
        x: {
            lines: [
                {value: "2016-11-01"},
                {value: "2016-12-01"},
                {value: "2017-01-01"},
                {value: "2017-02-01"},
                {value: "2017-03-01"},
                {value: "2017-04-01"},
                {value: "2017-05-01"},
                {value: "2017-06-01"},
                {value: "2017-07-01"},
                {value: "2017-08-01"},
                {value: "2017-09-01"},
                {value: "2017-10-01"},
                {value: "2017-06-19", class:"c3-dashed-line"}
            ]
        }
    }
});

2issues

Action required: Greenkeeper could not be activated 🚨

🚨 You need to enable Continuous Integration on all branches of this repository. 🚨

To enable Greenkeeper, you need to make sure that a commit status is reported on all branches. This is required by Greenkeeper because we are using your CI build statuses to figure out when to notify you about breaking changes.

Since we did not receive a CI status on the greenkeeper/initial branch, we assume that you still need to configure it.

If you have already set up a CI for this repository, you might need to check your configuration. Make sure it will run on all new branches. If you don’t want it to run on every branch, you can whitelist branches starting with greenkeeper/.

We recommend using Travis CI, but Greenkeeper will work with every other CI service as well.

Once you have installed CI on this repository, you’ll need to re-trigger Greenkeeper’s initial Pull Request. To do this, please delete the greenkeeper/initial branch in this repository, and then remove and re-add this repository to the Greenkeeper integration’s white list on Github. You'll find this list on your repo or organiszation’s settings page, under Installed GitHub Apps.

Option line.step_type doesn't work

Hi,
Thanks, this is a great charting library ! I've encountered some trouble to change step type for step chart as described here : https://naver.github.io/billboard.js/release/latest/doc/Options.html#.line.

Description

How to use option line.step_type for step charts ?

The code below produce no chart, only an error in the console.
It works only for type = 'step'.

Steps to check or reproduce

bb.generate({
  "data": {
    "columns": [
      [
        "data1",
        300,
        350,
        300,
        0,
        0,
        100
      ]
    ],
    "type": "step"
  },
  line: {
     step: {
         type: "step-after"
     }
 },
  "bindto": "#chart"
});

Look for possibility to decrease node generation

Description

There're options to handle the visibility of specific element using xxx.show options.

Even they aren't rendered, still nodes are created, which are unnecessary in most cases.
Look possibility to not generate those nodes if aren't shown, which can be more efficient.

Callback for data min/max

Description

Implement new option for data, which callback function are executed for the min/max data value.
The callback function should be executed only once during generation.

The interface is :

// data.onmin / data.onmax
var chart = bb.generate({
	bindto: "#chart",
	data: {
		...
		onmin: function(data) {
			// the minimal data point element reference is given in array
			data === [
				{ element: HTMLElement, index: Number, value: Number },
				...
			]
		},
		onmax: function(data) {
			// the maximal data point element reference is given in array
			data === [
				{ element: HTMLElement, index: Number, value: Number },
				...
			]
		}
});

Option to handle clippath

Description

The chart area applied clip-path attribute, to not overflow chart element, but in some cases the chart element should be displaying over the axis.

For example,

  • the first image illustrate when data 0 is visualized over the axis x, but the data point is hidden, because of clip-path.
  • in that case, the second image is more appropriate. Showing the entire data point circle above axis.
    image

The new option axis.clippath will give the opportunity to handle this occasion.

zoom not working for bar charts (bars do not resize)

Description

bars do not resize when zooming.

example

`

<div id="chart1"></div>

<!-- Load D3.js -->
<script src="https://d3js.org/d3.v4.min.js"></script>

<!-- Load billboard.js with style -->
<script src="billboard.js"></script>
<link rel="stylesheet" href="billboard.css">

<script>
    var chart = bb.generate({
        "data": {
            "columns": [
                [
                    "data1",
                    30,
                    200,
                    100,
                    400,
                    150,
                    250
                ],
                [
                    "data2",
                    130,
                    100,
                    140,
                    200,
                    150,
                    50
                ]
            ],
            "type": "bar"
        },
        "zoom": {
            "enabled": true
        },
        "bar": {
            "width": {
                "ratio": 0.5
            }
        },
        "bindto": "#chart1"
    });
</script>
`

'scaleOrdinal' property undefined in the billboard.js file on the website's homepage

Description

While trying the 'getting started' example on the homepage for this library, I keep getting the following error: 'Uncaught TypeError: Cannot read property 'scaleOrdinal' of undefined' and the line it complains about in the un-minified version is line 5279, in the ChartInternal.generateColor function. I am using the billboard.js and billboard.css linked on the homepage, which are placed at the root of the same directory where I have my HTML file. I see this in Chrome and Firefox on Windows 7.

Steps to check or reproduce

My billboardTest.html:

<!DOCTYPE html>
<html>
    <head>
        <title>Billboard.js Test</title>
        <script defer src="https://d3js.org/d3.v4.min.js"></script>
        <script src="billboard.js"></script>
        <link rel="stylesheet" href="billboard.css">
    </head>

    <body>
        <div id="chart"></div>

        <script>
            var chart = bb.generate({
                bindto: '#chart',
                data: {
                    type: 'bar',
                    columns: [
                        ["data1", 30, 200, 100, 400, 150, 250],
                        ["data2", 130, 100, 140, 200, 150, 50]
                    ]
                }
            });

        </script>
    </body>
</html>

Double dashed tooltip data class name

Description

The default tooltip data class name is setting with double dashes as:
bb-tooltip-name--data1

It should remove unnecessary dash on class name to be
bb-tooltip-name-data1

Add linting in CI build

Description

Currently linting should be executed separately which can be omitted easily.
Need to be added on CI build to make sure the check.

Support git hook

Description

support git hook

  • case commit : check commit style
  • case push : check lint

data.sort not working in pie chart

Description

Hi guys, I'm using the pie chart and I'm trying to change the order of the pie section using the property data.order, but it doesn't work. Whatever option I use I get the same result ('asc' | 'desc' | custom compare function).

this is the code example I'm using:

bb.generate({
    bindto: "#chart",
    data: {
        columns: [
            ["data1", 30, 200, 100, 170, 150, 250],
            ["data2", 130, 100, 140, 35, 110, 50]
        ],
        type: "pie",
        order : "asc",
        colors: {
          data1: "red",
          data2: "green"
        }
    }
});

Steps to check or reproduce

Here are some examples with using different sort parameters and getting always the same result:
using sort asc
https://codepen.io/anon/pen/zzzBRO

using sort desc
https://codepen.io/anon/pen/BZZPVY

using custom compare fn
https://codepen.io/anon/pen/rwwrrE

Let me know if I'm doing something wrong or if there is a workaround for this.

thanks!

`onclick` doesn't work on touch screens ?

Hello,

Description

I put an onclick callback on my chart. It works pretty well when clicking with a mouse on a desktop device. But when touching a point on a touch screen or in chrome and firefox in touch device simulation mode, it doesn't execute my callback.

Steps to check or reproduce

Here is a codepen on which you can easily reproduce this, by clicking on a point.

Thanks for you work.

Intent to ship multiple donut title text

Description

Currently, donut title text can display one line text only.
image

Provide multiple lines rendering option, when title text contain new line(\n) character.
ex.)

  donut: {
    title: "Iris Petal\nWidth"
  },

image

When a min / max is specified, spread ticks evenly across whole chart

Description

The ticks remain locked to the data points, rather than nicely spreading out to the full range.
I have an application that needs to show the same timeseries range and often there will be gaps in the data shown.
I'd like if Billboard could know to spread the ticks out nicely when the range of the chart exceeds the range of the data.

Steps to check or reproduce

https://jsfiddle.net/sc1sn35u/
https://jsfiddle.net/tz646yhu/1/

Change color based on graph value

Description

Hello there, coming from a D3 background I used to write code like this:
const opacity = d3.scaleLinear().domain([0, max]).range(["#efffff", this.computedType]);

(this.computedType was simply a different color based on the type of the graph.)
to obtain the effect of changing the color based on the single bar value: the higher the value, the stronger the color.

How can I obtain the same effect on Billboard? I saw in the doc that there is a color:pattern property but it's not really clear how it works!

Steps to check or reproduce

Alignment problem with labels and rotate x axis

Description

I have a bar graph (the same as the example provided here: https://cdn.rawgit.com/naver/billboard.js/8413325d/demo/#Axis.RotatedAxis,
but with just the bar type of data. The only difference is that the data provided are in json format with a text value:
[ {text: "text1", value: 5}, {text: "text2", value: 10}, {text: "text3", value: 15}, ]

I would like to have the text value of every object as text label of the corresponding value. So I added this code to the graph:

axis: { x: { type: "category", categories: labels, }, rotated: true, },

but the label are not aligned with the values. In that specific case I can see the three bars with the value of 5, 10 and 15 but the labels on the y axis (the x rotated) are just two.

screen shot 2017-06-20 at 6 34 15 pm

In that case I should see a third "test1" aligned with the bar in the middle. On top of that you can notice that the label that are present are not aligned correctly with the respective bars.

Steps to check or reproduce

This is the code that cause the problem:

            const data = this.data.map(i => i.value);
            const labels = this.data.map(i => i.text);
            data.unshift("data1");
            billboard.bb.generate({
                data: {
                    columns: [
                        data,
                    ],
                    types: {
                        data1: "bar",
                    },
                },
                axis: {
                    x: {
                        type: "category",
                        categories: labels,
                    },
                    rotated: true,
                },
                bindto: `.${this.graphUniqueClass}`,

Can't remove hover effect

Description

Greetings
I didn't find the way to unbind all hover effects from donut
May You give me advice how to do it?
Thank you

Steps to check or reproduce

Buggy interaction on zoomed chart

Description

Event rect elements remains at same position, even chart area are zoomed.
When try to do some interaction after zooming, it gets wrong positioned due to <rect> element position.

Expected action

The <rect> element should positioned aligned with the data element

Recommend Projects

  • React photo React

    A declarative, efficient, and flexible JavaScript library for building user interfaces.

  • Vue.js photo Vue.js

    🖖 Vue.js is a progressive, incrementally-adoptable JavaScript framework for building UI on the web.

  • Typescript photo Typescript

    TypeScript is a superset of JavaScript that compiles to clean JavaScript output.

  • TensorFlow photo TensorFlow

    An Open Source Machine Learning Framework for Everyone

  • Django photo Django

    The Web framework for perfectionists with deadlines.

  • D3 photo D3

    Bring data to life with SVG, Canvas and HTML. 📊📈🎉

Recommend Topics

  • javascript

    JavaScript (JS) is a lightweight interpreted programming language with first-class functions.

  • web

    Some thing interesting about web. New door for the world.

  • server

    A server is a program made to process requests and deliver data to clients.

  • Machine learning

    Machine learning is a way of modeling and interpreting data that allows a piece of software to respond intelligently.

  • Game

    Some thing interesting about game, make everyone happy.

Recommend Org

  • Facebook photo Facebook

    We are working to build community through open source technology. NB: members must have two-factor auth.

  • Microsoft photo Microsoft

    Open source projects and samples from Microsoft.

  • Google photo Google

    Google ❤️ Open Source for everyone.

  • D3 photo D3

    Data-Driven Documents codes.