Comments (4)
 netil
commented on May 14, 2024
netil
commented on May 14, 2024
For pie/donut types, with data.order can be rendered in two forms.
- default (which is sames as "desc")
- null

The order function, just works for non-arc types.
If you need data order appeared in some determined way, bind the data in that order.
If you need that pie to appeard in different angle, make some function for that as:
function rotate(deg) {
    chart.internal.svg
        .style("transformOrigin", "center")
        .style("transform", "rotate("+ deg +"deg)")
        .selectAll(".bb-chart-arc text")
        .each(function() {
            var node = d3.select(this);
            node.attr("transform", node.attr("transform") + " rotate(-"+ deg +")");
        });
}
With that function, calling rotate(90) will get the result as below.

from billboard.js.
 DigitalWheelie
commented on May 14, 2024
DigitalWheelie
commented on May 14, 2024
This is great, thank you.
I'm having problems with showing very small chart values:
data: {
  columns: [
    ["Sponge ", 88],
    ["Flying Trapeze ", 8],
    ["Fueled Reamers ", 2],
    ["Collaborations With Triumphs ", 1],
    ["Other Venues ", 1]
  ]
}
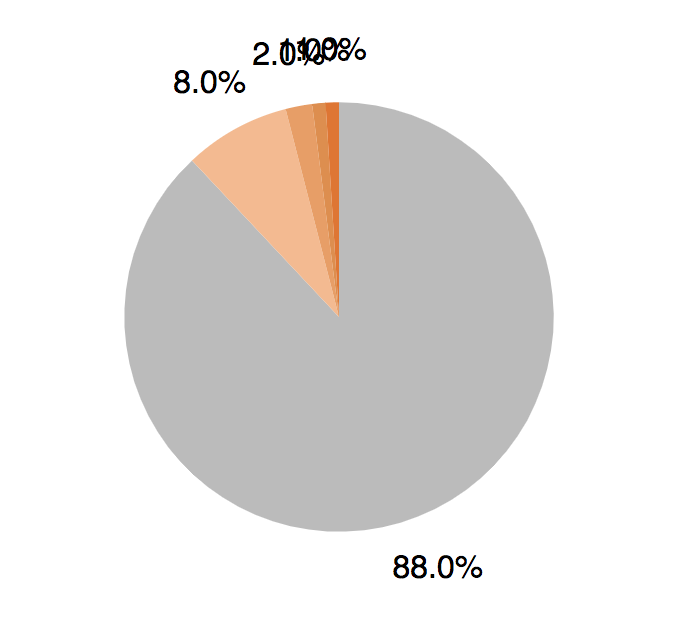
Rotating the chart may help. Specifying the order of slices may help as well, but I'm not sure how to "bind the data in that order." Can you give a specific example, some code, or offer some detail as to how to do this?
Many thanks!
from billboard.js.
DigitalWheelie
commented on May 14, 2024
Actually, I'll extend this to say I'd love if pie chart value sorting, and/or pie chart initial rotation were built-in features/capabilities.
from billboard.js.
netil
commented on May 14, 2024
fixed by 1.9.0 release.
from billboard.js.
Related Issues (20)
- radar type generation on ESM
- Remove point def element added on unload
- legend: Legend tooltip ignores data.names HOT 3
- [Feature Request] legend: Provide key and value as arguments for format
- interface indent
- Inconsistence in tooltip y coordinate in gauge with arc.rangeText + title.text
- Replace karma due to the deprecation
- Is there any way to create two combined charts which share a single x-axis? HOT 1
- About domain in `clip-path` HOT 1
- inconsistency in the scaling of the y-axes HOT 4
- x-axis label overlapped by tick text HOT 1
- option for rotating axis labels
- `arc.needle.value` is missing from typings HOT 1
- "boost.useWorker: true" in combination with frequent updates results in a consistent tab crash HOT 2
- Adopt eslint v9
- Implement regions.label to .region() API HOT 1
- Add regions.label type definition
- Scatter Plot points not displaying when loaded into chart in some cases HOT 1
- Chart data update with overriden transition duration freezes app
- Implement option to force event to work multiple xs type work as single x
Recommend Projects
-
 React
React
A declarative, efficient, and flexible JavaScript library for building user interfaces.
-
Vue.js
🖖 Vue.js is a progressive, incrementally-adoptable JavaScript framework for building UI on the web.
-
 Typescript
TypeScript is a superset of JavaScript that compiles to clean JavaScript output.
-
TensorFlow
An Open Source Machine Learning Framework for Everyone
-
Django
The Web framework for perfectionists with deadlines.
-
 Laravel
A PHP framework for web artisans
-
D3
Bring data to life with SVG, Canvas and HTML. 📊📈🎉
-
Recommend Topics
-
javascript
JavaScript (JS) is a lightweight interpreted programming language with first-class functions.
-
web
Some thing interesting about web. New door for the world.
-
server
A server is a program made to process requests and deliver data to clients.
-
Machine learning
Machine learning is a way of modeling and interpreting data that allows a piece of software to respond intelligently.
-
Visualization
Some thing interesting about visualization, use data art
-
Game
Some thing interesting about game, make everyone happy.
Recommend Org
-
Facebook
We are working to build community through open source technology. NB: members must have two-factor auth.
-
Microsoft
Open source projects and samples from Microsoft.
-
Google
Google ❤️ Open Source for everyone.
-
Alibaba
Alibaba Open Source for everyone
-
D3
Data-Driven Documents codes.
-
Tencent
China tencent open source team.
from billboard.js.