Giter VIP home page Giter VIP logo

ephyviewer's Introduction

ephyviewer

Simple viewers for ephys signals, events, video and more

Distributions:PyPI Anaconda Cloud
Source Code:GitHub conda-forge Feedstock
Tests Status:Tests Status conda-forge Build Status Documentation Status Coverage status

Documentation | Release Notes | Issue Tracker

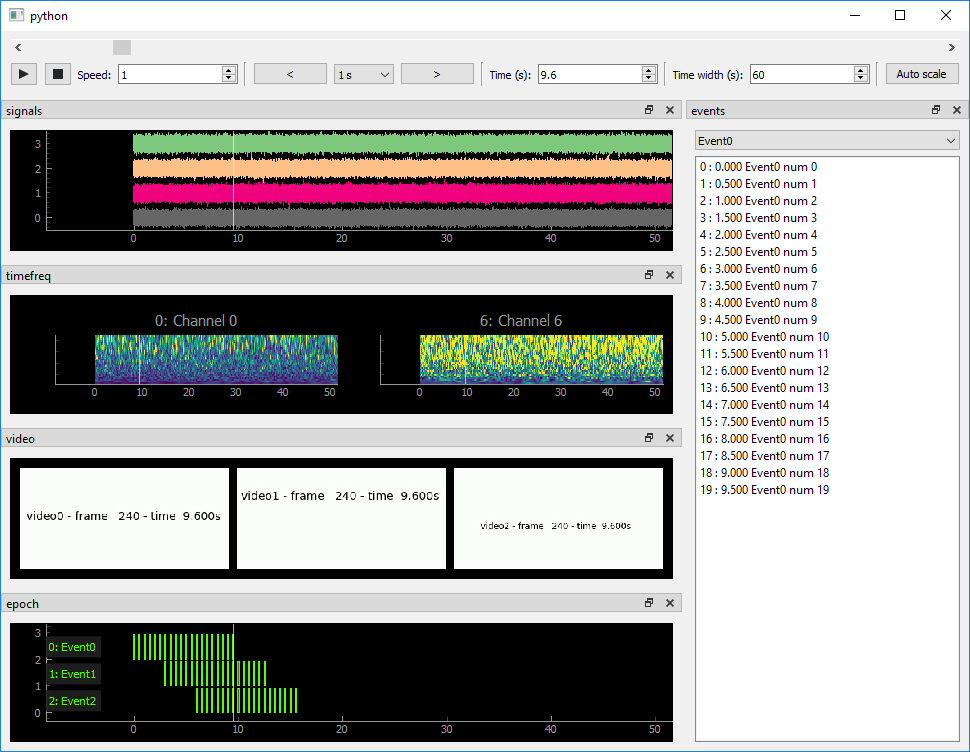
ephyviewer is a Python library based on pyqtgraph for building custom viewers for electrophysiological signals, video, events, epochs, spike trains, data tables, and time-frequency representations of signals. It also provides an epoch encoder for creating annotations.

Screenshot

ephyviewer can be used at two levels: standalone app and library.

For an example of an application that utilizes ephyviewer's capabilities as a library, see the neurotic app and this paper:

Gill, J. P., Garcia, S., Ting, L. H., Wu, M., & Chiel, H. J. (2020). neurotic: Neuroscience Tool for Interactive Characterization. eNeuro, 7(3). https://doi.org/10.1523/ENEURO.0085-20.2020

Standalone application

The standalone app works with file types supported by Neo's RawIO interface (Axograph, Axon, Blackrock, BrainVision, Neuralynx, NeuroExplorer, Plexon, Spike2, Tdt, etc.; see the documentation for neo.rawio for the full list).

Launch it from the console and use the menu to select a data file:

ephyviewer

Alternatively, launch it from the console with a filename (and optionally the format):

ephyviewer File_axon_1.abf
ephyviewer File_axon_1.abf -f Axon

Library for designing custom viewers for ephys datasets

Build viewers using code like this:

import ephyviewer
import numpy as np

app = ephyviewer.mkQApp()

#signals
sigs = np.random.rand(100000,16)
sample_rate = 1000.
t_start = 0.
view1 = ephyviewer.TraceViewer.from_numpy(sigs, sample_rate, t_start, 'Signals')

win = ephyviewer.MainViewer(debug=True, show_auto_scale=True)
win.add_view(view1)
win.show()

app.exec()

Check the docs for more examples.

ephyviewer's People

Contributors

jpgill86 avatar penguinpee avatar samuelgarcia avatar

Stargazers

 avatar  avatar  avatar  avatar  avatar  avatar  avatar  avatar  avatar  avatar  avatar  avatar  avatar  avatar  avatar  avatar  avatar  avatar  avatar  avatar  avatar  avatar  avatar  avatar  avatar  avatar  avatar  avatar  avatar  avatar  avatar  avatar  avatar  avatar  avatar  avatar  avatar  avatar  avatar  avatar  avatar  avatar  avatar  avatar  avatar  avatar  avatar  avatar  avatar  avatar

Watchers

 avatar  avatar  avatar  avatar  avatar

ephyviewer's Issues

Unable to read data: Warning invalid value encountered in multiply data_curves

Dear Ephyviewer community,

First of all thank you so much for your work, having this simple tool is an amazing help. Today I tried to share the joy of using ephyviewer with a colleague (@dsr33) but we encountered what seems to be a bug.
We tried to visualize data from numpy arrays. The same file works on my computer and displays correctly (jupyter notebook Python 3.8.8)
MicrosoftTeams-image

However, when trying to run the same code, on the same data on my colleague's computer the data appears clipped and generally wrong.
MicrosoftTeams-image (1)

On his computer we tested the code in jupyter notebook, spyder (Python 3.11.5) and Pycharm (Python 12), and obtained the same result. We both have the same ephyviewer version (1.6). The only warning raised is the following:

ephyviewer\Lib\site-packages\ephyviewer\traceviewer.py:332: RuntimeWarning: invalid value encountered in multiply data_curves *= total_gains[visibles, None]

We could reproduce the same error also with the simple example you provided. When we inspected how "data_curves" looks like at the line that throws the warning, we saw that it contained a nan value. If I understand this correctly, this shouldn't be there as the data in the example are randomly generated.

Could I ask you for your support in resolving this? Please let me know if I can provide any additional information.

creating a spike view within the analog signal view

Hello
following a suggestion from Jeffrey Gill, I post the following request for anew feature in ephyviewer

the idea is to use ephyviewer to check my spikes after clustercutting, and compare results using different algorhythms available. TO do so I can just plot the filtered analog signal from the probe and overlay the spikes waveforms at the exact times they got detected.

this would look like what is seen on the peeler window in tridesclous
(https://tridesclous.readthedocs.io/en/latest/step_by_step.html, step 5)

or the phy gui trace view
(https://phy.readthedocs.io/en/latest/visualization/)

Pierre-Pascal

Random GitHub Actions test failures

Every once in a while, seemingly at random, we get GitHub Actions test failures with inscrutable segmentation faults, or errors like this one:

Traceback (most recent call last):
  File "<string>", line 1, in <module>
  File "/home/runner/work/ephyviewer/ephyviewer/ephyviewer/tests/testing_tools.py", line 9, in <module>
    import matplotlib.pyplot as plt
  File "/opt/hostedtoolcache/Python/3.9.6/x64/lib/python3.9/site-packages/shiboken2/files.dir/shibokensupport/__feature__.py", line 142, in _import
    return original_import(name, *args, **kwargs)
  File "/opt/hostedtoolcache/Python/3.9.6/x64/lib/python3.9/site-packages/matplotlib/pyplot.py", line 2500, in <module>
    switch_backend(rcParams["backend"])
  File "/opt/hostedtoolcache/Python/3.9.6/x64/lib/python3.9/site-packages/matplotlib/pyplot.py", line 285, in switch_backend
    raise ImportError(
ImportError: Cannot load backend 'Qt5Agg' which requires the 'qt5' interactive framework, as 'headless' is currently running

If the test suite is rerun, it passes. This is strange and annoying.

Reduce size of widgets' title bars

Hi!

When displaying many views at the same time a lot of space is taken by the title bars (at least on Ubuntu):

image

Do you know if there Is any way to have control over this? Or even remove the titlebars altogether?
After this I tried the following but it doesn't work:

view = ephyviewer.SpikeTrainViewer()
from ephyviewer import QT
view.setWindowFlag(QT.Qt.FramelessWindowHint)

Thanks!

Standalone app's File > Open action fails if a file was already opened

Thanks to @munrokrulle for reporting.

When the standalone app is first launched, StandAloneViewer (a subclass of MainViewer) presents the user with a File > Open menu action. This menu action remains available after a file has been selected and the StandAloneViewer has been populated with viewers. Using the menu action a second time to load a second file fails with this error: AssertionError: Viewer already in MainViewer. This occurs because compose_mainviewer_from_sources() is trying to populate the original StandAloneViewer a second time with viewers that already exist.

I can imagine 3 alternatives for handling this:

  1. Remove the menu action after the first file is loaded, so that the option to load a second file is not available. To view another file, users would have to launch another instance of the app (e.g., from a second console window, or by first closing the original instance, or by running each instance as a background process).
  2. Remove all viewers from the original StandAloneViewer before repopulating it with viewers showing the new file contents, so that only one file can be viewed at a time. I think that's what this "TODO" was suggesting.
  3. Spawn a new StandAloneViewer each time a file is opened, so that multiple files can be open in different windows.

My preference would be option 3 since it's the most versatile for users. I don't think this will be more difficult to implement than what I have already done for neurotic (see this, this, this, and this). @samuelgarcia, do you have a preference?

Test failures with Matplotlib 3.9

There are 3 test failures due to the use of deprecated-in-3.7/removed-in-3.9 API; see https://matplotlib.org/stable/api/prev_api_changes/api_changes_3.7.0.html#deprecation-of-top-level-cmap-registration-and-access-functions-in-mpl-cm for more information.

______________________________ test_EpochEncoder _______________________________

interactive = False

    def test_EpochEncoder(interactive=False):
        possible_labels = ['AAA', 'BBB', 'CCC', 'DDD']
    
        ep_times = np.arange(0, 10., .5)
        ep_durations = np.ones(ep_times.shape) * .25
        ep_labels = np.random.choice(possible_labels, ep_times.size)
        epoch = { 'time':ep_times, 'duration':ep_durations, 'label':ep_labels, 'name': 'MyFactor' }
    
>       source = WritableEpochSource(epoch=epoch, possible_labels=possible_labels)

ephyviewer/tests/test_epochencoder.py:14: 
_ _ _ _ _ _ _ _ _ _ _ _ _ _ _ _ _ _ _ _ _ _ _ _ _ _ _ _ _ _ _ _ _ _ _ _ _ _ _ _ 

self = <ephyviewer.datasource.epochs.WritableEpochSource object at 0x7ff8e059cd40>
epoch = {'duration': array([0.25, 0.25, 0.25, 0.25, 0.25, 0.25, 0.25, 0.25, 0.25, 0.25, 0.25,
       0.25, 0.25, 0.25, 0.25, 0...', 'AAA', 'DDD', 'BBB', 'BBB', 'BBB', 'CCC', 'BBB', 'BBB',
       'AAA', 'DDD'], dtype='<U3'), 'name': 'MyFactor', ...}
possible_labels = ['AAA', 'BBB', 'CCC', 'DDD'], color_labels = None
channel_name = '', restrict_to_possible_labels = False

    def __init__(self, epoch=None, possible_labels=[], color_labels=None, channel_name='', restrict_to_possible_labels=False):
    
        self.possible_labels = possible_labels
        self.channel_name = channel_name
    
        if epoch is None:
            epoch = self.load()
    
        InMemoryEpochSource.__init__(self, all_epochs=[epoch])
    
        # assign each epoch a fixed, unique integer id
        self._next_id = 0
        for chan in self.all:
            chan['id'] = np.arange(self._next_id, self._next_id + len(chan['time']))
            self._next_id += len(chan['time'])
    
        assert self.all[0]['time'].dtype.kind=='f'
        assert self.all[0]['duration'].dtype.kind=='f'
    
        # add labels missing from possible_labels but found in epoch data
        new_labels_from_data = list(set(epoch['label'])-set(self.possible_labels))
        if restrict_to_possible_labels:
            assert len(new_labels_from_data)==0, f'epoch data contains labels not found in possible_labels: {new_labels_from_data}'
        self.possible_labels += new_labels_from_data
    
        # put the epochs into a canonical order after loading
        self._clean_and_set(self.all[0]['time'], self.all[0]['duration'], self.all[0]['label'], self.all[0]['id'])
    
        # TODO: colors should be managed directly by EpochEncoder
        if color_labels is None:
            n = len(self.possible_labels)
>           cmap = matplotlib.cm.get_cmap('Dark2' , n)
E           AttributeError: module 'matplotlib.cm' has no attribute 'get_cmap'

ephyviewer/datasource/epochs.py:89: AttributeError
__________________________ test_EpochEncoder_settings __________________________

interactive = False

    def test_EpochEncoder_settings(interactive=False):
        possible_labels = ['AAA', 'BBB', 'CCC', 'DDD']
    
        ep_times = np.arange(0, 10., .5)
        ep_durations = np.ones(ep_times.shape) * .25
        ep_labels = np.random.choice(possible_labels, ep_times.size)
        epoch = { 'time':ep_times, 'duration':ep_durations, 'label':ep_labels, 'name': 'MyFactor' }
    
>       source = WritableEpochSource(epoch=epoch, possible_labels=possible_labels)

ephyviewer/tests/test_epochencoder.py:38: 
_ _ _ _ _ _ _ _ _ _ _ _ _ _ _ _ _ _ _ _ _ _ _ _ _ _ _ _ _ _ _ _ _ _ _ _ _ _ _ _ 

self = <ephyviewer.datasource.epochs.WritableEpochSource object at 0x7ff8e059da00>
epoch = {'duration': array([0.25, 0.25, 0.25, 0.25, 0.25, 0.25, 0.25, 0.25, 0.25, 0.25, 0.25,
       0.25, 0.25, 0.25, 0.25, 0...', 'DDD', 'DDD', 'AAA', 'BBB', 'DDD', 'CCC', 'DDD', 'DDD',
       'AAA', 'DDD'], dtype='<U3'), 'name': 'MyFactor', ...}
possible_labels = ['AAA', 'BBB', 'CCC', 'DDD'], color_labels = None
channel_name = '', restrict_to_possible_labels = False

    def __init__(self, epoch=None, possible_labels=[], color_labels=None, channel_name='', restrict_to_possible_labels=False):
    
        self.possible_labels = possible_labels
        self.channel_name = channel_name
    
        if epoch is None:
            epoch = self.load()
    
        InMemoryEpochSource.__init__(self, all_epochs=[epoch])
    
        # assign each epoch a fixed, unique integer id
        self._next_id = 0
        for chan in self.all:
            chan['id'] = np.arange(self._next_id, self._next_id + len(chan['time']))
            self._next_id += len(chan['time'])
    
        assert self.all[0]['time'].dtype.kind=='f'
        assert self.all[0]['duration'].dtype.kind=='f'
    
        # add labels missing from possible_labels but found in epoch data
        new_labels_from_data = list(set(epoch['label'])-set(self.possible_labels))
        if restrict_to_possible_labels:
            assert len(new_labels_from_data)==0, f'epoch data contains labels not found in possible_labels: {new_labels_from_data}'
        self.possible_labels += new_labels_from_data
    
        # put the epochs into a canonical order after loading
        self._clean_and_set(self.all[0]['time'], self.all[0]['duration'], self.all[0]['label'], self.all[0]['id'])
    
        # TODO: colors should be managed directly by EpochEncoder
        if color_labels is None:
            n = len(self.possible_labels)
>           cmap = matplotlib.cm.get_cmap('Dark2' , n)
E           AttributeError: module 'matplotlib.cm' has no attribute 'get_cmap'

ephyviewer/datasource/epochs.py:89: AttributeError
___________________________ test_EpochEncoder_empty ____________________________

interactive = False

    def test_EpochEncoder_empty(interactive=False):
        possible_labels = ['AAA', 'BBB', 'CCC', 'DDD']
    
>       source = WritableEpochSource(epoch=None, possible_labels=possible_labels)

ephyviewer/tests/test_epochencoder.py:57: 
_ _ _ _ _ _ _ _ _ _ _ _ _ _ _ _ _ _ _ _ _ _ _ _ _ _ _ _ _ _ _ _ _ _ _ _ _ _ _ _ 

self = <ephyviewer.datasource.epochs.WritableEpochSource object at 0x7ff8e059d640>
epoch = {'duration': array([], dtype=float64), 'id': array([], dtype=int64), 'label': array([], dtype='<U3'), 'name': '', ...}
possible_labels = ['AAA', 'BBB', 'CCC', 'DDD'], color_labels = None
channel_name = '', restrict_to_possible_labels = False

    def __init__(self, epoch=None, possible_labels=[], color_labels=None, channel_name='', restrict_to_possible_labels=False):
    
        self.possible_labels = possible_labels
        self.channel_name = channel_name
    
        if epoch is None:
            epoch = self.load()
    
        InMemoryEpochSource.__init__(self, all_epochs=[epoch])
    
        # assign each epoch a fixed, unique integer id
        self._next_id = 0
        for chan in self.all:
            chan['id'] = np.arange(self._next_id, self._next_id + len(chan['time']))
            self._next_id += len(chan['time'])
    
        assert self.all[0]['time'].dtype.kind=='f'
        assert self.all[0]['duration'].dtype.kind=='f'
    
        # add labels missing from possible_labels but found in epoch data
        new_labels_from_data = list(set(epoch['label'])-set(self.possible_labels))
        if restrict_to_possible_labels:
            assert len(new_labels_from_data)==0, f'epoch data contains labels not found in possible_labels: {new_labels_from_data}'
        self.possible_labels += new_labels_from_data
    
        # put the epochs into a canonical order after loading
        self._clean_and_set(self.all[0]['time'], self.all[0]['duration'], self.all[0]['label'], self.all[0]['id'])
    
        # TODO: colors should be managed directly by EpochEncoder
        if color_labels is None:
            n = len(self.possible_labels)
>           cmap = matplotlib.cm.get_cmap('Dark2' , n)
E           AttributeError: module 'matplotlib.cm' has no attribute 'get_cmap'

ephyviewer/datasource/epochs.py:89: AttributeError

conda-forge recipe

Hey @samuelgarcia, I'm thinking about creating a conda-forge recipe for ephyviewer. I haven't made one before, but it seems pretty easy. Do you have any objections?

Easier creation of ephyviewer data sources from Neo objects

For users whose data is readable by existing Neo RawIO classes, ephyviewer/datasource/neosource.py makes it easy to get ephyviewer up and running quickly.

However, for some data formats there does not yet exist an appropriate Neo RawIO class (even if there is a Neo IO class). In these cases, neosource.py cannot help users.

This is true even if the data has already been loaded as Neo objects through other means, such as using existing Neo IO (non-Raw) classes or by building the objects manually.

In these cases, it would be great if ephyviewer provided a few simple functions for creating ephyviewer data sources from Neo objects in memory. This would improve interoperability between the two projects.

Since I found myself falling into this scenario repeatedly, I created a simple module containing functions that perform these roles:

https://gist.github.com/jpgill86/32f8ebed47f86c1a3d417b017223f533

For example, the module includes a function that takes a Neo Segment as its input and outputs a dictionary containing ephyviewer data sources for analog signals, epochs, events, and spike trains.

I think it would be very useful to add this functionality or something similar to ephyviewer, and I would happily contribute the code I've already written.

What do you think?

release ?

Hi @jpgill86.
What do you think about a release soon of ephyviewer. You have done many improvement, we should release it.

Do you have any plane for orthyer improvement in June ?

I still want to fix icon integration and will do soon!!!!

Automatic Color

Is there a way to call "on_automatic_color" in source code? I currently use:

Out[24]:
[<PyQt5.QtWidgets.QVBoxLayout at 0x7ffc90d92700>,
 <pyqtgraph.widgets.GraphicsView.GraphicsView at 0x7ffc90da3160>,
 <ephyviewer.traceviewer.TraceViewer_ParamController at 0x7ffc90da3430>,
 <PyQt5.QtCore.QThread at 0x7ffc802f29d0>]```

and then call:
```view1.children()[2].on_automatic_color()```

Is there a different way to call this? Thanks!

Test that packaging via wheel and source tarball work and that both are installable

To avoid problems like this, we should add a test to this repo that

  1. Builds ephyviewer as a wheel, installs from the wheel, and tests that ephyviewer can be imported from that installation (make sure to cd out of the git repo first), and
  2. Packages ephyviewer in a source tarball, installs from the tarball, and tests that ephyviewer can be imported (again, make sure to cd out of the git repo first).

Video playback performance and accuracy varies greatly between video files

I'm finding that for some of my video files, ephyviewer's VideoViewer works great and can play video at any speed pretty well. However, I also have video files for which this is not true at all. For these files, the video playback feature is broken in bizarre ways. I have speculations on why some of my files are different from others, but I am very uncertain.

My videos were captured using two different video capture software: QuickTime on Mac and Logitech Webcam Software on Windows. The MOV video files produced by QuickTime sometimes play well in ephyviewer, but not always. I haven't yet found an MP4 video file produced by the Logitech Webcam Software that does play well with ephyviewer.

The symptoms are rather strange. You can try it for yourself using this example, which includes two video clips with different video codecs exported from a much longer video captured using the Logitech software in MP4 format:

https://files.mycloud.com/home.php?brand=webfiles&seuuid=89b32c3fb1da5c38c54dffd6b01334e8&name=ephyviewer-bad-video-playback-ex

You can change which of the two clips are loaded by changing one line in the Python script.

For the MPEG4-encoded clip, and for the original H264-encoded video from which both examples were clipped (original not included in example):

After pressing the play button, the video will play correctly for an interval of about 2 seconds before freezing on one frame. After a total of exactly 10 seconds have elapsed, the video will resume playing, jumping to the correct part of the video, but again it plays for only a 2 second interval. This pattern repeats every 10 seconds. The video resumes playback temporarily at times that are multiples of 10 seconds, even if playback was started in the middle of a decade (e.g., if the slider is dragged to t = 15 seconds before the play button is pressed, the video will remain on a frozen frame until time 20 seconds, at which point it will play for a short 2 second interval).

If the speed of playback is increased, this pattern does not seem to change at all. If the speed is decreased, the interval of successful playback may increase to perhaps 4 seconds (the amount seems to vary with the speed reduction factor and differs between the two computers I've tested this on), but there will still be a long period of no playback, and the cycle still repeats at multiples of 10 seconds.

For the H264-encoded clip, but NOT for the original H264-encoded video:

990 seconds of empty black frames are prepended to the video. Playback starts at t = 990 seconds. After that, an 8-second interruption pattern occurs, similar to the one described above. I did not create these clips starting from t = 990 seconds in the original video, so I have no idea where this number comes from.

I've also seen other amounts of time prepended to unclipped videos originally captured as MOV files in QuickTime. For example, I have an MOV video that is about 30 minutes 25 seconds long. When I load it in ephyviewer, the slider has a total length of 3825 seconds, which is exactly 2000 seconds too long. The video doesn't start until exactly t = 2000 seconds; before that it is just black. When the slider is positioned sometime after 2000 seconds, the video can be played correctly, but this time without the periodic interruption pattern I've described. In cases like this where the interruption pattern is absent and the shift in start time is the only anomaly, I can work around the problem by introducing a corrective time shift:

video_offset = -2000 # seconds
video_source.t_starts[0] += video_offset
video_source.t_stops[0]  += video_offset

However, this is of course not ideal. The extra time is moved to the end, and, besides, in most cases the interruption pattern is present.

I have hundreds of videos, so although I have dedicated many, many hours to trying to understand what's going on, I've only tested a handful of videos in that time! The symptoms might be even more varied than I'm reporting, and it's possible that the breakdown in playback performance has nothing to do with which video capture software I used.

However, it still seems reasonable to expect that video format/encoding has something to do with the problem. I have spent hours using two different video conversion programs trying to find a way to fix playback for my videos which are not playing well with ephyviewer, but I haven't found a solution yet. In fact, I wanted to include in my example an excerpt from a video which works perfectly for comparison, but the software I'm using to cut my multi-gigabyte file down to a 40 second clip induces the irregular playback issue in the exported file.

I am not very expert in video encoding formats, so I'm mostly guessing in the dark here (haha). I thought that perhaps this was an issue with PyAV's efficiency in playing certain compression formats, but then I noticed that both my original, uncut MOV and MP4 files -- some of which work flawlessly and others which do not -- use the same "Codec: H264 - MPEG-4 AVC (part 10) (avc1)" (according to VLC). Furthermore, of the two clips in my example, it's the one converted to "Codec: MPEG-4 Video (mp4v)" that actually works a little better. I'm not sure what actually makes some files work and others not. What's more, I'm not sure that odd behavior like the addition of hundreds of seconds of blank frames at the start of the video can be attributed solely to inefficient decoding algorithms!

If you can provide any insight into this problem, or if you know of a reliable format that works for you that I could convert my video files to, I would be incredibly grateful. ephyviewer is the perfect tool for the video and electrophys data analysis I want to do, and this video playback issue is the only thing holding me back right now!

[TypeError: 'method' object is not connected] when I try to call TimeFreqViewer

Hello,

First of all thanks for the great library you provide us!

I wrote a script to create my viewer where I visualize: raw traces, filtered traces and time frequency plots of the selected traces.
Months ago, when I actually wrote the script, it worked perfectly.
Today I reopen the script to show it to a new student of the lab and of course it crashes.

I use Spyder4 with Python 3.7 on Windows.
Epyviewer version 1.3.1

The relevant part of the script is the following:

sample_rate = 20000.
 t_start = 0.
 nb_channel = 16
  
 sigs= np.fromfile(raw_filename, dtype='float64').reshape(-1, nb_channel)
 sigs/= 1e6 # put in uV
 source_sig = InMemoryAnalogSignalSource(sigs, sample_rate, t_start)
 view3 = TimeFreqViewer(source=source_sig, name='tfr')

When I run that last line I get the following error:

Traceback (most recent call last):

File "C:\Users\F.LARENO-FACCINI\Anaconda3\lib\site-packages\ephyviewer\timefreqviewer.py", line 313, in on_param_change
self.create_grid()

File "C:\Users\F.LARENO-FACCINI\Anaconda3\lib\site-packages\ephyviewer\timefreqviewer.py", line 321, in create_grid
ViewBoxClass=MyViewBox, vb_params={})

File "C:\Users\F.LARENO-FACCINI\Anaconda3\lib\site-packages\ephyviewer\tools.py", line 58, in create_plot_grid
graphiclayout.clear()

File "C:\Users\F.LARENO-FACCINI\Anaconda3\lib\site-packages\pyqtgraph\graphicsItems\GraphicsLayout.py", line 172, in clear
self.removeItem(i)

File "C:\Users\F.LARENO-FACCINI\Anaconda3\lib\site-packages\pyqtgraph\graphicsItems\GraphicsLayout.py", line 165, in removeItem
item.geometryChanged.disconnect(self._updateItemBorder)

TypeError: 'method' object is not connected

I tried to research this type of error but I couldn't find any relevant information.
Thank you for any help you can give me!

Cheers,
Federica

Multi Segment integration

Here a thread to discuss how to integrate multi segment in ephyviewer.

Some user have have multi segment dataset.
The way it is built is that one window = one segment.
Some times it is not very convinient to open and close for each segment.

If we want all segment in one window, we can have several apporach:

  1. make source "aggregator", if t_start are correctly distributed along time without overlap between segment
    we could have a source that would aggrgate several other sources.
  2. we could have explicit segment swap in he main window (like a combo box that would switch all viewer to the next segment).

Both approach represent some work. This is why I open the discussion.

Jeffrey : what do you think ?

@jpgill86

EpochEncoder enhancements

The EpochEncoder allows users to mark blocks of time with labels by creating epochs. In its current form, there can be only one label for any given time, i.e., labels are mutually exclusive. This is useful for marking periods that can be classified as belonging to only one state, e.g., a visual stimulus is one color or another.

However, the mutual exclusivity of labels limits the utility of the EpochEncoder in other situations. For example, it would be useful to be able to bracket the beginning and end of a repeated behavior as well as phases within each behavior, such as inhalation and exhalation in respiratory cycles, or stance and swing in gait cycles.

This can be accomplished now by creating separate EpochEncoders for each set of mutually exclusive states, such as a first EpochEncoder to mark each cycle of a repeated behavior, and a second EpochEncoder to mark phases within each behavior. However, this clunky workaround wastes a lot of screen real estate, since the EpochEncoder's controls and built in EpochViewer take up a lot of space.

I propose enhancing the EpochEncoder by allowing it to handle both mutually exclusive and non-mutually exclusive sets of labels, so that epochs could be created that overlap in time. I can think of a couple ways this could be implemented, and I'm interested in feedback on what seems best.

First, this check in WritableEpochSource that loaded epochs do not overlap would need to be removed.

Next, a method for controlling when mutual exclusivity should be enforced needs to be designed. A simple solution would be to implement something like a modifier key for controlling this behavior: When shortcut keys are used to assign labels, holding Shift toggles mutual exclusivity. For example, pressing a shortcut key without holding Shift would delete all existing epochs in the range when creating the new epoch (current behavior); pressing the shortcut key while holding Shift would create the new epoch without deleting existing epochs in the range. A checkbox in the global options could allow this logic to be reversed and to control the behavior of the Apply button.

A more complex approach would be to allow the user to create pre-defined sets of mutually exclusive labels. For example, a first set of labels could contain "Behavior Type 1" and "Behavior Type 2"; a second set of labels could contain "Behavior Type 1 Phase 1", "Behavior Type 1 Phase 2", etc. Users could specify these sets by passing a 2D list of lists of strings to the possible_labels parameter, rather than a 1D list of strings. Additional enhancements to the GUI could allow users to reorganize these sets on the fly. (EDIT: After implementing the simpler solution of toggling mutual exclusivity with Shift or a button and finding that it works well, I think this more complex solution feels like overkill. It's unlikely that I will try implementing it soon, but I'll keep it on the list.)

These two approaches could be combined for maximum flexibility.

If overlapping epochs are allowed, the method of implementation could affect how the Fill Blank feature must function. If pre-defined sets of mutually exclusive labels are implemented and provided by the user, then the Fill Blank functionality could be applied to each set separately in the same way it currently functions. If only a modifier key functionality is implemented, Fill Blanks may need to be limited to filling just those periods of time where no epochs are defined (i.e., the true blanks).

The "flat" view mode would not be available for labels that can overlap, or would need to work differently.

For use cases such as marking phases of a repeated behavior, it would be helpful if the EpochEncoder allowed for epochs to be cloned with a new label, and for epochs to be divided into multiple new epochs. For example, if one respiratory cycle has already been marked in the EpochEncoder, its inhalation and exhalation phases could be easily marked by cloning the whole-cycle epoch and dividing it at the transition point between phases. This ensures that the boundaries of the phases and the whole cycle are aligned.

Relabeling and deleting individual epochs using the EpochEncoder would also be very useful. Finding particular epochs in the data table could be made easier if clicking on their rectangles in the plot automatically selected the corresponding entry in the table.

I think that most of the options currently exposed in the Global Options panel are changed rarely enough that the whole panel could be hidden and accessed instead by either double-clicking on the epoch viewer or by pressing the "Colors and keys" button (which could be renamed to "Options"). This would free up a lot of space on the screen. The exception is the new_epoch_step parameter; some users may change this value frequently, so it should be exposed on the main control panel.

Removal of the central panel could free up space and allow the control panel currently on the left to be reorganized, or the data table could be made larger. I don't have specific plans for this yet.

It also seems more natural to me to use the number keys as default shortcut keys for assigning labels, rather than an arbitrary selection of letter keys. I propose changing these.

To summarize, here is a list of features I'd like to add to EpochEncoder (EDIT: Updated based on conversation below and as features are implemented):

  • Fix numerical precision of epoch start and stop times
  • Assign numbers as default shortcut keys
  • Remove central Global Options panel and combine with "Colors and keys" popup
  • Remove assertion that epochs loaded from WritableEpochSource do not overlap
  • Add modifier key and global option for toggling exclusion of existing epochs when creating a new epoch
  • Add controls for epoch insertion mode (mutually exclusive or overlapping) to left panel
  • Add click on rectangle to select corresponding entry in data table
  • Add mechanism for relabeling existing epochs
  • Add mechanism for deleting individual epochs
  • Add mechanism for cloning epochs with new labels
  • Add mechanism for dividing epochs
  • Add controller for new_epoch_step parameter to left panel
  • Allow pre-defined sets of mutually exclusive labels
  • Allow on-the-fly reconfiguration of sets of mutually exclusive labels
  • Update Fill Blanks functionality for scenarios with overlapping epochs
  • Fix "flat" view mode when epochs overlap
  • Check that seek performance with lots of epochs is not too poor
  • Add assert_epoch_not_overlap_at_load
  • Add split at mouse cursor

I'm eager to hear what others think of these proposed changes, and if they have any suggestions for improvements.

viewer does not free console when closed (I use spyder)

Hi Guys
thanks for this cool library,
I am trying to use it throroughly and make my own viewer with it but it does not want to close properly when I run it and close the main window. I use Spyder and the commandline seems to try to "save_all_setting" and gets stuck there.
here is my code:

import matplotlib.pyplot as plt
from scipy import signal
import numpy as np
import ephyviewer
from ephyviewer import mkQApp, MainViewer, TraceViewer, TimeFreqViewer
from ephyviewer import InMemoryAnalogSignalSource

FilePth=(r"D:\SALOME\gad_cre_vir_hr2P8_Bis20190204\2019-02-04_18-16-17\Klusta")
FileNm=r'2019-02-04_18-16-17.dat'

get to the folder

os.chdir(str(FilePth))

SF=30000

reader=RawBinarySignalRawIO (filename=FileNm, dtype=u'int16', sampling_rate=SF, nb_channel=32)
reader.parse_header()
print (reader)
T1=0;
Tend=200;

data=reader.get_analogsignal_chunk(i_start = T1, i_stop = Tend*SF)
T=np.linspace(T1, Tend, len(data))
app = ephyviewer.mkQApp()

create a window

win = ephyviewer.MainViewer(debug=True, show_auto_scale = True)

source = InMemoryAnalogSignalSource(data, SF, T1) # why use a source by the way?

view1 = TraceViewer(source=source, name='trace')

#Parameters can be set in script
view1.params['scale_mode'] = 'same_for_all'
view1.params['display_labels'] = True
#view1.params['color'] = '#FFFEED'

view1.auto_scale()

win.add_view(view1)
win.show()

launch the app

app.exec_()

Error when using BinaryRecordingExtractor

Trying out the viewer from a saved Recording I get:

AttributeError                            Traceback (most recent call last)
/Users/loren/Src/NWB/notebooks/spyglass_sorting_devel.ipynb Cell 12' in <cell line: 2>()
      [1](vscode-notebook-cell:/Users/loren/Src/NWB/notebooks/spyglass_sorting_devel.ipynb#ch0000016?line=0) #plot the Recording
----> [2](vscode-notebook-cell:/Users/loren/Src/NWB/notebooks/spyglass_sorting_devel.ipynb#ch0000016?line=1) SpikeSortingRecording.view(recording_key)

File ~/Src/NWB/spyglass/src/spyglass/spikesorting/spikesorting_recording.py:495, in SpikeSortingRecording.view(key)
    [492](file:///Users/loren/Src/NWB/spyglass/src/spyglass/spikesorting/spikesorting_recording.py?line=491) app = ephyviewer.mkQApp()
    [493](file:///Users/loren/Src/NWB/spyglass/src/spyglass/spikesorting/spikesorting_recording.py?line=492) win = ephyviewer.MainViewer(debug=True, show_auto_scale=True)
--> [495](file:///Users/loren/Src/NWB/spyglass/src/spyglass/spikesorting/spikesorting_recording.py?line=494) view = ephyviewer.TraceViewer(source=recording, name=recording_name)
    [496](file:///Users/loren/Src/NWB/spyglass/src/spyglass/spikesorting/spikesorting_recording.py?line=495) win.add_view(view)
    [498](file:///Users/loren/Src/NWB/spyglass/src/spyglass/spikesorting/spikesorting_recording.py?line=497) win.show()

File ~/opt/anaconda3/envs/spyglass/lib/python3.8/site-packages/ephyviewer/traceviewer.py:431, in TraceViewer.__init__(self, useOpenGL, **kargs)
    [428](file:///Users/loren/opt/anaconda3/envs/spyglass/lib/python3.8/site-packages/ephyviewer/traceviewer.py?line=427) def __init__(self, useOpenGL=None, **kargs):
    [429](file:///Users/loren/opt/anaconda3/envs/spyglass/lib/python3.8/site-packages/ephyviewer/traceviewer.py?line=428)     BaseMultiChannelViewer.__init__(self, **kargs)
--> [431](file:///Users/loren/opt/anaconda3/envs/spyglass/lib/python3.8/site-packages/ephyviewer/traceviewer.py?line=430)     self.make_params()
    [433](file:///Users/loren/opt/anaconda3/envs/spyglass/lib/python3.8/site-packages/ephyviewer/traceviewer.py?line=432)     # useOpenGL=True eliminates the extremely poor performance associated
    [434](file:///Users/loren/opt/anaconda3/envs/spyglass/lib/python3.8/site-packages/ephyviewer/traceviewer.py?line=433)     # with TraceViewer's line_width > 1.0, but it also degrades overall
    [435](file:///Users/loren/opt/anaconda3/envs/spyglass/lib/python3.8/site-packages/ephyviewer/traceviewer.py?line=434)     # performance somewhat and is reportedly unstable
    [436](file:///Users/loren/opt/anaconda3/envs/spyglass/lib/python3.8/site-packages/ephyviewer/traceviewer.py?line=435)     self.set_layout(useOpenGL=useOpenGL)

File ~/opt/anaconda3/envs/spyglass/lib/python3.8/site-packages/ephyviewer/base.py:89, in BaseMultiChannelViewer.make_params(self)
     [86](file:///Users/loren/opt/anaconda3/envs/spyglass/lib/python3.8/site-packages/ephyviewer/base.py?line=85) def make_params(self):
     [87](file:///Users/loren/opt/anaconda3/envs/spyglass/lib/python3.8/site-packages/ephyviewer/base.py?line=86)     # Create parameters
     [88](file:///Users/loren/opt/anaconda3/envs/spyglass/lib/python3.8/site-packages/ephyviewer/base.py?line=87)     all = []
---> [89](file:///Users/loren/opt/anaconda3/envs/spyglass/lib/python3.8/site-packages/ephyviewer/base.py?line=88)     for i in range(self.source.nb_channel):
     [90](file:///Users/loren/opt/anaconda3/envs/spyglass/lib/python3.8/site-packages/ephyviewer/base.py?line=89)         #TODO add name, hadrware index, id
     [91](file:///Users/loren/opt/anaconda3/envs/spyglass/lib/python3.8/site-packages/ephyviewer/base.py?line=90)         name = 'ch{}'.format(i)
     [92](file:///Users/loren/opt/anaconda3/envs/spyglass/lib/python3.8/site-packages/ephyviewer/base.py?line=91)         children =[{'name': 'name', 'type': 'str', 'value': self.source.get_channel_name(i), 'readonly':True}]

AttributeError: 'BinaryRecordingExtractor' object has no attribute 'nb_channel'```

channel_indexes with AnalogSignalFromNeoRawIOSource and Neo 0.10.0

Hi @samuelgarcia,

I am starting to look more closely at #151. I have resisted upgrading to Neo 0.10.0 for months since I never fully understood the implications of switching to streams, and I never really looked at the code changes in #151. Now that an ephyviewer release is looming, I wanted to see if everything is OK, but I'm worried by what I've found.

In AnalogSignalFromNeoRawIOSource, you replaced channel_indexes with stream_index in the argument list for __init__. As far as I can tell, this means that channel indexes inside of a stream cannot be selected. In particular, get_chunk has no way to select a subset of channels within a stream.

Is this entirely intentional and necessary? Could we add an arugment to get_chunk (and maybe __init__ too) that lets a subset of channels be selected?

If this is not possible because of the way streams work in Neo 0.10.0, it is going to break a lot of my code. Perhaps you can help me understand whether I need to make fixes in the Neo reader that I built, AxographRawIO, or make changes elsewhere, like in neurotic.

With the release of Neo 0.10.0, I made no changes to AxographRawIO, apart from some generic changes you made. Presently, AxographRawIO always produces just one signal stream, since the stream ID '0' is hard-coded. This stream_id used to be called group_id. My understanding was that group_id, and stream_id still, are meant to differ when signals have different characteristics, like sampling rate, but otherwise it makes sense that signals share a group/stream ID. Since AxoGraph files only ever contain signals with uniform characteristics, I developed AxographRawIO with a hard-coded group/stream ID. I believe the example raw IO suggested these things too.

Now it seems that with the new changes to ephyviewer, I cannot select channels within a stream. For AxoGraph files, this means that all channels are always selected. Before, when channel_indexes existed in AnalogSignalFromNeoRawIOSource, I could select a subset of channels. Can we restore this capability?

Qt 6 support

This is a thread for discussion of adding Qt 6 support to ephyviewer.

Regarding documentation for QtPy, I found this docstring: https://github.com/spyder-ide/qtpy/blob/673fb93f5c126c6af1c2cb455da95c7e8b82cc62/qtpy/__init__.py#L9-L63

It seems from qtpy import QtGui, QtWidgets, QtCore will search for and import installed Qt interfaces in this order: PyQt5,
PySide2, PyQt4, PySide. As you pointed out, @samuelgarcia, there is an unmerged pull request to add PySide6 support (spyder-ide/qtpy#225).

I'm still not sure if from qtpy import QtGui, QtWidgets, QtCore automatically handles API changes between Qt 4 and 5. I tried to test this, but I can't even manage to create a working environment with PyQt4 or PySide for testing Qt 4. For some reason, both of these fail with unexplained package conflicts: conda create -n pyqt4 -c conda-forge pyqt=4 and conda create -n pyside -c conda-forge pyside. I'm having no better luck with pip. ¯\_(ツ)_/¯

Scatter plot colors change randomly when moving points

With pyqtgraph 0.11.1, animating a TraceViewer with scatter points results in this bizarre behavior (this example uses trace_viewer_with_marker.py):

randomly-changing-scatter-colors

The colors of points change randomly when the points are moved in any way. The colors should not change.

This buggy behavior was not present with pyqtgraph 0.11.0 and earlier.

I used git bisect on the pyqtgraph history and found the issue was introduced with pyqtgraph/pyqtgraph#1420, and more specifically the "Avoid unnecessary atlas rebuilds" commit (pyqtgraph/pyqtgraph@38e4f67) that was later squashed when the PR was merged.

I'm not entirely confident in my diagnosis, but I think the problem involves pyqtgraph's SymbolAtlas interacting poorly with TraceViewer regenerating QBrushes with every redraw somehow. If I set ScatterPlotItem's useCache option to False, the problem goes away, but naturally the plot becomes very slow if there are many points, so I don't want to do that.

I stumbled upon this and this, which address a different performance issue. On a hunch, I decided to try something similar in ephyviewer, and it seems to have solved the problem (#133). It simply involves caching the QBrushes before passing them off to pyqtgraph, so that they aren't destroyed with each redraw. I guess it preserves references to QBrushes that remain compatible with the SymbolAtlas cache indefinitely.

I think I will merge this fix into ephyviewer, but since I don't completely understand the underlying problem, I'm not sure whether to classify it as a bug fix for ephyviewer, or a workaround for a bug in pyqtgraph. The former seems more likely, but if it's the latter, I imagine the pyqtgraph people would want to know. @lidstrom83 and @j9ac9k, since you were both involved in pyqtgraph/pyqtgraph#1420, I'm tagging you here in case you have any interest in investigating further!

Poor plotting precision at long times

Traces plotted by the TraceViewer tend to get blocky for parts of the signal that occur at late times.

For example, in this 90-minute recording (sampled at 5000 Hz), the signals are plotted nice and smooth early in the record:

early-time

By 30 or 40 minutes, spikes start to become noticeably blocky:

middle-time

This gets worse the later we go (here 72 min):

late-time

The traces get smooth again if you jump back to the start of the recording, so it's not dependent on how long ephyviewer has been running.

If I slowly drag the right-mouse button to adjust the temporal zoom, the blocky edges of the plot jitter around:

zoom

This jittering seems to affect the x-coordinates of the points, but not the y-coordinates.

I haven't gone deep into debugging this yet, so I'm not sure what's wrong. I don't know if this is a problem isolated to ephyviewer, or if pyqtgraph has the same issue more generally.

My gut tells me this has something to do with x-coordinates of the points being calculated by the cumulative summation of the sampling period over the huge number of samples that have elapsed late in the record (in my example, by the 40 minute mark there have been 12 million samples). This could lead to accumulated floating point arithmetic errors. I'm not sure why zooming would matter though.

[macOS] EpochEncoder start/stop spin box values do not immediately update when "Set" buttons are pressed

This bug seems to affect macOS only. I have not observed it on Windows 10 or Ubuntu.

With the EpochEncoder's time range selector enabled, adjustments to the start and stop time made by moving the selection with the mouse or by using the keyboard shortcuts ("[" and "]") are immediately reflected in the times displayed in the spin boxes, as expected. However, if the "Set start >" or "Set stop >" buttons are clicked, the spin box values do not immediately update, even though the edges of the plotted range update and inserted epochs have the new times. The spin boxes will finally update when the mouse cursor is moved out of the control panel and into any plot area.

Custom viewer, trace, spikes, CSD

Dear devs

Thank you for updating the code! It works now. I thought about using ephyviewer routinely in my lab, but conventionally, we have used to a different layout for the viewer written in matlab, which is not supported in the current ephyviewer. Our layout contains traces, single units and CSD in the following way.

image

The units can be clustered (Klusta, SpykingCircus, Tridesclous)

I would really appreciate if you could suggest, how I can recreate the same layout the right way using ephyviewer. I can code and stuff. The CSD interface I can take from the elephant, and units - from spikeinterface.

Regards,
Mike

Trace labels poorly placed for raw sources with non-zero offset

Here's an Intan file (*.rhs) opened in raw mode in ephyviewer's standalone app, using IntanRawIO:

intan-1

And here are the labels and baselines for those traces, waaaaaaaaay down below (I changed ylim_min so they would be visible):

intan-2

I guess the Intan file format uses unsigned (positive) ints for storing data samples and provides a negative offset that represents the most negative possible value. The consequence is that ephyviewer decides to put the labels and baseline in a bad place.

This issue should arise for any RawIO that stores data with unsigned ints.

I think the fix that is needed is to calculate the location of the zero for each trace and place the labels and baselines there, rather than at the offset reported by the RawIO. I'll try to fix this soon.

Recommend Projects

  • React photo React

    A declarative, efficient, and flexible JavaScript library for building user interfaces.

  • Vue.js photo Vue.js

    🖖 Vue.js is a progressive, incrementally-adoptable JavaScript framework for building UI on the web.

  • Typescript photo Typescript

    TypeScript is a superset of JavaScript that compiles to clean JavaScript output.

  • TensorFlow photo TensorFlow

    An Open Source Machine Learning Framework for Everyone

  • Django photo Django

    The Web framework for perfectionists with deadlines.

  • D3 photo D3

    Bring data to life with SVG, Canvas and HTML. 📊📈🎉

Recommend Topics

  • javascript

    JavaScript (JS) is a lightweight interpreted programming language with first-class functions.

  • web

    Some thing interesting about web. New door for the world.

  • server

    A server is a program made to process requests and deliver data to clients.

  • Machine learning

    Machine learning is a way of modeling and interpreting data that allows a piece of software to respond intelligently.

  • Game

    Some thing interesting about game, make everyone happy.

Recommend Org

  • Facebook photo Facebook

    We are working to build community through open source technology. NB: members must have two-factor auth.

  • Microsoft photo Microsoft

    Open source projects and samples from Microsoft.

  • Google photo Google

    Google ❤️ Open Source for everyone.

  • D3 photo D3

    Data-Driven Documents codes.