Giter VIP home page Giter VIP logo

termplotlib's Introduction

termplotlib

PyPi Version PyPI pyversions GitHub stars PyPi downloads

gh-actions codecov LGTM Code style: black

termplotlib is a Python library for all your terminal plotting needs. It aims to work like matplotlib.

Line plots

For line plots, termplotlib relies on gnuplot. With that installed, the code

import termplotlib as tpl
import numpy as np

x = np.linspace(0, 2 * np.pi, 10)
y = np.sin(x)

fig = tpl.figure()
fig.plot(x, y, label="data", width=50, height=15)
fig.show()

produces

    1 +---------------------------------------+
  0.8 |    **     **                          |
  0.6 |   *         **           data ******* |
  0.4 | **                                    |
  0.2 |*              **                      |
    0 |                 **                    |
      |                                   *   |
 -0.2 |                   **            **    |
 -0.4 |                     **         *      |
 -0.6 |                              **       |
 -0.8 |                       **** **         |
   -1 +---------------------------------------+
      0     1    2     3     4     5    6     7

Horizontal histograms

import termplotlib as tpl
import numpy as np

rng = np.random.default_rng(123)
sample = rng.standard_normal(size=1000)
counts, bin_edges = np.histogram(sample)

fig = tpl.figure()
fig.hist(counts, bin_edges, orientation="horizontal", force_ascii=False)
fig.show()

produces

hist1

Horizontal bar charts are covered as well. This

import termplotlib as tpl

fig = tpl.figure()
fig.barh([3, 10, 5, 2], ["Cats", "Dogs", "Cows", "Geese"], force_ascii=True)
fig.show()

produces

Cats   [ 3]  ************
Dogs   [10]  ****************************************
Cows   [ 5]  ********************
Geese  [ 2]  ********

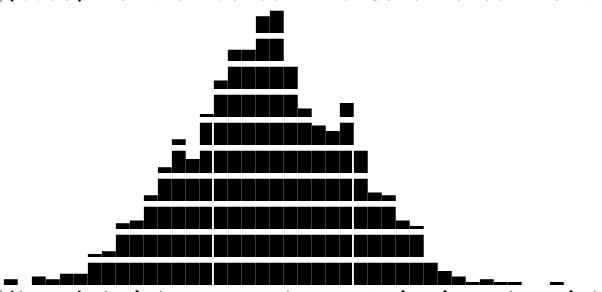
Vertical histograms

import termplotlib as tpl
import numpy as np

rng = np.random.default_rng(123)
sample = rng.standard_normal(size=1000)
counts, bin_edges = np.histogram(sample, bins=40)
fig = tpl.figure()
fig.hist(counts, bin_edges, grid=[15, 25], force_ascii=False)
fig.show()

produces

hist2

Tables

Support for tables has moved over to termtables.

Installation

termplotlib is available from the Python Package Index, so simply do

pip install termplotlib

to install.

Testing

To run the termplotlib unit tests, check out this repository and type

pytest

Similar projects

termplotlib's People

Contributors

fedeclaudi avatar nschloe avatar pymonger avatar tgandor avatar zzz4zzz avatar

Stargazers

 avatar  avatar  avatar  avatar  avatar  avatar  avatar  avatar  avatar  avatar  avatar  avatar  avatar  avatar  avatar  avatar  avatar  avatar  avatar  avatar  avatar  avatar  avatar  avatar  avatar  avatar  avatar  avatar  avatar  avatar  avatar  avatar  avatar  avatar  avatar  avatar  avatar  avatar  avatar  avatar  avatar  avatar  avatar  avatar  avatar  avatar  avatar  avatar  avatar  avatar  avatar  avatar  avatar  avatar  avatar  avatar  avatar  avatar  avatar  avatar  avatar  avatar  avatar  avatar  avatar  avatar  avatar  avatar  avatar  avatar  avatar  avatar  avatar  avatar  avatar  avatar  avatar  avatar  avatar  avatar  avatar  avatar  avatar  avatar  avatar  avatar  avatar  avatar  avatar  avatar  avatar  avatar  avatar  avatar  avatar  avatar  avatar  avatar  avatar  avatar

Watchers

 avatar  avatar  avatar  avatar  avatar  avatar  avatar  avatar  avatar  avatar

termplotlib's Issues

Displays meaningless numbers when NaNs are present

NaNs seem to mess up asciiplotlib
The following:

import asciiplotlib as apl
from numpy import arange

fig = apl.figure()
fig.plot([100,101,102,103,104], [0,1,float("nan"), float("nan"),4])
fig.show()

Produces:

  120 +-----------+----------+-----------+----------+----------+-----------+
      |                                                                    |
      |                                                                    |
  100 +*******                                                             +
      |  **** ****                                                         |
      |      ***  ****                                                     |
   80 +         ****  ****                                                 +
      |             ****  ****                                             |
      |                 ***   ****                                         |
   60 +                    ****   ***                                      +
      |                        ***   ****                                  |
      |                           ****   ****                              |
      |                               ***    ****                          |
   40 +                                  ****    ****                      +
      |                                      ***     ****                  |
      |                                         ****     ****              |
   20 +                                             ****     ****          +
      |                                                 ***      *         |
      |                                                    ****   *        |
    0 +-----------+----------+-----------+----------+----------**----------+
      0           20         40          60         80        100         120

Interestingly, the x values affect the behavior, too. Using [0,1,2,3,4] for x instead produces a much more innocent-looking plot. Very strange.

widht and height arguments of plot non working?

Hello, I just discovered this lib, this is very useful for servers without graphical interface! thanks a lot for the work.

I just can't make the widht and height arguments of plot function work :

(python 3.7.3)

>>> prof
array([-2.        , -2.        , -1.77777778, -1.77777778, -1.55555556,
       -1.55555556, -1.33333333, -1.33333333, -1.11111111, -1.11111111,
       -0.88888889, -0.88888889, -0.66666667, -0.66666667, -0.44444444,
       -0.44444444, -0.22222222, -0.22222222, -0.        , -0.        ,
        0.        ,  0.        ,  0.22222222,  0.22222222,  0.44444444,
        0.44444444,  0.66666667,  0.66666667,  0.88888889,  0.88888889,
        1.11111111,  1.11111111,  1.33333333,  1.33333333,  1.55555556,
        1.55555556,  1.77777778,  1.77777778,  2.        ,  2.        ])
>>> fig = tplt.figure()
>>> fig.plot(range(len(prof)), prof, width=len(prof), height=20)
>>> fig.show()

    2 +--------+-------+--------+--------+-------+--------+-------+----***-+
      |                                                            ****    |
  1.5 +                                                         ***        +
      |                                                     ****           |
      |                                                  ***               |
    1 +                                               ***                  +
      |                                           ****                     |
  0.5 +                                        ***                         +
      |                                    ****                            |
    0 +                              ******                                +
      |                             *                                      |
      |                          ***                                       |
 -0.5 +                      ****                                          +
      |                   ***                                              |
   -1 +                ***                                                 +
      |            ****                                                    |
      |         ***                                                        |
 -1.5 +     ****                                                           +
      |  ***                                                               |
   -2 ***------+-------+--------+--------+-------+--------+-------+--------+
      0        5       10       15       20      25       30      35       40

It seems that the plot uses the defaut values for widht and height of the figure. Maybe I did something wrong?

Suggestion

Fun library :) This makes the plot a little cleaner

# -*- coding: utf-8 -*-
#
import subprocess


def plot(
    x,
    y,
    width=80,
    height=25,
    label=None,
    xlim=None,
    ylim=None,
    xlabel=None,
    title=None,
    extra_gnuplot_arguments=None,
):
    p = subprocess.Popen(
        ["gnuplot"],
        stdout=subprocess.PIPE,
        stdin=subprocess.PIPE,
        stderr=subprocess.PIPE,
    )

    gnuplot_input = ["set term dumb mono {},{} aspect 1".format(width, height), "set tics nomirror scale 0.5"]

    if xlim:
        gnuplot_input.append("set xrange [{}:{}]".format(xlim[0], xlim[1]))

    if ylim:
        gnuplot_input.append("set yrange [{}:{}]".format(ylim[0], ylim[1]))

    if xlabel:
        gnuplot_input.append('set xlabel "{}"'.format(xlabel))

    if title:
        gnuplot_input.append('set title "{}"'.format(title))

    if extra_gnuplot_arguments:
        gnuplot_input += extra_gnuplot_arguments

    string = "plot '-' w lines"
    if label:
        string += " title '{}'".format(label)

    gnuplot_input.append(string)

    for xx, yy in zip(x, y):
        gnuplot_input.append("{:e} {:e}".format(xx, yy))
    gnuplot_input.append("e")

    out = p.communicate(input="\n".join(gnuplot_input).encode())[0]

    return out.decode().split("\n")

horizontal lines

The following code:

import termplotlib as tpl
import numpy
 
numpy.random.seed(123)
sample = numpy.random.normal(size=1000)
counts, bin_edges = numpy.histogram(sample, bins=40)
fig = tpl.figure()
fig.hist(counts, bin_edges, grid=[15, 25], force_ascii=False, bins=60)
fig.show()

produces this with horizontal lines crossing:

Screen Shot 2020-10-01 at 9 17 34 PM

I'm on Mac OS Catalina 10.15 using the standard bash shell with UTF-8 encoding, with SF Mono Regular 11 pt font (which I believe is the default).

width = max([len(line) for c in self._content for line in c]) No content in figure

import termplotlib as tpl
import numpy

x = numpy.linspace(0, 2 * numpy.pi, 10)
y = numpy.sin(x)

fig = tpl.figure()
fig.plot(x, y, label="data", width=50, height=15)
fig.show()

after run this piece of code ,there are error ,

if self._width is None:
---> 33             width = max([len(line) for c in self._content for line in c])
     34             width += padding_lr
     35         else:

did you come up with this problem?

Enable setting format of x and y tick labels

When having X values in the millions, Gnuplot likes to switch to scientific notation.
This can be changed via set format x '%.0f'. But asciplotlib.plot.plot() function has no room
to pass such a setting to Gnuplot.

I see two possible scenarios to add it:

  • add a format argument (dict, e.g. `{'x': '%0.f', 'y': ''} - which means x as "integers", and no numbers - just ticks, on the y axis).
  • add a extra argument with arbitrary Gnuplot scripts (["set format y '%0.f'", "set format x '']).

B is more versatile, but hackish, A is a single feature, but arguably consistent with existing arguments of label, xlim, xlabel etc.

[Question] Figure as string?

How can I capture the fig.show() as a string? I need to transport the ASCII table somewhere else, can't just live in my console.

Is this possible?

Handle strings in horizontal histogram bins

Hello,
thank you for making this.

Long story:

In my use case I had a Pandas dataframe (DF) containing 1 panda series.
This series had been created by resample a two series DF with dates and occurrences

The resampling is like an histogram binning: it add all occurrences by frequency.
e.g (series with dates as index):

12:00 -> 17
12:30 -> 21
13:00 -> 11

(^this is greatly simplified)

TL;DR

I want to have something like this:

2020-04-11 23:00:00  [  28]  ▎
2020-04-11 23:30:00  [  29]  ▎
2020-04-12 00:00:00  [1299]  █████████████▌
2020-04-12 00:30:00  [2637]  ███████████████████████████▍
2020-04-12 01:00:00  [ 996]  ██████████▍
2020-04-12 01:30:00  [ 404]  ████▎
2020-04-12 02:00:00  [ 557]  █████▊

or something like that
And maybe be able to format dates

What I changed

In my code I needed to change this line

"{:+.2e} - {:+.2e}".format(bin_edges[k], bin_edges[k + 1])

to this:

    if show_bin_edges:
        if type(bin_edges[0]) != int:
            labels = [str(d) for d in bin_edges]
        else:
            labels = [
                "{:+.2e} - {:+.2e}".format(bin_edges[k], bin_edges[k + 1])
                for k in range(len(bin_edges) - 1)
            ]

(I find it more readable to have just one side of the interval btw)

Advantage:

I could provide termplotlib.figure.hist()
these equal length "lists":

counts = DF.series # ≡ list of occurences (or int list)
bin_edges = DF.series.index # ≡ list of dates

Feature request

Handle any types of bins dates (e.g. python datetimes; numpy datetimes64, ...) and their formats ?

As this might be too painful I think the str() could do most of it.

Thank you for reading
Regards

IndexError: list index out of range error in vertical hist

Amazing lib thanx alot @nschloe !

I am facing the following error (I am also pasting the arrays i am using for histogram and bins that might help you i guess):

Traceback (most recent call last):
  File "paura_lite.py", line 30, in <module>
    fig.hist(X2, freqs2, grid=[25, 25], force_ascii=False)
  File "/usr/local/lib/python3.6/site-packages/termplotlib/figure.py", line 56, in hist
    self._content.append(hist(*args, **kwargs))
  File "/usr/local/lib/python3.6/site-packages/termplotlib/hist.py", line 22, in hist
    force_ascii=force_ascii,
  File "/usr/local/lib/python3.6/site-packages/termplotlib/hist.py", line 123, in hist_vertical
    if row[pos] == 8 and (pos + 1 == len(row) or row[pos + 1] > 0):
IndexError: list index out of range

X2 and freqs2 are respectively (plotting the same arrays with either plot or horizontal histogram works just fine fyi

[124.41883839  35.41717879  31.53559882  28.65272995  21.51772978
  18.91799348  17.13384018  16.4547271   15.12907567  12.27610031
  12.89634676  10.55464499  10.1385237    9.76782805   8.12663877
   7.21406045   5.71375229   4.28627088   3.3031431    2.84735662]
[   0.  200.  400.  600.  800. 1000. 1200. 1400. 1600. 1800. 2000. 2200.
 2400. 2600. 2800. 3000. 3200. 3400. 3600. 3800. 4000.]

FileNotFoundError: [WinError 2] The system cannot find the file specified

Dear nschloe, your lib sounds nice!
I got a different error in that code..
Any idea?

Traceback (most recent call last):
  File ".\app.py", line 51, in <module>
    fig.plot(x, y)
  File "mypath\env\lib\site-packages\termplotlib\figure.py", line 64, in plot
    self._content.append(plot(*args, **kwargs))
  File "mypath\env\lib\site-packages\termplotlib\plot.py", line 22, in plot
    stderr=subprocess.PIPE,
  File "mypath\appdata\local\programs\python\python37\Lib\subprocess.py", line 800, in __init__
    restore_signals, start_new_session)
  File "mypath\appdata\local\programs\python\python37\Lib\subprocess.py", line 1207, in _execute_child
    startupinfo)
FileNotFoundError: [WinError 2] The system cannot find the file specified

Add suppport for scatter plot

Hi,
Can you set the plotting type by a parameter rather than
plot_command="plot '-' w lines" ?

I'd like to use plot_command="plot '-' w points" to draw X,Y scatter plots.

Thanks !

barh() all zero vals results in ZeroDivisionError

import termplotlib
fig = termplotlib.figure()
fig.barh([0, 0], ['Eggs', 'Dogs'])

Results in

  File "/home/jo/.local/lib/python3.9/site-packages/termplotlib/figure.py", line 62, in barh
    self._content.append(barh(*args, **kwargs))
  File "/home/jo/.local/lib/python3.9/site-packages/termplotlib/barh.py", line 25, in barh
    matrix = _get_matrix_of_eighths(vals, max_width, bar_width)
  File "/home/jo/.local/lib/python3.9/site-packages/termplotlib/barh.py", line 76, in _get_matrix_of_eighths
    eighths = [int(round(count / max_count * max_size * 8)) for count in counts]
  File "/home/jo/.local/lib/python3.9/site-packages/termplotlib/barh.py", line 76, in <listcomp>
    eighths = [int(round(count / max_count * max_size * 8)) for count in counts]
ZeroDivisionError: division by zero

Process finished with exit code 1

Add headers for user readability

The horizontal view is useful if we're aware of the context (category, count) but it's missing the context of headers for application users.

Right now, I imagine the user has to get that working

Instead of just this,

Cats   [ 3]  ************
Dogs   [10]  ****************************************
Cows   [ 5]  ********************
Geese  [ 2]  ********

add a header:

Animals  Count
Cats     [ 3]   ************
Dogs     [10]   ****************************************
Cows     [ 5]   ********************
Geese    [ 2]   ********

Suggestion: add chart, a simpler parent type of histogram

Not an issue rather than a suggestion.

I stumbled upon this package while looking to implement some simple terminal charts. Looks like an extremely neat little tool!

However, I'd love to print a straightforward horizontal bar chart... Likely something like this

# passing counts and labels
fig.chart([3, 10, 5, 2], ['Cats', 'Dogs', 'Cows', 'Mice'], orientation='horizontal')

and get the following

Cats [ 3]  ████████████
Dogs [10]  ████████████████████████████████████████
Cows [ 5]  ████████████████████
Mice [ 2]  ████████

This is a very nearly identical implementation compared to the current hist(). It just takes counts and labels directly instead of deriving them from bin_edges.

Is it possible to refactor/separate the chart functionality?

FileNotFoundError: [WinError 2] The system cannot find the file specified

When trying to run the first example in the readme,

import asciiplotlib as apl
import numpy

x = numpy.linspace(0, 2 * numpy.pi, 10)
y = numpy.sin(x)

fig = apl.figure()
fig.plot(x, y, label="data", width=50, height=15)
fig.show()

I get the following error;

Traceback (most recent call last):
  File "cliplot.py", line 26, in <module>
    fig.plot(x, y, label="data", width=50, height=15)
  File "C:\Users\uqasnosw\AppData\Local\Continuum\Miniconda3\envs\python36\lib\site-packages\asciiplotlib\figure.py", line 63, in plot
    self._content.append(plot(*args, **kwargs))
  File "C:\Users\uqasnosw\AppData\Local\Continuum\Miniconda3\envs\python36\lib\site-packages\asciiplotlib\plot.py", line 24, in plot
    stderr=subprocess.PIPE,
  File "C:\Users\uqasnosw\AppData\Local\Continuum\Miniconda3\envs\python36\lib\subprocess.py", line 709, in __init__
    restore_signals, start_new_session)
  File "C:\Users\uqasnosw\AppData\Local\Continuum\Miniconda3\envs\python36\lib\subprocess.py", line 997, in _execute_child
    startupinfo)
FileNotFoundError: [WinError 2] The system cannot find the file specified

I'm using Python 3.6 on Windows 10 64-bit.

bring termplotlib to conda

AFAIK termplotlib cannot be installed via any conda channel. It would be great to have the package installable via conda.

Unittests failing

Does this inly work with Python 3? :(

==================================== ERRORS ====================================
_____________________ ERROR collecting test/test_figure.py _____________________
ImportError while importing test module '/home/bla/Downloads/asciiplotlib/test/test_figure.py'.
Hint: make sure your test modules/packages have valid Python names.
Traceback:
test/test_figure.py:3: in <module>
    import asciiplotlib as apl
/usr/local/lib/python2.7/dist-packages/asciiplotlib/__init__.py:14: in <module>
    from .figure import Figure, figure
/usr/local/lib/python2.7/dist-packages/asciiplotlib/figure.py:5: in <module>
    from .table import table
/usr/local/lib/python2.7/dist-packages/asciiplotlib/table.py:3: in <module>
    from collections.abc import Sequence
E   ImportError: No module named abc

[Question] GPL License

Forgive the mundane question but does the GPLv3 allow me to use termplotlib as a dependency in my BSD open-source project? Or does this require re-licensing my project under GPL? This is a fantastic project 👍 good job.

Figure.table fails if stdout does not have an `encoding` attribute

I ran into this issue when using asciiplotlib in a celery worker where celery replaces sys.stdout with a proxy object called LoggingProxy which does not have an encoding attribute. This seems to be valid as far as the python documentation goes so probably asciiplotlib should check if the attribute exists? The specific line that causes problem

asciiplotlib/table.py in _get_border_chars at line 31

        border_chars = None
    elif isinstance(border_style, list):
        assert len(border) == 11
        border_chars = border
    else:
        if sys.stdout.encoding in ["UTF-8", "UTF8"] and not force_ascii: # Here
            border_chars = {
                "thin": ["─", "│", "┌", "┐", "└", "┘", "├", "┤", "┬", "┴", "┼"],
                "rounded": ["─", "│", "╭", "╮", "╰", "╯", "├", "┤", "┬", "┴", "┼"],
                "thick": ["━", "┃", "┏", "┓", "┗", "┛", "┣", "┫", "┳", "┻", "╋"],
                "double": ["═", "║", "╔", "╗", "╚", "╝", "╠", "╣", "╦", "╩", "╬"],

Third line that should not be there

Hello. Here is example of graph and values below it that produce the graph. Strangely, there is third linear line in the graph that is not based on any values. can you help please?

                                                                                 Difference vs Second

    3 +-------------------------------------------------------------------------------------------------------------------------------------------------------------------------+
      |                                                                                                                                                                         |
      |                                                                                                                                                                         |
  2.5 |                                                                                                                                                                     ****|
      |        ********                                                                                                                                                 ****    |
      |                *****************                                                                                                                               *        |
    2 |                                 *******                                                                                                                      **         |
      |                                        **                                                                                                                   *           |
      |                                          *****************                                                                                                 *            |
      |                                                           ********                                                                                       **             |
  1.5 |                                                                   *********                                                                             *               |
      |                                                                            ********                                                                  ***                |
      |                                                                                    *********                                                     ****                   |
    1 |                                                                                             ********                              **************************************|
      |                                                                                                     *********         ********************                      ****    |
      |                                                                                                   ************************       **                                     |
  0.5 |                                                                               ********************               *** ********* **                                       |
      |                                                           ********************                                 **             *                                         |
      |                                       ********************                                                 ****                                                         |
    0 |                   ********************                                                                 ****                                                             |
      |         **********                                                                                 ****                                                                 |
      |        ********               ***********                                                       ***                                                                     |
      |                *********  ****           ********                        **********           **                                                                        |
 -0.5 |                         **                       *********           ****          ***********                                                                          |
      |                                                           ***********                                                                                                   |
      |                                                                                                                                                                         |
   -1 +-------------------------------------------------------------------------------------------------------------------------------------------------------------------------+
      0                2                4                6                8                10               12               14               16               18               20
                                                                                        Second
[ 1  2  3  4  5  6  7  8  9 10 11 12 13 14 15 16 17 18 19 20  1  2  3  4
  5  6  7  8  9 10 11 12 13 14 15 16 17 18 19 20]
[ 2.34776062  2.16069498  2.25478764  2.06803089  1.82760618  1.77814672
  1.62389961  1.44814672  1.27525097  1.11216216  0.9930888   0.84606178
  0.72471042  0.60409266  0.40505792  1.07081081  0.94814672  0.94405405
  0.85027027  1.02915058 -0.23255018 -0.32664109 -0.58788666 -0.22428571
 -0.41620425 -0.53604486 -0.66657025 -0.76583825 -0.4138961  -0.54228453
 -0.53236128 -0.04028335  0.25994097  0.76797521  0.86655254  0.95952184
  0.92318772  1.28368359  2.41154073  2.54878985]

Printing to file

More of a question really. If I open a file in "w" mode, what's the right way to dump the drawing into a file? I am trying various combinations of file.write() and also "wb" mode but with no success. Another option I am thinking is something like os.system('python plot-mything.py') but it is very ugly.

Feature request: Configure formatting for bin labels

With commit 2811faf the format of the bin edge labels for histograms was changed to exponential format. The application I want to use, https://github.com/ycrc/seff-array, mainly produces bin labels which are percentages, e.g.

CPU Efficiency (%)
---------------------
+0.00e+00 - +1.00e+01  [ 1]  ███▋
+1.00e+01 - +2.00e+01  [ 0]
+2.00e+01 - +3.00e+01  [ 0]
+3.00e+01 - +4.00e+01  [ 0]
+4.00e+01 - +5.00e+01  [ 0]
+5.00e+01 - +6.00e+01  [ 0]
+6.00e+01 - +7.00e+01  [ 0]
+7.00e+01 - +8.00e+01  [ 9]  ████████████████████████████████▊
+8.00e+01 - +9.00e+01  [11]  ████████████████████████████████████████
+9.00e+01 - +1.00e+02  [ 0]

Here the exponential format makes the labeling rather unclear.

Would it be possible to make this configurable?

Bug with labels if 'counts' contains any float values

Code to replicate bug is below. Will submit patch in a minute.

#!/usr/bin/python3
# -*- coding: utf-8 -*-

# Horizontal Bar Chart 

import asciiplotlib as apl
import traceback

# Bug #1 - Floating point values cause errors 
try: 
        fig = apl.figure()
        fig.barh(
                [     1.0,     12,      19],   
                ["Col 1", "Col 2", "Col 3"], 
                force_ascii=False
        )
        fig.show()    
except ValueError as e:
        print(traceback.format_exc())
# Traceback (most recent call last):
#   File "ascii_chart_debug.py", line 15, in <module>
#     force_ascii=False
#   File "/usr/local/lib/python3.5/dist-packages/asciiplotlib/figure.py", line 60, in barh
#     self._content.append(barh(*args, **kwargs))
#   File "/usr/local/lib/python3.5/dist-packages/asciiplotlib/barh.py", line 50, in barh
#     out.append(fmt.format(*data))
# ValueError: Unknown format code 'd' for object of type 'float'

Wrong output in get_gnuplot_version

Hi, this test

ERROR tests/test_plot.py - RuntimeError: Couldn't get gnuplot version

is failing because

Python 3.11.5 (main, Sep  2 2023, 14:16:33) [GCC 13.2.1 20230801] on linux
Type "help", "copyright", "credits" or "license" for more information.
>>> import termplotlib as tpl
>>> tpl.get_gnuplot_version()
Traceback (most recent call last):
  File "<stdin>", line 1, in <module>
  File "/tmp/makepkg/python-termplotlib/src/termplotlib-0.3.9/src/termplotlib/helpers.py", line 38, in get_gnuplot_version
    raise RuntimeError("Couldn't get gnuplot version")
RuntimeError: Couldn't get gnuplot version
>>> import subprocess
>>> subprocess.check_output(["gnuplot", "--version"]).decode()
'gnuplot 5.4 patchlevel 10\n'
>>> out = subprocess.check_output(["gnuplot", "--version"]).decode()
>>> out
'gnuplot 5.4 patchlevel 10\n'
>>> import re
>>> re.match("gnuplot (\\d).(\\d) patchlevel (\\d)\n", out)
>>> 

Recommend Projects

  • React photo React

    A declarative, efficient, and flexible JavaScript library for building user interfaces.

  • Vue.js photo Vue.js

    🖖 Vue.js is a progressive, incrementally-adoptable JavaScript framework for building UI on the web.

  • Typescript photo Typescript

    TypeScript is a superset of JavaScript that compiles to clean JavaScript output.

  • TensorFlow photo TensorFlow

    An Open Source Machine Learning Framework for Everyone

  • Django photo Django

    The Web framework for perfectionists with deadlines.

  • D3 photo D3

    Bring data to life with SVG, Canvas and HTML. 📊📈🎉

Recommend Topics

  • javascript

    JavaScript (JS) is a lightweight interpreted programming language with first-class functions.

  • web

    Some thing interesting about web. New door for the world.

  • server

    A server is a program made to process requests and deliver data to clients.

  • Machine learning

    Machine learning is a way of modeling and interpreting data that allows a piece of software to respond intelligently.

  • Game

    Some thing interesting about game, make everyone happy.

Recommend Org

  • Facebook photo Facebook

    We are working to build community through open source technology. NB: members must have two-factor auth.

  • Microsoft photo Microsoft

    Open source projects and samples from Microsoft.

  • Google photo Google

    Google ❤️ Open Source for everyone.

  • D3 photo D3

    Data-Driven Documents codes.