Giter VIP home page Giter VIP logo

esri-clusterfeaturelayer's Introduction

Esri ClusterFeatureLayer

This is a slightly revised version of the Cluster Example provided here.

A couple of things I added:

  • Works off a URL instead of a data option, like a FeatureLayer.
  • Option to add a Font for the Clusters TextSymbol. Default is 10pt and Arial.
  • If a service of geometryType esriGeometryPolygon is provided, it will convert those geometries to points and cluster them.
  • A zoomOnClick option that will zoom the map 1 zoom level on the clicked cluster graphic.
  • Has a MODE_SNAPSHOT that will cache all features in the service for increased performance. Refresh the layer using updateClusters().
  • Has an outFields option for the Features returned.
  • Has an option to use the services default renderer for single features.
  • And more, check source for more options.

App

All options

  • url required - Will generate clusters based on Features returned from map service.
  • MODE_SNAPSHOT optional - Will download and cache all features in service to draw clusters much quicker. Takes a little longer to loader, but improves performance during continued usage. Use updateClusters() to refresh clusters with service. Default is true.
  • outFields optional - Defines what fields are returned with Features. Deafult is ['*'].
  • objectIdField optional - Defines the OBJECTID field of service. Default is 'OBJECTID'.
  • where optional - Where clause for query. Default is null.
  • useDefaultSymbol optional - Use the services default symbology for single features. Default is false. If clustering a polygon service, will always default to false.
  • returnLimit optional - Return limit of features returned from query. Default is 1000.
  • distance optional - The max number of pixels between points to group points in the same cluster. Default value is 50.
  • labelColor optional - Hex string or array of rgba values used as the color for cluster labels. Default value is #fff (white).
  • labelOffset optional - Number of pixels to shift a cluster label vertically. Defaults to -5 to align labels with circle symbols. Does not work in IE.
  • resolution required - Width of a pixel in map coordinates. Example of how to calculate: map.extent.getWidth() / map.width.
  • showSingles optional - Whether or graphics should be displayed when a cluster graphic is clicked. Default is true.
  • zoomOnClick optionl - Will zoom the map when a cluster graphic is clicked. Default is true.
  • singleSymbol optional - Symbol to use for graphics that represent single points. Default is a small gray SimpleMarkerSymbol.
  • singleRenderer optional - Can provide a renderer for single features to override the default renderer.
  • singleTemplate optional Popup template used to format attributes for graphics that represent single points. Default shows all attributes as 'attribute = value' (not recommended).
  • maxSingles optional Threshold for whether or not to show graphics for points in a cluster. Default is 1000.
  • font optional Font to use for TextSymbol. Default is 10pt, Arial.
  • spatialReferenc optional Spatial reference for all graphics in the layer. This has to match the spatial reference of the map. Default is 102100. Omit this if the map uses basemaps in web mercator.

Events

  • clusters-shown - fires when clusters have been drawn and shown on map. Fires after the map extent changes.
  • details-loaded - fires when the layer has downloaded the default renderer properties from the service.
  • cluster-click - will return all points that make up a cluster when a cluster is clicked.

Notes

Although this behaves similar to a FeatureLayer, it does not have all the optimizations of a FeatureLayer. There is no Vector Tiling for the points. A possible optimization could be to break up the request by objectIds in to multiple queries. I added the ability to send requests by objectIds in chunks of 1000 by default. Can be set in options. I also added a cache for clustered graphics and a clearCache() method.

Demo

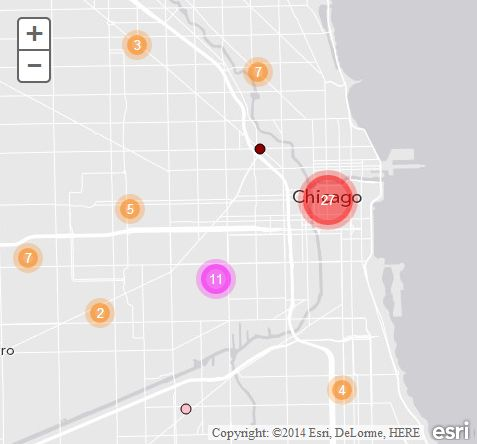
A demo can be seen here. A demo using a service of polygons shown as clusters can be seen here.

esri-clusterfeaturelayer's People

Contributors

odoe avatar btfou avatar

Stargazers

Charle avatar mhs avatar  avatar  avatar Gui Brunow avatar  avatar huangli avatar Raul Jimenez Ortega avatar Carlos Herrera Expósito avatar re avatar  avatar Erdong avatar Brett Neese avatar Hannes Grothkopf avatar chenn avatar Mike Lundin avatar  avatar Nathan Heminger avatar Ramūnas avatar Sarah Finne, GISP avatar Gavin Rehkemper avatar Jade zheng avatar  avatar  avatar beyondlh avatar Matt Moyles avatar  avatar  avatar Hunter Wei avatar  avatar Chad Cooper avatar Andrew Turner avatar Ryan Twilley avatar David Hansen avatar Allan Laframboise avatar Gianluca Caporossi avatar  avatar Alex Nguyen avatar David Spriggs avatar David Puckett avatar

Watchers

Tim McGee avatar  avatar Gianluca Caporossi avatar James Cloos avatar  avatar  avatar  avatar  avatar  avatar Sarah Finne, GISP avatar Remi Myers avatar  avatar

esri-clusterfeaturelayer's Issues

Is it working in IE browser?

Hi Guys, Thanks for this provided code, I have used the same code but the points are not loading in IE.
and while loading the map in chrome browser, Points are not loaded default, if we click on the map only points are loading in the map.

Can you assist me for the same.

Thanks in advance
Pavan

defaultSym doesnt work

in line 140 of index.html you define a default image, but even in the demo i cant see the image you define there.

i need to override and set a custom default image, it is possible?

How To Use Cluster Feature Layer With Dynamically Generated Points

Hi and Thanks for sharing this.

According to your documentation, you generate clusters based on Features returned from map service. but what if we have generate some point graphics from MySQL Database ? Foe example I am generating some Points from an AJAX call like


request.done(function( mapInfo) {
    for (var i = 0; i < mapInfo.length; i++) {
            var project = mapInfo[i];
            var point = new Point(project.Longitude, project.Latitude); 
            var pointSymbol = new SimpleMarkerSymbol(); 
            pointSymbol.setStyle(SimpleMarkerSymbol.STYLE_CIRCLE);
            pointSymbol.setSize(12);
            var pointInfoTemplate = new InfoTemplate(); 
            pointInfoTemplate.setTitle("Project Details");
            pointInfoTemplate.setContent('//JSON Data');
            var pointGraphic = new Graphic(point, pointSymbol).setInfoTemplate(pointInfoTemplate);
            points.push(pointGraphic);
}
for (i = 0; i < points.length; ++i) {
        map.graphics.add(points[i]);
}
});`

Can you please let me know how to do this?

Provide a default ClassBreakRenderer

I still think requiring the user to provide a ClassBreakRenderer is a little odd for this module. Add a default ClassBreakRenderer to be used if none is provided. User can still set it if they like to fine-tune the clusters.

MapServer url has issues

FeatureServer/0 works great but MapServer/0 has problems. On layer load looks good but zooming or clicking cluster marker results in no graphics or just a 1 or 2 random singles or clusters.

I can't see an issue. On extent change makes requests that return OIDs. No other errors.

Try to use Renderer from service as default symbol.

This could get pretty hacky, But it would be neat when a feature is not in the cluster instead of using the defaultSymbol, it uses the symbology from the services renderer property. Requires an initial request when it loads to get the service details and I'm thinking a little lookup to apply it when needed without breaking the ClassBreakRenderer.

outFields values

To be honest i'm not completely sure if this is really a bug/issue; perhaps i'm misinterpreting something....

When the fields are outputted and grouped as a cluster, they do not get a correct value. Instead of an array of unique values or a sum of alle values (when numeric), the value of the last point that's added to the cluster is given as value.

For example, let's say in choose a extra outField called FATALITIES. When the clusters are created, and we're looping over them, the clusterCount field works perfect and shows the exact number (sum) of points that's inside the cluster. But the FATALITIES field has the value of the latest point that was added in the cluster. Therefore, and since the features are only present as graphics, it is impossible to do any calculations with the fields, other then with the clusterCount field.

So in the example below the clusterCount will return a total of almost 80.000, which equals almost 80.000 that occurred in Africa between 1997 and 2012. But the fatality count will give a very low number in the range of hundreds; unfortunalty a lot more people died due tot those 80.000 conflicts.

var ext = map.extent;
var features = [];
var conflictCount = 0;
var fatalitiesCount = 0;

for (var i = 0; i < clusterLayer.graphics.length; i++) {
var gra = clusterLayer.graphics[i];
if (ext.intersects(gra.geometry)) {
features.push(gra);
}
for (var i = 0; i< features.length; i++){
conflictCount += features[i].attributes.clusterCount;
fatalitiesCount += features[i].attributes.FATALITIES;
}
console.log(conflictCount+' '+fatalitiesCount);
}

Recommend Projects

  • React photo React

    A declarative, efficient, and flexible JavaScript library for building user interfaces.

  • Vue.js photo Vue.js

    🖖 Vue.js is a progressive, incrementally-adoptable JavaScript framework for building UI on the web.

  • Typescript photo Typescript

    TypeScript is a superset of JavaScript that compiles to clean JavaScript output.

  • TensorFlow photo TensorFlow

    An Open Source Machine Learning Framework for Everyone

  • Django photo Django

    The Web framework for perfectionists with deadlines.

  • D3 photo D3

    Bring data to life with SVG, Canvas and HTML. 📊📈🎉

Recommend Topics

  • javascript

    JavaScript (JS) is a lightweight interpreted programming language with first-class functions.

  • web

    Some thing interesting about web. New door for the world.

  • server

    A server is a program made to process requests and deliver data to clients.

  • Machine learning

    Machine learning is a way of modeling and interpreting data that allows a piece of software to respond intelligently.

  • Game

    Some thing interesting about game, make everyone happy.

Recommend Org

  • Facebook photo Facebook

    We are working to build community through open source technology. NB: members must have two-factor auth.

  • Microsoft photo Microsoft

    Open source projects and samples from Microsoft.

  • Google photo Google

    Google ❤️ Open Source for everyone.

  • D3 photo D3

    Data-Driven Documents codes.