patrykandpatrick / vico Goto Github PK
View Code? Open in Web Editor NEWA light and extensible chart library for Android.
Home Page: https://patrykandpatrick.com/vico/wiki
License: Apache License 2.0
A light and extensible chart library for Android.
Home Page: https://patrykandpatrick.com/vico/wiki
License: Apache License 2.0


![renovate[bot] avatar](https://avatars.githubusercontent.com/in/2740?v=4 "renovate[bot]")


Why not add a .apk file to every release so that we understand how every chart ends up looking?
Hi.
Well done with the library, it will be very cool if you add some kind of fading edges to end and start of Line Chart.
like this one

Hello, i'd like to set marks on chart with custom text, for example - "A", "B", "C" etc. Is it possible?
Hi, once again thanks for pretty much making the best graph library. In our product we have a need for being able to fast go to the beginning, the middle and the end of the (bar)chart because we have lots of data.
Would it be possible to open up so the scroll position of the bar chart can be controlled from outside the (bar)chart as well being synchronized so that whenever someone scrolls in the (bar)chart, the position is broadcasted out as well. This means we would need to have three properties being made available as a lambda:
min, max and currentPosition
This would open up for a "scroll overview" of sorts, which makes navigating large graphs very easy for the user

I used a custom axis label but can't managed to show all of the label.
Is there any way to give space to it?
Let's say I have 100 entries, how can I put only labels for only part of them on the bottom axis? to show there only 0, 5, 10, 20 .. 100
Hi, we are trying to make the marker show a tooltip that contains more data than just the y-value, this could be made outside of vico if
markerVisibilityChangeListener also contained which entry was clicked, could this be added?
For example, for a chart:

It's impossible to show ThresholdLine for a value which is higher than other values on Y axis, thresholdValue must be in between. Is there any workaround?
Thanks again for the great library :)
I use it in app with fragments, navigation component, bottom bar, render the chart data in onViewCreated. But the chart animation is repeated whenever I enter the tab again though the data should be the same. Is it a way to disable the animation or customize it?
Hello, I'm plotting upcoming data, single series, 1-10 dots per second in linechart style.
Sometimes the app execution crashes with
FATAL EXCEPTION: pool-3-thread-3

java.util.ConcurrentModificationException

at java.util.ArrayList$Itr.next(ArrayList.java:860)
--
at com.patrykandpatryk.vico.core.entry.diff.DefaultDiffProcessor.updateProgressMap(DefaultDiffProcessor.kt:220)
at com.patrykandpatryk.vico.core.entry.diff.DefaultDiffProcessor.setEntries(DefaultDiffProcessor.kt:50)
at com.patrykandpatryk.vico.core.entry.ChartEntryModelProducer.setEntries$lambda$1$lambda$0(ChartEntryModelProducer.kt:73)
at com.patrykandpatryk.vico.core.entry.ChartEntryModelProducer.$r8$lambda$ouCUkSdPZbczQqr-7snrCS2u75g(Unknown Source:0)
at com.patrykandpatryk.vico.core.entry.ChartEntryModelProducer$ExternalSyntheticLambda0.run(Unknown Source:4)
It doesn't depend on presence of markers, or the data size, or running-up time. It is random event
I use the viewmodel pattern, producer and entries are in viewmodel, the composable uses viewmodel.producer to construct the chart
Are there any plans to support timeseries charts and multiple axis?
The scenario is a temperature chart:
Thank you for the library!
Unfortunately, I couldn't find how to do this in the documentation.
Hello,
thank you for the library and the recent updates.
I would like to implement the following chart:
Temperature on the Y-Axis and timestamp of measurements on the X-Axis with different gaps between the events and ticks for days.

This is not possible right now, correct?
Hello, typically X & Y axes provide adjustment for visible range of data. Is it possible to adjust in this library?
Hi,
I used the sample to create a Marker with two lines of text, and now I would like to center the text. When I specify textAlign = Paint.Align.CENTER the text is aligned properly, but the background is offset incorrectly. Is this a bug, or is there anything I can do in my code?

fun getMarker(
    @ColorInt labelColor: Int,
    @ColorInt bubbleColor: Int,
    @ColorInt shadowColor: Int,
    typeface: Typeface,
    formatDate: (LocalDate) -> String,
    formatValue: (Float) -> String,
): Marker {
    val labelBackgroundShape = MarkerCorneredShape(
        all = Corner.Absolute(sizeDp = 4f, cornerTreatment = RoundedCornerTreatment),
        tickSizeDp = 6f,
    )
    val label = textComponent {
        color = labelColor
        ellipsize = TextUtils.TruncateAt.END
        lineCount = 2
        padding = MutableDimensions(horizontalDp = 8f, verticalDp = 8f)
        textSizeSp = 12f
        this.typeface = typeface
        textAlign = Paint.Align.CENTER
        background = ShapeComponent(shape = labelBackgroundShape, color = bubbleColor)
            .setShadow(
                radius = SHADOW_RADIUS,
                dy = SHADOW_DY,
                color = shadowColor,
                applyElevationOverlay = true,
            )
    }

    return object : MarkerComponent(
        label = label,
        indicator = null,
        guideline = null,
    ) {
        init {
            labelFormatter = MarkerLabelFormatter { markedEntries ->
                markedEntries.transformToSpannable { model ->
                    val entry = model.entry as DateEntry
                    bold {
                        appendCompat(
                            formatDate(entry.localDate),
                            ForegroundColorSpan(labelColor),
                            Spannable.SPAN_EXCLUSIVE_EXCLUSIVE,
                        )
                    }
                    appendLine()
                    appendCompat(
                        formatValue(entry.y),
                        ForegroundColorSpan(labelColor),
                        Spannable.SPAN_EXCLUSIVE_EXCLUSIVE,
                    )
                }
            }
        }

        override fun getInsets(
            context: MeasureContext,
            outInsets: Insets,
            segmentProperties: SegmentProperties,
        ) = with(context) {
            outInsets.top = label.getHeight(context) + labelBackgroundShape.tickSizeDp.pixels +
                    SHADOW_RADIUS.pixels * SHADOW_RADIUS_TO_PX_MULTIPLIER - SHADOW_DY.pixels
        }
    }
}I'd like to be able to visualise changes in a fixed range of values, but the highest possible value is not always present in the dataset. Are there any plans to add this?
I want to create a graph like this (with options to change range to per day, week, month, or year):

The problems I get with the current vico version:
Is it possible to add this stuff in future versions?
Thanks :)
Hello!
I really like this library, but wondering if I could customize it to have a candle stick style?
Currently trying to understand how the lib works, but it you have some time, it would help a lot...
Thanks in advance.

I wanted to have a list of multiple charts, one chart per card and multiple such cards laid out in a vertical list fashion. but when I do this, with a list of say 30 charts, the list doesn't scroll (getting clipped abruptly at card #3 for instance).
Here's a code fragment that I had tried:
//Simply prints a list made up of a repeated charts
@Composable
public fun ChartsContainer() {
    Column(
        modifier = Modifier
            .fillMaxWidth()
            .fillMaxHeight(0.8f)
            .verticalScroll(rememberScrollState()),
    ) {
        Spacer(modifier = Modifier.height(20.dp))
        repeat(30) {
            ChartCard(count = it)
        }
    }
}

@Composable
public fun ChartCard(count: Int = 0) {
    val listFloatEntry1: List<FloatEntry> =
        listOf(
            FloatEntry(x = 0f, y = 500f),
            FloatEntry(x = 10f, y = 300f),
            FloatEntry(x = 20f, y = 100f),
        )

    val chartEntryModelProducer1: ChartEntryModelProducer = ChartEntryModelProducer()
    chartEntryModelProducer1.setEntries(listFloatEntry1)

    Card(modifier = Modifier.padding(3.dp)) {
        Text("Chart number: $count")
        Chart(
            chart = columnChart(),
            chartModelProducer = chartEntryModelProducer1,
            startAxis = startAxis(title = "Foo", titleComponent = textComponent {}),
            bottomAxis = bottomAxis(
                title = "Baz",
                titleComponent = textComponent {},
                tickPosition = HorizontalAxis.TickPosition.Center(
                    offset = 0,
                    spacing = 5,
                ),
            ),
        )
    }
}
Here's what the above looks like:
Notice how it's getting clipped at the third chart and not scrollable.
How do I make a scrollable list of charts?
Hello! With the last version 1.4.2, when the number of entries for the chart is one and then the chart is moved, the application crashes.
E/AndroidRuntime: FATAL EXCEPTION: main
    Process: app.package.custom, PID: 17717
    java.lang.IllegalArgumentException: Cannot coerce value to an empty range: NaN..0.0.
        at kotlin.ranges.RangesKt___RangesKt.coerceIn(_Ranges.kt:1292)
        at com.patrykandpatryk.vico.core.scroll.ScrollHandler.getClampedScroll(ScrollHandler.kt:40)
        at com.patrykandpatryk.vico.core.scroll.ScrollHandler.handleScrollDelta(ScrollHandler.kt:48)
        at com.patrykandpatryk.vico.compose.chart.ChartsKt$Chart$scrollableState$1.invoke(Charts.kt:190)
        at com.patrykandpatryk.vico.compose.chart.ChartsKt$Chart$scrollableState$1.invoke(Charts.kt:190)
        at androidx.compose.foundation.gestures.ScrollableStateKt$rememberScrollableState$1$1.invoke(ScrollableState.kt:118)
        at androidx.compose.foundation.gestures.ScrollableStateKt$rememberScrollableState$1$1.invoke(ScrollableState.kt:118)
        at androidx.compose.foundation.gestures.DefaultScrollableState$scrollScope$1.scrollBy(ScrollableState.kt:136)
        at androidx.compose.foundation.gestures.ScrollingLogic.dispatchScroll-f0eR0lY(Scrollable.kt:350)
        at androidx.compose.foundation.gestures.ScrollDraggableState.dragBy-Uv8p0NA(Scrollable.kt:434)
        at androidx.compose.foundation.gestures.DraggableKt$draggable$9$2$2.invokeSuspend(Draggable.kt:244)
        at androidx.compose.foundation.gestures.DraggableKt$draggable$9$2$2.invoke(Unknown Source:8)
        at androidx.compose.foundation.gestures.DraggableKt$draggable$9$2$2.invoke(Unknown Source:4)
        at androidx.compose.foundation.gestures.ScrollDraggableState$drag$2.invokeSuspend(Scrollable.kt:445)
        at androidx.compose.foundation.gestures.ScrollDraggableState$drag$2.invoke(Unknown Source:8)
        at androidx.compose.foundation.gestures.ScrollDraggableState$drag$2.invoke(Unknown Source:4)
        at androidx.compose.foundation.gestures.DefaultScrollableState$scroll$2$1.invokeSuspend(ScrollableState.kt:150)
        at androidx.compose.foundation.gestures.DefaultScrollableState$scroll$2$1.invoke(Unknown Source:8)
        at androidx.compose.foundation.gestures.DefaultScrollableState$scroll$2$1.invoke(Unknown Source:4)
        at androidx.compose.foundation.MutatorMutex$mutateWith$2.invokeSuspend(MutatorMutex.kt:160)
        at androidx.compose.foundation.MutatorMutex$mutateWith$2.invoke(Unknown Source:8)
        at androidx.compose.foundation.MutatorMutex$mutateWith$2.invoke(Unknown Source:4)
        at kotlinx.coroutines.intrinsics.UndispatchedKt.startUndispatchedOrReturn(Undispatched.kt:89)
        at kotlinx.coroutines.CoroutineScopeKt.coroutineScope(CoroutineScope.kt:264)
        at androidx.compose.foundation.MutatorMutex.mutateWith(MutatorMutex.kt:153)
        at androidx.compose.foundation.gestures.DefaultScrollableState$scroll$2.invokeSuspend(ScrollableState.kt:147)
        at androidx.compose.foundation.gestures.DefaultScrollableState$scroll$2.invoke(Unknown Source:8)
        at androidx.compose.foundation.gestures.DefaultScrollableState$scroll$2.invoke(Unknown Source:4)
        at kotlinx.coroutines.intrinsics.UndispatchedKt.startUndispatchedOrReturn(Undispatched.kt:89)
        at kotlinx.coroutines.CoroutineScopeKt.coroutineScope(CoroutineScope.kt:264)
        at androidx.compose.foundation.gestures.DefaultScrollableState.scroll(ScrollableState.kt:146)
        at androidx.compose.foundation.gestures.ScrollDraggableState.drag(Scrollable.kt:443)
        at androidx.compose.foundation.gestures.DraggableKt$draggable$9$2.invokeSuspend(Draggable.kt:241)
        at kotlin.coroutines.jvm.internal.BaseContinuationImpl.resumeWith(ContinuationImpl.kt:33)
        at kotlinx.coroutines.DispatchedTask.run(DispatchedTask.kt:106)
        at androidx.compose.ui.platform.AndroidUiDispatcher.performTrampolineDispatch(AndroidUiDispatcher.android.kt:81)
        at androidx.compose.ui.platform.AndroidUiDispatcher.access$performTrampolineDispatch(AndroidUiDispatcher.android.kt:41)
        at androidx.compose.ui.platform.AndroidUiDispatcher$dispatchCallback$1.doFrame(AndroidUiDispatcher.android.kt:68)
        at android.view.Choreographer$CallbackRecord.run(Choreographer.java:970)
        at android.view.Choreographer.doCallbacks(Choreographer.java:796)
        at android.view.Choreographer.doFrame(Choreographer.java:727)
E/AndroidRuntime:     at android.view.Choreographer$FrameDisplayEventReceiver.run(Choreographer.java:957)
        at android.os.Handler.handleCallback(Handler.java:938)
        at android.os.Handler.dispatchMessage(Handler.java:99)
        at android.os.Looper.loop(Looper.java:223)
        at android.app.ActivityThread.main(ActivityThread.java:7656)
        at java.lang.reflect.Method.invoke(Native Method)
        at com.android.internal.os.RuntimeInit$MethodAndArgsCaller.run(RuntimeInit.java:592)
        at com.android.internal.os.ZygoteInit.main(ZygoteInit.java:947)
    	Suppressed: kotlinx.coroutines.DiagnosticCoroutineContextException: [androidx.compose.ui.platform.MotionDurationScaleImpl@b01904e, androidx.compose.runtime.BroadcastFrameClock@3f6656f, StandaloneCoroutine{Cancelling}@5ab327c, AndroidUiDispatcher@b2e7705]
I/Process: Sending signal. PID: 17717 SIG: 9
In version 1.3.0 the application does not crash. And in both versions, the value is not shown in the chart and the axis has wrong values. (The value not showing up is the same in a columnChart)
Version 1.3.0:

Version 1.4.2:

Video from version 1.4.2:
Code for chart:
val chartModelProducer = remember { ChartEntryModelProducer() }

val (entries, localDateTimes) =
    remember(
        marketPrices,
        marketPricesFilter,
        marketPricesTypeFilter,
        filterValues,
        groupByDay
    ) {
        marketPrices.mapToChartData(
            filterMarketPricesPredicate = { it.type == marketPricesTypeFilter },
            filterMarketPricesValuesPredicate = filterValues,
            marketPricesFilter = marketPricesFilter,
            groupByDay = groupByDay
        ).let { data ->
            Pair(data.map { it.second }, data.map { it.first })
        }
    }

LaunchedEffect(entries) {
    chartModelProducer.setEntries(entries)
}

ProvideChartStyle(
    chartStyle =
        m3ChartStyle(
            axisLabelColor = colors.onSurface,
            entityColors = listOf(colors.primary, colors.secondary),
            elevationOverlayColor = colors.primary)
) {
    Chart(
        chart =
            lineChart(
                minY = entries.takeIf { it.size > 1 }?.minOfOrNull { it.y },
                maxY = entries.takeIf { it.size > 1 }?.maxOfOrNull { it.y },
                persistentMarkers =
                    if (showCurrentHourMarker && entries.size > 1)
                        getCurrentHourMarker(entries = entries, localDateTimes = localDateTimes)
                    else null
            ),
        chartModelProducer = chartModelProducer,
        modifier = modifier,
        startAxis = startAxis(
            title = stringResource(id = R.string.euro_per_megawatt_hour),
            titleComponent = textComponent {},
            valueFormatter = EmptyAxisValueFormatter()),
        endAxis = endAxis(valueFormatter = MarketPricesAxisValueFormatter()),
        bottomAxis =
            bottomAxis(
                title = stringResource(id = if (groupByDay) R.string.time_unit_day else R.string.time_unit_hour),
                titleComponent = textComponent {},
                valueFormatter =
                    LocalDateTimeAxisValueFormatter(
                        localDateTimes = localDateTimes,
                        groupByDay = groupByDay)),
        marker = marker(),
        isZoomEnabled = isZoomEnabled)
}
Code for value formatter:
class LocalDateTimeAxisValueFormatter<Position: AxisPosition>(
      localDateTimes: List<LocalDateTime>,
      groupByDay: Boolean
): LocalDateTimeValueFormatter(localDateTimes, groupByDay), AxisValueFormatter<Position>

open class LocalDateTimeValueFormatter(
    private val localDateTimes: List<LocalDateTime>,
    private val groupByDay: Boolean,
): ValueFormatter {
    override fun formatValue(value: Float, chartValues: ChartValues): CharSequence {
        val dateFormatted =
            localDateTimes.getOrNull(value.toInt())?.format(
                if (groupByDay) DateFormat.DAY_MONTH else DateFormat.HOUR
            ) ?: ""
        return if (dateFormatted.isNotBlank()) (dateFormatted + (if (groupByDay) "" else "h")) else ""
    }
}
Example of data:
val entries = mutableListOf<FloatEntry>()
for (i in 0 until 24) entries.add(FloatEntry(i.toFloat(), Random.nextFloat()*(50) + 200))
val localDateTimes = mutableListOf<LocalDateTime>()
for (i in 0 until 24) dates.add(LocalDateTime.now().withHour(i).withMinute(0))
Thanks for the library, it's a great help! ❤️
First of all nice work guys on this lib, its beautiful.
i am trying to implement this lib in a project and i have to make the bars larger and remove the guidelines from the bg but i couldn't find a way to do this
It would be great if the bottomAxis for ColumnChart could be something else than Float and also support multiple line entries
such as:
5th
April
2002
and make sure all lines are centered horizontally
Hi! Is it possible to adjust minor/major vertical gridlines to decrease their value?
Is there any way to modify the size of axisLabelComponent?
As shown in the picture it cuts the text off, sizeConstraint does not have any impact on the label.
Padding/margin is all 0, ellipsize is set to TruncateAt.END.

The second picture uses TruncateAt.MARQUEE as a workaround

Hi! First of all, thank you for the library! Could you please add some screenshots in the readme and/or in the wiki?
The chart always starts from the middle point of x value, though a threshold starts from the beginning of axes. Is there any way to start the chart from the same starting point?

This library seems to lack support for pie charts
Anyway, very nice library, nice looking and easy to use 🥰
Is it possible to achieve this linecharts with vico?
Custom:

I'm not sure if this custom chart is using quadratic bezier curves.
Vico:

i been playing with the cubic strength but i guess the cubic bezier curve doesnt allow to have the smoothness of the custom one
Vico cubic strenght 0.2:

Maybe this is and I'm not realising it, but the idea would be that instead of numbers appearing in the bottomAxis of the elements (e.g. 0, 1, 2, 3...), text defined in the data model (e.g. Mon, Tues, Wed...) or another type of text that the developer defines in the model could appear, instead of getting the numerical data.
As I said, I don't know if this possibility currently exists, if it does, I would like to know how to apply it.
Hi! How could YAxis scroll be enabled?
Hello,
I'm displaying a line chart in a BottomSheetScaffold. I specify to the BottomSheetScaffold that the BottomSheet must be collapsed, except that as soon as the graph is drawn the bottomsheet extends.
I need to explicitly tell the bottomSheetScaffoldState to collapse the bottomsheet after my chart is drawn.
When I use a surface with a height x the bottomsheet remains well collapsed
My Scaffold
val bottomSheetScaffoldState = rememberBottomSheetScaffoldState(
        bottomSheetState = rememberBottomSheetState(BottomSheetValue.Collapsed)
)

 BottomSheetScaffold(
        modifier = modifier,
        sheetContent = {
            Surface(modifier = Modifier.padding(MaterialTheme.padding.default.all)) {
                BalanceGraph(balanceChartProducer)

                 //adding this to make sur the bottomsheet remains well collaps at first
                 coroutineScope.launch {
                    bottomSheetScaffoldState.bottomSheetState.collapse()
                }
            }

        },
        scaffoldState = bottomSheetScaffoldState,
My Graph
Chart(
        chart = lineChart(
            axisValuesOverrider = AxisValuesOverrider.fixed(
                minY = 500f,
                maxY = 758f
            ),
            lines = currentChartStyle.lineChart.lines.map {
                it.also { it.pointConnector = DefaultPointConnector(0f) }
            }
        ),
        chartScrollSpec = rememberChartScrollSpec(isScrollEnabled = false),
        chartModelProducer = producer,
        startAxis = startAxis(),
        bottomAxis = bottomAxis(
            valueFormatter = DecimalFormatAxisValueFormatter(
                decimalFormat = DecimalFormat(".###")
            )
        ),
        runInitialAnimation = false,
    )
I tested if runInitialAnimation was the cause of this unexpected opening. Unfortunately the behavior remains the same with the variable set to false
The state of my screen when I first display it
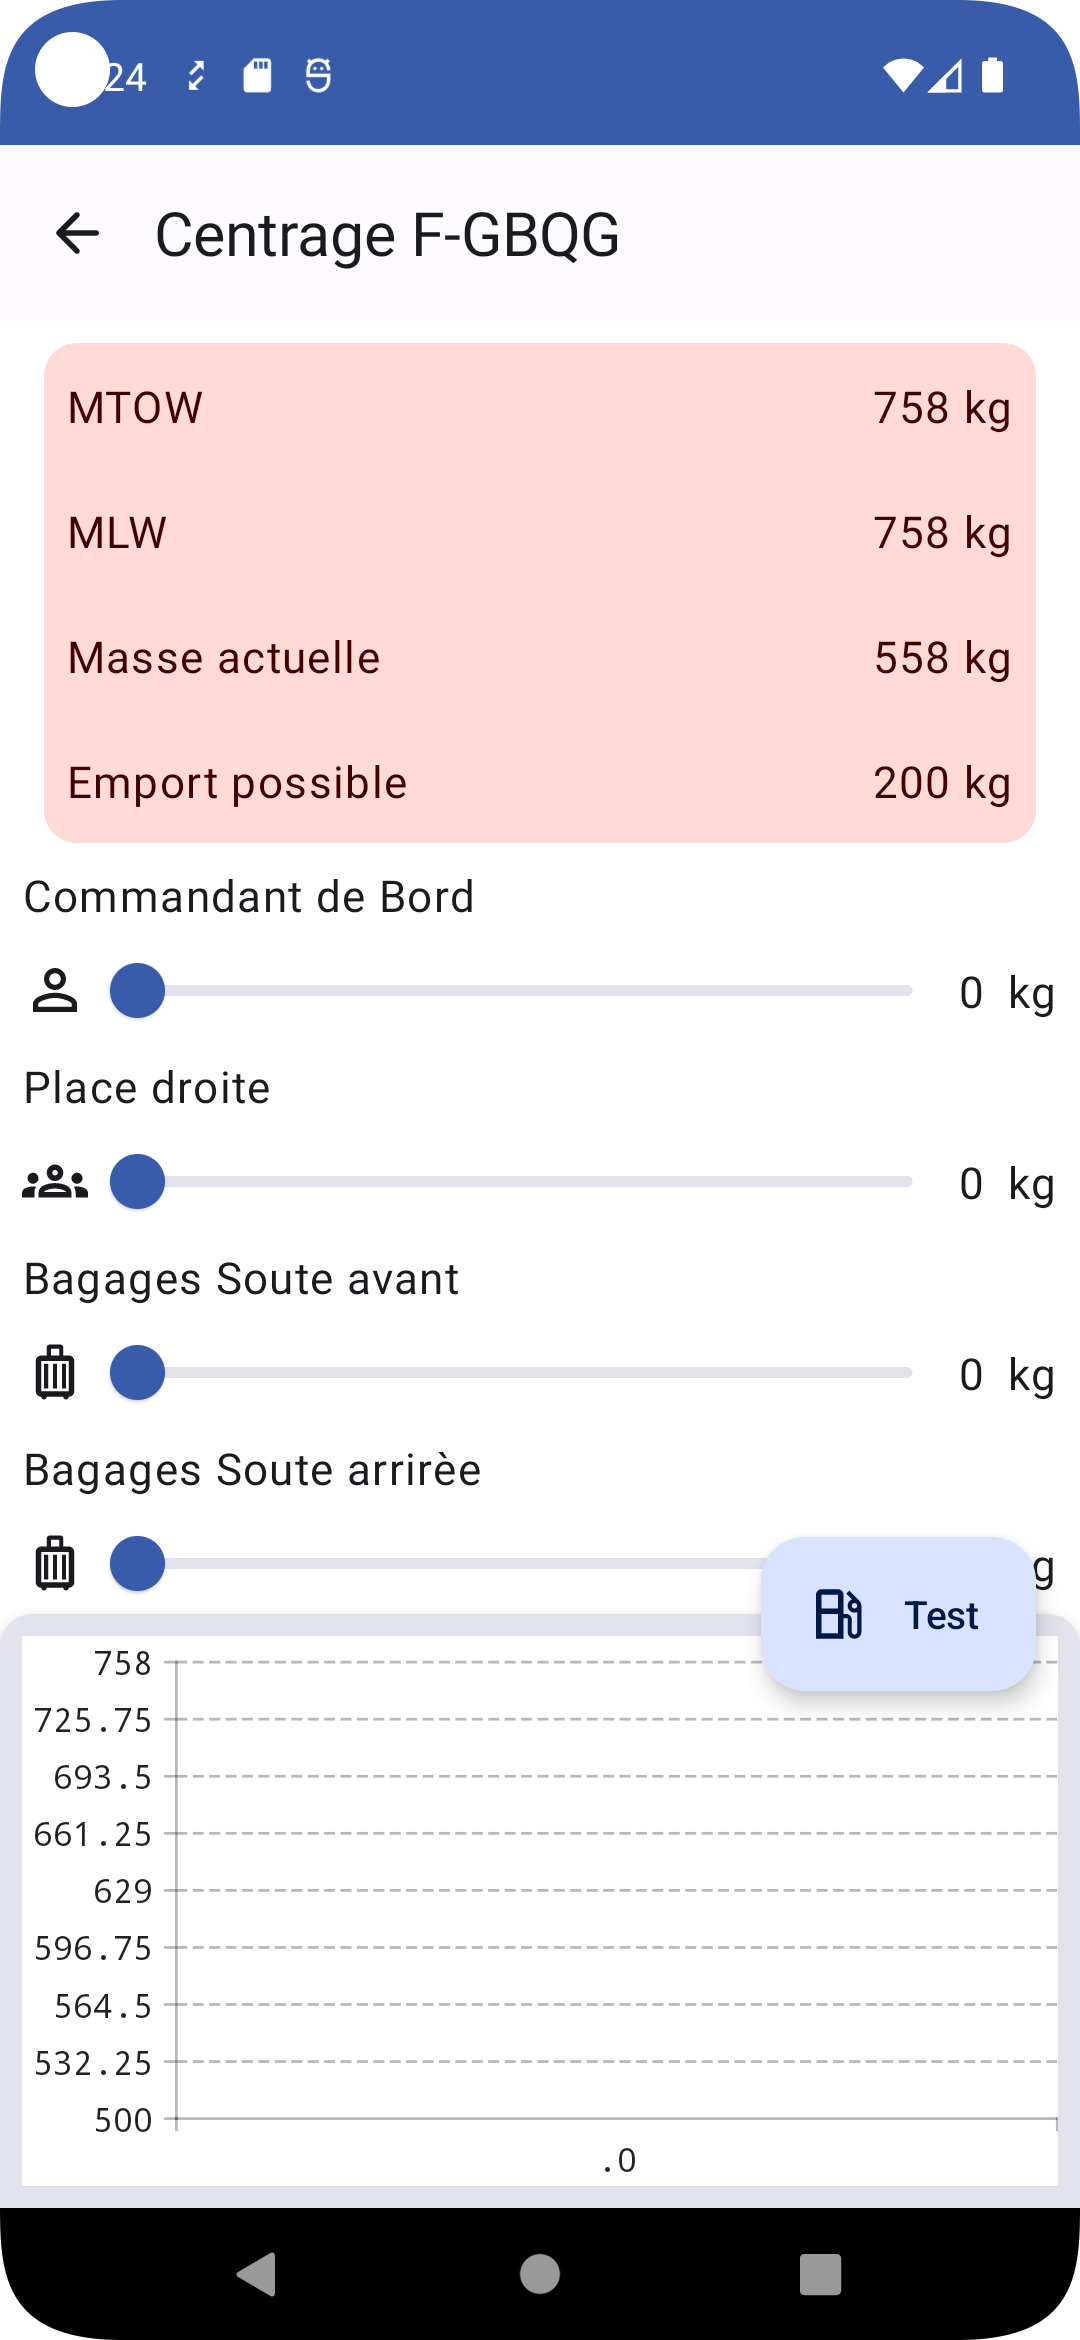
Thanks for your help or analysis.
Best regards
When isHorizontalScrollEnabled=false, the chart is displayed as a single vertical line. It only displays properly after the chart is touched. This doesn't happen if the flag isn't set. Is there any other way to show the whole data without scrolling?
I'm using the jetpack compose Chart with lineChart()
Does Vico support a mix of positive and negative integer values in a Barchart? I tried a simple bar chart with a mix of positive and negative y-axis values and the resulting bar chart was strange. Before I try any further, wanted to confirm if this is indeed a supported usecase?
update: apologies, this was fixed by tweaking the targetVerticalAxisPosition
Hi, I'm trying to implement a "sparkline" graph, which is basically just a normal linegraph but axis loses meaning and all data
is scaled to fit the width and height. I currently see no option for this, could it be added?
Hi,
I've been building a graph with your library, and when I integrated my implementation from @Preview (static data) to the app (dynamic data), I noticed that the graph is not updating. Only the initial value is drawn, which in my case is emptyList() before the appropriate data is loaded.
I have the chart setup like this:
@Composable
fun MyLineChart(
    data: List<Price>,
    modifier: Modifier = Modifier,
) {
  // map from data entity to ChartEntry
  val mapped = data.map{ ... }
  // make ModelProducer
  val producer = ChartEntryModelProducer(mapped)
  // make graph
  Chart(
    chart = lineChart(),
    chartModelProducer = producer,
    ...
}
When I moved the ChartEntryModelProducer to ViewModel and updated it in viewModelScope just like in the samples, it worked fine. It's the same data, just set in a different place.
Is this intended behaviour, or something else?
Thanks!
To fix the issue I had to remember the ChartEntryModelProducer and call modelProducer.setData() in LaunchedEffect.
@Composable
fun MyLineChart(
    data: List<Price>,
    modifier: Modifier = Modifier,
) {
  // map from data entity to ChartEntry
  val mapped = data.map{ ... }
  // make ModelProducer
  val producer = remember { ChartEntryModelProducer(mapped) }
  // make graph
  Chart(
    chart = lineChart(),
    chartModelProducer = producer,
    ...
  )

  LaunchedEffect(mapped) {
    producer.setData(mapped)
  }
}Hi,
Setting runInitialAnimation to false still animates the chart during the Composition.
Are any additional steps required for not showing any animation initially?

I see in the samples how you can change the color of the line shadow, but how do I reverse its direction for the red columns and make it stop at the ThresholdLine?
This is the preview I get from Jetpack Compose, you can see that the more the data displayed, the smaller the column is.

Expected behavior
Column thickness and spacing should be consistent regardless of how much data is displayed, if the data is too much to display in the screen, then it should be horizontally scrollable.
Code:
Chart(
    chart = columnChart(
        columns = listOf(
            LineComponent(context.getColor(R.color.primary), 1f, shape = pillShape),
            LineComponent(context.getColor(R.color.secondary), 1f, shape = pillShape),
        ),
        dataLabel = textComponent {
            typeface = Typeface.SANS_SERIF
            textAlign = Paint.Align.CENTER
            color = android.graphics.Color.WHITE
        },
        dataLabelVerticalPosition = VerticalPosition.Bottom,
        spacing = 4.dp,
        innerSpacing = 0.1.dp
    ),
    model = entryModelOf(frequencies, remainingStocks),
    startAxis = startAxis(
        label = axisLabelComponent(typeface = Typeface.SANS_SERIF, textSize = 10.sp, lineCount = 1),
        axis = null,
        tick = null,
        guideline = axisGuidelineComponent(shape = Shapes.rectShape, color = Color.LightGray.copy(alpha = .25f)),
        valueFormatter = DecimalFormatAxisValueFormatter("##")
    ),
    bottomAxis = bottomAxis(
        label = axisLabelComponent(typeface = Typeface.SANS_SERIF, textSize = 10.sp, lineCount = 1),
        guideline = null,
        tick = null,
        axis = null,
        valueFormatter = { value, _ -> labels[value.roundToInt()] }
    ),
)Hello. First of all I want to thank you for this amazing library.
Currently I have two problems. I want to show a time based chart(minutes per days in a week period)
The library generates startAxis values itself. Is there any way to customize it? I want to step every row by 1 hour.

For example in this case steps should be 1h, 2h and 3h.
note that inputs are per minute.
How can I cut the line when entered value is 0? In the above sample the line should stop in Tuesday.
Thank you.
Hard to reproduce.
For example, we have a following random entries generation config:
private val generator = RandomEntriesGenerator(
        xRange = IntProgression.fromClosedRange(0, 24, 2),
        yRange = 0..1000,
    )
The chart has a label, the code is almost the same which is given in the sample, only UI settings are different.
For this chart:

When we tap on the lowest point to see the label, a crash is happening:
java.lang.IllegalArgumentException: Cannot coerce value to an empty range: maximum 513.1875 is less than minimum 530.1875.
        at kotlin.ranges.RangesKt___RangesKt.coerceIn(_Ranges.kt:1263)
        at com.patrykandpatryk.vico.core.component.shape.cornered.MarkerCorneredShape.drawShape(MarkerCorneredShape.kt:86)
        at com.patrykandpatryk.vico.core.component.shape.ShapeComponent.draw$lambda-3$drawShape(ShapeComponent.kt:99)
        at com.patrykandpatryk.vico.core.component.shape.ShapeComponent.draw(ShapeComponent.kt:110)
        at com.patrykandpatryk.vico.core.component.text.TextComponent.drawText(TextComponent.kt:200)
        at com.patrykandpatryk.vico.core.component.text.TextComponent.drawText$default(TextComponent.kt:133)
        at com.patrykandpatryk.vico.core.component.marker.MarkerComponent.drawLabel(MarkerComponent.kt:104)
        at com.patrykandpatryk.vico.core.component.marker.MarkerComponent.draw(MarkerComponent.kt:89)
I've checked multiple times, the lowest point has to be close to zero:

java.lang.IllegalArgumentException: Cannot coerce value to an empty range: maximum 80.1875 is less than minimum 97.1875.
Another sample:


Crash on tap on the lowest point:
java.lang.IllegalArgumentException: Cannot coerce value to an empty range: maximum 645.1875 is less than minimum 662.1875.
No crash when I update the generation this way:
private val generator = RandomEntriesGenerator(
        xRange = IntProgression.fromClosedRange(0, 24, 2),
        yRange = 100..1000,
    )
Hi,
Thank for your hard work.

Currently, If number of values on chart is small then we will have many empty space on the right side.
How to auto clamping the chart with the values spread and have scale disabled if we scale two small.
I'm newbie in programming, and I have a problem, I can't Run application.
Here is my build.gradle(Project: Test)
`
buildscript {
ext {
kotlin_version = '1.7.10'
compose_version = '1.3.0'
}
}// Top-level build file where you can add configuration options common to all sub-projects/modules.
plugins {
id 'com.android.application' version '7.2.2' apply false
id 'com.android.library' version '7.2.2' apply false
id 'org.jetbrains.kotlin.android' version '1.7.10' apply false
}
task clean(type: Delete) {
delete rootProject.buildDir
}
`
And build.gradle(Module: test.app)
`
plugins {
id 'com.android.application'
id 'org.jetbrains.kotlin.android'
}
android {
compileSdk 33
defaultConfig {
    applicationId "com.example.test"
    minSdk 21
    targetSdk 33
    versionCode 1
    versionName "1.0"

    testInstrumentationRunner "androidx.test.runner.AndroidJUnitRunner"
    vectorDrawables {
        useSupportLibrary true
    }
}

buildTypes {
    release {
        minifyEnabled false
        proguardFiles getDefaultProguardFile('proguard-android-optimize.txt'), 'proguard-rules.pro'
    }
}
compileOptions {
    sourceCompatibility JavaVersion.VERSION_1_8
    targetCompatibility JavaVersion.VERSION_1_8
}
kotlinOptions {
    jvmTarget = '1.8'
}
buildFeatures {
    compose true
}
composeOptions {
    kotlinCompilerExtensionVersion compose_version
}
packagingOptions {
    resources {
        excludes += '/META-INF/{AL2.0,LGPL2.1}'
    }
}
}
dependencies {
implementation "com.google.accompanist:accompanist-systemuicontroller:0.27.0"
implementation 'androidx.core:core-ktx:1.9.0'
implementation "androidx.compose.ui:ui:$compose_version"
implementation 'androidx.compose.material3:material3:1.1.0-alpha01'
implementation "androidx.compose.ui:ui-tooling-preview:$compose_version"
implementation 'androidx.lifecycle:lifecycle-runtime-ktx:2.5.1'
implementation 'androidx.activity:activity-compose:1.6.1'
testImplementation 'junit:junit:4.13.2'
androidTestImplementation 'androidx.test.ext:junit:1.1.3'
androidTestImplementation 'androidx.test.espresso:espresso-core:3.4.0'
androidTestImplementation "androidx.compose.ui:ui-test-junit4:$compose_version"
debugImplementation "androidx.compose.ui:ui-tooling:$compose_version"
debugImplementation "androidx.compose.ui:ui-test-manifest:$compose_version"
implementation("androidx.navigation:navigation-compose:2.5.3")
implementation "androidx.compose.material:material-icons-extended:1.3.0"
implementation 'androidx.lifecycle:lifecycle-viewmodel-compose:2.5.1'
implementation "com.patrykandpatryk.vico:compose:1.5.2"
implementation "com.patrykandpatryk.vico:compose-m3:1.5.2"
}
`
I tried to change version of Kotlin and compose, but it didn't work, mb I did it wrong
H!, thanks for beautiful lib!
I got simple linechart, what shows incoming data
val range = viewModel.range.collectAsState()

val chart = lineChart(
          pointPosition = LineChart.PointPosition.Center,
          lines = entityColors.map { color ->
              lineSpec(
                  lineColor = Color(color),
                  lineBackgroundShader = null,
                  point = ShapeComponent(shape = Shapes.roundedCornerShape(50)),
                  pointSize = 4.dp,
              )
          },
          maxX = range.value.second,
          minX = range.value.first,
          maxY = 1200f,
          minY = 400f
      )
      Chart(
          modifier = Modifier
              .weight(7f),
          chart = chart,
          chartModelProducer = viewModel.producer,
          startAxis = startAxis(maxLabelCount = 8),
          bottomAxis = bottomAxis(tickLength = 0.5.dp),
          runInitialAnimation = false,
          isHorizontalScrollEnabled = false
      )
in a view model
   private val entries : MutableList<FloatEntry> = MutableList(0){FloatEntry(0f,0f)}
    val producer = ChartEntryModelProducer(entries)
    private val _range : MutableStateFlow<Pair<Float, Float>> = MutableStateFlow(0.0f to 100.0f)
    val range = _range.asStateFlow()
every 100 ms i ad new value to entry and setEntries
entries.add(FloatEntry(counter, (200f * Random.nextFloat()+600f)))
counter++
               if (counter > 100f){
                   _range.emit(counter -100f to counter)
               }
 producer.setEntries(entries)
and i got this animation, that I'd like to stop, diffAnimationSpec - couldn't be off
Hi, i have the issue when the async incoming data arrive to fast (during 1 ms).
FATAL EXCEPTION: pool-10-thread-1 Process: java.util.ConcurrentModificationException at java.util.ArrayList$Itr.next(ArrayList.java:860) at com.patrykandpatryk.vico.core.entry.diff.DefaultDiffProcessor.updateProgressMap(DefaultDiffProcessor.kt:220) at com.patrykandpatryk.vico.core.entry.diff.DefaultDiffProcessor.setEntries(DefaultDiffProcessor.kt:50) at com.patrykandpatryk.vico.core.entry.ChartEntryModelProducer.setEntries$lambda$1$lambda$0(ChartEntryModelProducer.kt:73) at com.patrykandpatryk.vico.core.entry.ChartEntryModelProducer.$r8$lambda$ouCUkSdPZbczQqr-7snrCS2u75g(Unknown Source:0) at com.patrykandpatryk.vico.core.entry.ChartEntryModelProducer$$ExternalSyntheticLambda0.run(Unknown Source:4)
I have 300-500 dots of line chart on a screen, and i update the chart entry on every new dot. And the way of such chart update seems to be not thread-safe.
Is there any way of synchronization inside of ChartEntryModelProducer?
Hi,
For example, first time I have data set of 7 values. Then I change to 12 values. Finally, back to 7 values. The chart display perfectly 7 first values. The rest are consider as value 0.
As listener showing marker?
Hi,
I came to know about this library just today. I started playing around with it and I'm very impressed with the number of features offered.
I believe it will become the top alternative for the MPAndroidChart.
I just wanted to know whether you can scroll to a certain point at the beginning. Say I want to scroll to the last point so the user will scroll left instead of right. This makes sense when using date & time for X-Axis.
I've gone through the documentation. But I couldn't find any mention of scrolling to a certain point.
Thanks for the library
How to indicate the amount on the x-axis in the chart, for example 6? 
A declarative, efficient, and flexible JavaScript library for building user interfaces.
🖖 Vue.js is a progressive, incrementally-adoptable JavaScript framework for building UI on the web.
TypeScript is a superset of JavaScript that compiles to clean JavaScript output.
An Open Source Machine Learning Framework for Everyone
The Web framework for perfectionists with deadlines.
A PHP framework for web artisans
Bring data to life with SVG, Canvas and HTML. 📊📈🎉
JavaScript (JS) is a lightweight interpreted programming language with first-class functions.
Some thing interesting about web. New door for the world.
A server is a program made to process requests and deliver data to clients.
Machine learning is a way of modeling and interpreting data that allows a piece of software to respond intelligently.
Some thing interesting about visualization, use data art
Some thing interesting about game, make everyone happy.
We are working to build community through open source technology. NB: members must have two-factor auth.
Open source projects and samples from Microsoft.
Google ❤️ Open Source for everyone.
Alibaba Open Source for everyone
Data-Driven Documents codes.
China tencent open source team.
