phoenixframework / phoenix_live_dashboard Goto Github PK
View Code? Open in Web Editor NEWRealtime dashboard with metrics, request logging, plus storage, OS and VM insights
License: MIT License
Realtime dashboard with metrics, request logging, plus storage, OS and VM insights
License: MIT License


![dependabot[bot] avatar](https://avatars.githubusercontent.com/in/29110?v=4 "dependabot[bot]")


I started a discussion here but I think it deserves an issue of its own to discuss the appropriate API and desired requirements, and to gauge other users interest.
I’d like the ability when opening the dashboard in production to have some buffered data displayed there immediately. In my use case I’d like it to come from a circular buffer but @josevalim made it clear that though he’s open to a hook for this, no actual buffering will occur within live_dashboard itself, so the source could just as easily be Redis or a database query. I think the value would be substantial (and I’d like to make an example integration perhaps with a generator in the project to help guide users interested in this) since it will give some context when opening the dashboard of already in the middle of some kind of event to perhaps see patterns of activity preceding that event, but it’s hard to predict and of course it won’t meet everyone’s use case and probably can’t and shouldn’t display more than 30-90 minutes of data in practice, though I doubt that should be enforced or concerned with here. The first question I think is whether the hook is initiated client or server side, and whether announced via a telemetry execute event or a channel broadcast or some other mechanism I’m not thinking of.
The app blows up while compiling for prod, here is the error:
 == Compilation error in file lib/phoenix/live_dashboard/layout_view.ex ==
 ** (UndefinedFunctionError) function ScoutApm.Instruments.EExEngine.compile/2 is undefined (module ScoutApm.Instruments.EExEngine is not available)
     ScoutApm.Instruments.EExEngine.compile("lib/phoenix/live_dashboard/templates/layout/dash.html.eex", "dash.html")
     (phoenix 1.4.16) lib/phoenix/template.ex:355: Phoenix.Template.compile/3
     (phoenix 1.4.16) lib/phoenix/template.ex:166: anonymous fn/4 in Phoenix.Template."MACRO-__before_compile__"/2
     (elixir 1.10.2) lib/enum.ex:2111: Enum."-reduce/3-lists^foldl/2-0-"/3
     (phoenix 1.4.16) expanding macro: Phoenix.Template.__before_compile__/1
     lib/phoenix/live_dashboard/layout_view.ex:1: Phoenix.LiveDashboard.LayoutView (module)
relevant scout config in config.exs
config :phoenix, :template_engines,
  eex: ScoutApm.Instruments.EExEngine,
  exs: ScoutApm.Instruments.ExsEngine
app deps
  defp deps do
    [
      {:phoenix, "~> 1.4.11"},
      {:phoenix_pubsub, "~> 1.1"},
      {:phoenix_ecto, "~> 4.0"},
      {:ecto_sql, "~> 3.1"},
      {:postgrex, ">= 0.0.0"},
      {:phoenix_html, "~> 2.11"},
      {:phoenix_live_reload, "~> 1.2", only: :dev},
      {:gettext, "~> 0.11"},
      {:jason, "~> 1.0"},
      {:plug_cowboy, "~> 2.0"},
      {:csv, "~> 2.3"},
      {:phoenix_live_view, "~> 0.12.0"},
      {:sentry, "~> 7.0"},
      {:scout_apm, "~> 1.0.6"},
      {:credo, "~> 1.3", only: [:dev, :test], runtime: false},
      {:phoenix_live_dashboard, "~> 0.1"}
    ]
endUsing phoenix 1.4.15 & phoenix_live_view 0.9.0 I get the following error when visiting the live dashboard link:
function :"Elixir.false.Phoenix.LiveDashboard.HomeLive".__live__/0 is undefined (module :"Elixir.false.Phoenix.LiveDashboard.HomeLive" is not available)
I would like to add some tooltips that explains some of the terms in the dashboard. The idea is that we would have a question mark that, on mouse over, shows extra information.
For example, for "Run queues" we could explain what the "Run queues" are. Below is a screenshot of what I have in mind, with the tooltip locations drawn in red (although in practice they won't be red and they will be smaller). There are four of them, one for run queues and one for each limit:

@archdragon I would appreciate if you could provide a template for these things, for now you can use "Lorem Ipsum" as the default and I will fill them in later. ❤️
Ref: #75 (comment)
cc @josevalim
Hello! I believe I have found a bug related to nested paths, similar to #64
I have a Phoenix application that serves requests behind an edge router. The edge router strips path prefixes when routing to services. For example, requests made to http://my-router.com/my-phoenix-app/foo/bar are routed to the Phoenix path /foo/bar.
To account for this, I added the stripped path prefix back in when generating Phoenix URLs by configuring our application's Endpoint like so:
config :my_phoenix_app, MyPhoenixApp.Endpoint, url: [path: "/my-phoenix-app"]Following the installation guides, I have this snippet added to my Router:
live_dashboard("/dashboard")When I navigate to http://my-router.com/my-phoenix-app/dashboard I see the dashboard as expected, and the web-socket connection established. However, the dashboard is unable to redirect from http://my-router.com/my-phoenix-app/foo/bar/dashboard to http://my-router.com/my-phoenix-app/foo/bar/dashboard/nonode%40nohost and raises the following error:
** (ArgumentError) cannot invoke handle_params nor live_redirect/live_link to "http://my-router.com/my-phoenix-app/foo/bar/dashboard/nonode%40nohost" because it isn't defined in MyPhoenixApp.Router
I was able to work around this issue by adding an additional route including the stripped path prefix, but this feels sub-optimal:
live_dashboard("/dashboard")
live_dashboard("/my-phoenix-app/dashboard")
I'm not sure if this is the expected behavior or a bug in Phoenix Live Dashboard or Phoenix Live View. If it is a bug, I am happy to help fix it with a bit of guidance. Thanks!
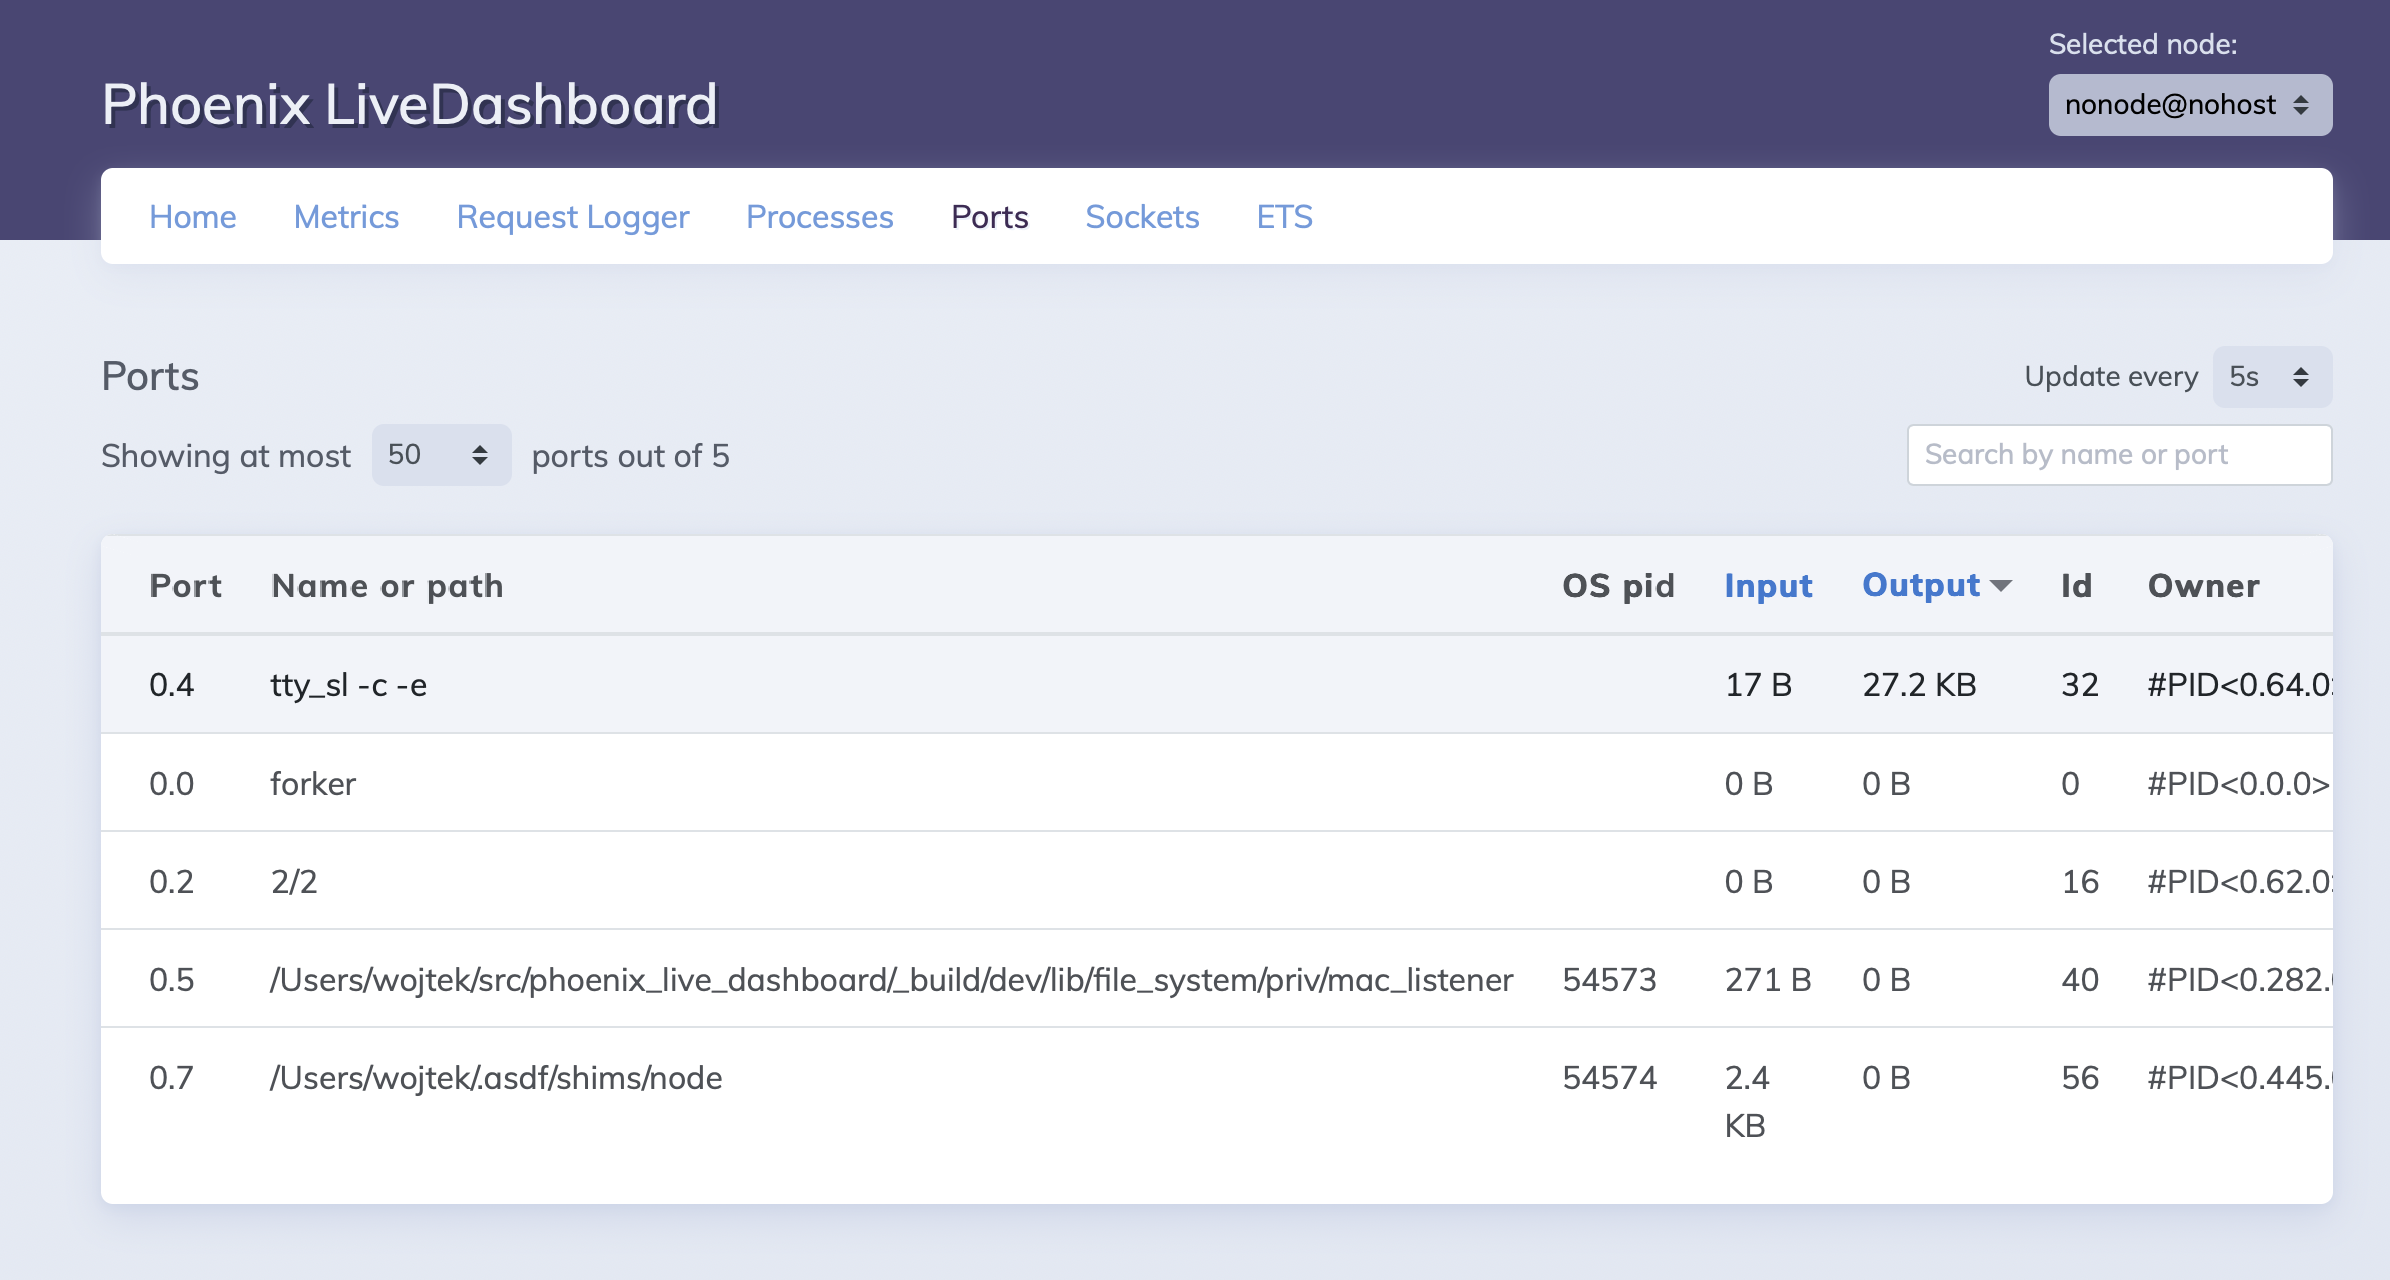
Similar to processes, but does Port.info.
at acess the route "/dashboard" I receive a error message by session nil
Howdy 👋
Great work so far gents! Have you put any thought into how or if you'll handle multiple screen sizes? Ideally I'd love the dashboard to be responsive to screen size so I can fully utilize my 27" screen. Something along these lines
iPad Pro & smaller: Stack charts in a single column<= 1900px: Current 2 col layout<= 2400px: 3 col layout> 2400px: 4 col layoutIt would be nice to define custom tabs with application-specific metrics defined by the User. The was a similar effort in the OTP observer here erlang/otp#1954. Can something like this be considered?
I've got an app that is only accessible on a specific path of my url (in my case, /app). I need to have the js client connect it's socket to /app/live instead of /live. It looks like that is hard-coded here:
https://github.com/phoenixframework/phoenix_live_dashboard/blob/master/lib/phoenix/live_dashboard/templates/layout/dash.html.eex#L2
I'd love to contribute if this is a desired feature but I'm pretty new to elixir/phoenix so I'd need to be pointed in the right direction. I'm not sure which of these is the right way to accomplish this:
we should either wrap in the column which is probably going to be ugly, or trim the path (and display the full path on hover) like this:

wdyt?
Similar to processes, but works with sockets.
If you want to monitor the metrics of your application, chances are you would want to cycle between viewing your app's tab, Phoenix's tab and the VM's tab without having each tab get 100% wiped out in between switching tabs.
Could an option be introduced to persist the stats for the lifetime of the socket? This way we can jump between each metric, home and processes without losing the state on each page transition.
Otherwise it looks like you'll need to open 5 browser tabs to watch each thing individually without losing the previous stats.
elixir -v
Erlang/OTP 22 [erts-10.6.3] [source] [64-bit] [smp:8:8] [ds:8:8:10] [async-threads:1] [hipe] [dtrace]

Elixir 1.10.0 (compiled with Erlang/OTP 22)
mix deps
* exldap 0.6.3 (Hex package) (mix)
  locked at 0.6.3 (exldap) 412fafab
  ok
* parse_trans 3.3.0 (Hex package) (rebar3)
  locked at 3.3.0 (parse_trans) 17ef63ab
  ok
* elixir_uuid 1.2.1 (Hex package) (mix)
  locked at 1.2.1 (elixir_uuid) f7eba2ea
  ok
* mimerl 1.2.0 (Hex package) (rebar3)
  locked at 1.2.0 (mimerl) f2785856
  ok
* connection 1.0.4 (Hex package) (mix)
  locked at 1.0.4 (connection) 4a0850c9
  ok
* nimble_parsec 0.5.3 (Hex package) (mix)
  locked at 0.5.3 (nimble_parsec) 589b5af5
  ok
* makeup 1.0.1 (Hex package) (mix)
  locked at 1.0.1 (makeup) 49736fe5
  ok
* metrics 1.0.1 (Hex package) (rebar3)
  locked at 1.0.1 (metrics) 69b09add
  ok
* bunt 0.2.0 (Hex package) (mix)
  locked at 0.2.0 (bunt) 7af5c7e0
  ok
* unicode_util_compat 0.4.1 (Hex package) (rebar3)
  locked at 0.4.1 (unicode_util_compat) 1d1848c4
  ok
* idna 6.0.0 (Hex package) (rebar3)
  locked at 6.0.0 (idna) 4bdd305e
  ok
* gettext 0.17.4 (Hex package) (mix)
  locked at 0.17.4 (gettext) 3c75b5ea
  ok
* jose 1.10.1 (Hex package) (mix)
  locked at 1.10.1 (jose) 3c7ddc8a
  ok
* ranch 1.3.2 (Hex package) (rebar3)
  locked at 1.3.2 (ranch) 6e56493a
  ok
* poolboy 1.5.2 (Hex package) (rebar3)
  locked at 1.5.2 (poolboy) dad79704
  ok
* telemetry 0.4.1 (Hex package) (rebar3)
  locked at 0.4.1 (telemetry) 4738382e
  ok
* telemetry_poller 0.5.0 (Hex package) (rebar3)
  locked at 0.5.0 (telemetry_poller) 69e4e8e6
  ok
* telemetry_metrics 0.4.2 (Hex package) (mix)
  locked at 0.4.2 (telemetry_metrics) e56ffed2
  ok
* decimal 1.8.1 (Hex package) (mix)
  locked at 1.8.1 (decimal) 3cb154b0
  ok
* jason 1.2.0 (Hex package) (mix)
  locked at 1.2.0 (jason) 116747db
  ok
* poison 3.1.0 (Hex package) (mix)
  locked at 3.1.0 (poison) fec8660e
  ok
* json_web_token 0.2.10 (Hex package) (mix)
  locked at 0.2.10 (json_web_token) 020c62f3
  ok
* ssl_verify_fun 1.1.5 (Hex package) (mix)
  locked at 1.1.5 (ssl_verify_fun) 13104d78
  ok
* paddle 0.1.4 (Hex package) (mix)
  locked at 0.1.4 (paddle) fc719a9e
  ok
* elixir_make 0.6.0 (Hex package) (mix)
  locked at 0.6.0 (elixir_make) d522695b
  ok
* bcrypt_elixir 1.1.1 (Hex package) (mix)
  locked at 1.1.1 (bcrypt_elixir) 10f658be
  ok
* comeonin 4.1.2 (Hex package) (mix)
  locked at 4.1.2 (comeonin) d8700a0c
  ok
* certifi 2.5.1 (Hex package) (rebar3)
  locked at 2.5.1 (certifi) 805abd97
  ok
* hackney 1.15.2 (Hex package) (rebar3)
  locked at 1.15.2 (hackney) e0100f8e
  ok
* earmark 1.4.3 (Hex package) (mix)
  locked at 1.4.3 (earmark) 8cf8a291
  ok
* db_connection 2.2.1 (Hex package) (mix)
  locked at 2.2.1 (db_connection) 2b02ece6
  ok
* httpoison 1.6.2 (Hex package) (mix)
  locked at 1.6.2 (httpoison) aa2c74bd
  ok
* credo 1.1.5 (Hex package) (mix)
  locked at 1.1.5 (credo) d0bbd322
  ok
* ecto 3.3.4 (Hex package) (mix)
  locked at 3.3.4 (ecto) 9b96cbb8
  ok
* ex_json_schema 0.7.3 (Hex package) (mix)
  locked at 0.7.3 (ex_json_schema) d5389c44
  ok
* makeup_elixir 0.14.0 (Hex package) (mix)
  locked at 0.14.0 (makeup_elixir) d4b316c7
  ok
* ex_doc 0.21.3 (Hex package) (mix)
  locked at 0.21.3 (ex_doc) 0db1ee8d
  ok
* phoenix_pubsub 2.0.0 (Hex package) (mix)
  locked at 2.0.0 (phoenix_pubsub) c52d948c
  ok
* cowlib 1.0.2 (Hex package) (rebar3)
  locked at 1.0.2 (cowlib) db622da0
  ok
* cowboy 1.1.2 (Hex package) (rebar3)
  locked at 1.1.2 (cowboy) f4763bbe
  ok
* mime 1.3.1 (Hex package) (mix)
  locked at 1.3.1 (mime) 6cbe761d
  ok
* artificery 0.4.2 (Hex package) (mix)
  locked at 0.4.2 (artificery) 514586f4
  ok
* distillery 2.1.1 (Hex package) (mix)
  locked at 2.1.1 (distillery) bbc7008b
  ok
* edeliver 1.8.0 (Hex package) (mix)
  locked at 1.8.0 (edeliver) 02ef9bed
  ok
* myxql 0.3.4 (Hex package) (mix)
  locked at 0.3.4 (myxql) fc8d49ba
  ok
* ecto_sql 3.3.4 (Hex package) (mix)
  locked at 3.3.4 (ecto_sql) 5eccbdbf
  ok
* plug_crypto 1.1.2 (Hex package) (mix)
  locked at 1.1.2 (plug_crypto) 6b8b608f
  ok
* plug 1.10.0 (Hex package) (mix)
  locked at 1.10.0 (plug) 422a9727
  ok
* plug_cowboy 1.0.0 (Hex package) (mix)
  locked at 1.0.0 (plug_cowboy) 01d20142
  ok
* guardian 2.1.1 (Hex package) (mix)
  locked at 2.1.1 (guardian) 189b87ba
  ok
* phoenix_swagger 0.8.2 (Hex package) (mix)
  locked at 0.8.2 (phoenix_swagger) e6d17776
  ok
* cors_plug 1.5.2 (Hex package) (mix)
  locked at 1.5.2 (cors_plug) 9af027d2
  ok
* phoenix_html 2.14.1 (Hex package) (mix)
  locked at 2.14.1 (phoenix_html) 536d5200
  ok
* phoenix 1.5.1 (Hex package) (mix)
  locked at 1.5.1 (phoenix) fc272b38
  ok
* phoenix_live_view 0.12.1 (Hex package) (mix)
  locked at 0.12.1 (phoenix_live_view) 585321e9
  ok
* phoenix_live_dashboard 0.2.0 (Hex package) (mix)
  locked at 0.2.0 (phoenix_live_dashboard) 439628ca
  ok
* phoenix_ecto 3.5.0 (Hex package) (mix)
  locked at 3.5.0 (phoenix_ecto) b9602822
  ok
uname -a
Darwin  18.7.0 Darwin Kernel Version 18.7.0: Thu Jan 23 06:52:12 PST 2020; root:xnu-4903.278.25~1/RELEASE_X86_64 x86_64
When we add the following lines in router.ex we get a error
  scope "/" do
    pipe_through [:browser, :admins_only]
    live_dashboard("/dashboard"), metrics: JunctionApiWeb.Telemetry
  end
ERROR:
unexpectedly reached end of line. The current expression is invalid or incomplete
    (elixir 1.10.0) lib/kernel/parallel_compiler.ex:233: anonymous fn/4 in Kernel.ParallelCompiler.spawn_workers/7
Expected behavior would be running the telemetry events
When creating a counter like counter("my_app.new_registration.count", tags: [:user_type]) and referencing a measurement that does not exist (like :count in this instance), the extract_measurement/2 function returns nil, which is falsey and the event doesn't update the charts
https://github.com/akoutmos/phoenix_live_dashboard/blob/master/lib/phoenix/live_dashboard/telemetry_listener.ex#L23
According to the docs on counters, the measurement that is selected should be ignored by the reporter as it is not used (https://hexdocs.pm/telemetry_metrics/Telemetry.Metrics.html#counter/2). As such, ending your event name with a key that does not exist in the measurements map should still increment the counter.
At first glance it seems like it may just be as simple as adding the following prior to the existing function:
defp extract_measurement(%Telemetry.Metrics.Counter{} = _metric, _measurement), do: 1Huge thanks for effort put into LiveDashboard...I have really been enjoying using it and adding it to my apps :). It is tools like this that make the Elixir developer experience top notch 👍
Dashboard reports memory at ~97%, 14.8/15.5GB.
Only about 9 GB are in use. Linux has very aggressive caching, so it's a bit tricky to meter actual ram use ("memory pressure").
  @memory_usage_sections [
    {"Used", :minus, :free_memory, :system_total_memory,
     "The amount of memory used from the available memory"},
  ]
According to memsup docs, I think Linux free memory should be free_memory + cached_memory + buffered_memory?
The chart dataset assign(s) should be temporary assigns so we don't hold them in memory after we send them down
The memory usage pane is on master, only style pending. /cc @archdragon
/cc @archdragon
I followed this full procedure to add metrics.
https://hexdocs.pm/phoenix_live_dashboard/metrics.html#installing-metrics
also added it as Children
defmodule EvercamMedia do
  use Application
  require Logger
  import EvercamMedia.Util, only: [load_storage_servers: 1]

  # See http://elixir-lang.org/docs/stable/elixir/Application.html
  # for more information on OTP Applications
  def start(_type, _args) do
    import Supervisor.Spec, warn: false

    children = [
      EvercamMediaWeb.Telemetry,
      {Phoenix.PubSub, name: EvercamMedia.PubSub}
    ]

    :ets.new(:storage_servers, [:set, :public, :named_table])
    # See http://elixir-lang.org/docs/stable/elixir/Supervisor.html
    # for other strategies and supported options
    load_storage_servers([])
    opts = [strategy: :one_for_one, name: EvercamMedia.Supervisor]
    Supervisor.start_link(children, opts)
  end

  # Tell Phoenix to update the endpoint configuration
  # whenever the application is updated.
  def config_change(changed, _new, removed) do
    EvercamMediaWeb.Endpoint.config_change(changed, removed)
    :ok
  end
end
I got this error
[info] [swarm on nonode@nohost] [tracker:cluster_wait] no connected nodes, proceeding without sync
[info] GET /dashboard/nonode%40nohost/metrics/evercam_media
[debug] Processing with Phoenix.LiveView.Plug.metrics/2
  Parameters: %{"group" => "evercam_media", "node" => "nonode@nohost"}
  Pipelines: [:browser]
[info] Sent 200 in 287ms
[info] CONNECTED TO Phoenix.LiveView.Socket in 401µs
  Transport: :websocket
  Serializer: Phoenix.Socket.V2.JSONSerializer
  Parameters: %{"_csrf_token" => "AltfYy8QDGdqcXsVOSBLXwAENDg9Mign4902jgJ1Y68baE3iVCgvDzlb", "vsn" => "2.0.0"}
[error] GenServer #PID<0.2860.0> terminating
** (stop) exited in: GenServer.call({Phoenix.LiveDashboard.DynamicSupervisor, :nonode@nohost}, {:start_child, {{Phoenix.LiveDashboard.TelemetryListener, :start_link, [{#PID<0.2860.0>, [%Telemetry.Metrics.Summary{description: nil, event_name: [:evercam_media, :repo, :query], measurement: #Function<2.111777250/1 in Telemetry.Metrics.maybe_convert_measurement/2>, name: [:evercam_media, :repo, :query, :total_time], reporter_options: [], tag_values: #Function<0.111777250/1 in Telemetry.Metrics.default_metric_options/0>, tags: [], unit: :millisecond}, %Telemetry.Metrics.Summary{description: nil, event_name: [:evercam_media, :repo, :query], measurement: #Function<2.111777250/1 in Telemetry.Metrics.maybe_convert_measurement/2>, name: [:evercam_media, :repo, :query, :decode_time], reporter_options: [], tag_values: #Function<0.111777250/1 in Telemetry.Metrics.default_metric_options/0>, tags: [], unit: :millisecond}, %Telemetry.Metrics.Summary{description: nil, event_name: [:evercam_media, :repo, :query], measurement: #Function<2.111777250/1 in Telemetry.Metrics.maybe_convert_measurement/2>, name: [:evercam_media, :repo, :query, :query_time], reporter_options: [], tag_values: #Function<0.111777250/1 in Telemetry.Metrics.default_metric_options/0>, tags: [], unit: :millisecond}, %Telemetry.Metrics.Summary{description: nil, event_name: [:evercam_media, :repo, :query], measurement: #Function<2.111777250/1 in Telemetry.Metrics.maybe_convert_measurement/2>, name: [:evercam_media, :repo, :query, :queue_time], reporter_options: [], tag_values: #Function<0.111777250/1 in Telemetry.Metrics.default_metric_options/0>, tags: [], unit: :millisecond}, %Telemetry.Metrics.Summary{description: nil, event_name: [:evercam_media, :repo, :query], measurement: #Function<2.111777250/1 in Telemetry.Metrics.maybe_convert_measurement/2>, name: [:evercam_media, :repo, :query, :idle_time], reporter_options: [], tag_values: #Function<0.111777250/1 in Telemetry.Metrics.default_metric_options/0>, tags: [], unit: :millisecond}]}]}, :temporary, 5000, :worker, [Phoenix.LiveDashboard.TelemetryListener]}}, :infinity)
    ** (EXIT) no process: the process is not alive or there's no process currently associated with the given name, possibly because its application isn't started
    (elixir 1.10.2) lib/gen_server.ex:1013: GenServer.call/3
    lib/phoenix/live_dashboard/live/metrics_live.ex:25: Phoenix.LiveDashboard.MetricsLive.mount/3
    lib/phoenix_live_view/utils.ex:234: Phoenix.LiveView.Utils.maybe_call_mount!/3
    lib/phoenix_live_view/channel.ex:623: Phoenix.LiveView.Channel.verified_mount/4
    lib/phoenix_live_view/channel.ex:34: Phoenix.LiveView.Channel.handle_info/2
    (stdlib 3.9) gen_server.erl:637: :gen_server.try_dispatch/4
    (stdlib 3.9) gen_server.erl:711: :gen_server.handle_msg/6
    (stdlib 3.9) proc_lib.erl:249: :proc_lib.init_p_do_apply/3
Last message: {:mount, Phoenix.LiveView.Channel}
State: {%{"joins" => 0, "params" => %{"_csrf_token" => "AltfYy8QDGdqcXsVOSBLXwAENDg9Mign4902jgJ1Y68baE3iVCgvDzlb"}, "session" => "SFMyNTY.g2gDaAJhBHQAAAAHZAACaWRtAAAAFHBoeC1GZ2xvU0ZuOFdHYmxTd01oZAAKcGFyZW50X3BpZGQAA25pbGQACHJvb3RfcGlkZAADbmlsZAAJcm9vdF92aWV3ZAAoRWxpeGlyLlBob2VuaXguTGl2ZURhc2hib2FyZC5NZXRyaWNzTGl2ZWQABnJvdXRlcmQAHUVsaXhpci5FdmVyY2FtTWVkaWFXZWIuUm91dGVyZAAHc2Vzc2lvbnQAAAACbQAAAAdtZXRyaWNzaAJkACBFbGl4aXIuRXZlcmNhbU1lZGlhV2ViLlRlbGVtZXRyeWQAB21ldHJpY3NtAAAADnJlcXVlc3RfbG9nZ2VyZAADbmlsZAAEdmlld2QAKEVsaXhpci5QaG9lbml4LkxpdmVEYXNoYm9hcmQuTWV0cmljc0xpdmVuBgDaFhy3cQFiAAFRgA.a6DPDGPuRadCPJq80vqkCGLc8z3ug-9ZFLQYdkx-hhw", "static" => "SFMyNTY.g2gDaAJhBHQAAAADZAAKYXNzaWduX25ld2pkAAVmbGFzaHQAAAAAZAACaWRtAAAAFHBoeC1GZ2xvU0ZuOFdHYmxTd01obgYA6hYct3EBYgABUYA.9VUIHRNsswTLz6_vnqoV3WJLn-HHXKGnH2IzCbmVt6o", "url" => "http://localhost:4000/dashboard/nonode%40nohost/metrics/evercam_media"}, {#PID<0.2857.0>, #Reference<0.3442257689.696254467.90101>}, %Phoenix.Socket{assigns: %{}, channel: Phoenix.LiveView.Channel, channel_pid: nil, endpoint: EvercamMediaWeb.Endpoint, handler: Phoenix.LiveView.Socket, id: nil, join_ref: "4", joined: false, private: %{session: %{}}, pubsub_server: EvercamMedia.PubSub, ref: nil, serializer: Phoenix.Socket.V2.JSONSerializer, topic: "lv:phx-FgloSFn8WGblSwMh", transport: :websocket, transport_pid: #PID<0.2857.0>}}
[error] exited in: GenServer.call({Phoenix.LiveDashboard.DynamicSupervisor, :nonode@nohost}, {:start_child, {{Phoenix.LiveDashboard.TelemetryListener, :start_link, [{#PID<0.2860.0>, [%Telemetry.Metrics.Summary{description: nil, event_name: [:evercam_media, :repo, :query], measurement: #Function<2.111777250/1 in Telemetry.Metrics.maybe_convert_measurement/2>, name: [:evercam_media, :repo, :query, :total_time], reporter_options: [], tag_values: #Function<0.111777250/1 in Telemetry.Metrics.default_metric_options/0>, tags: [], unit: :millisecond}, %Telemetry.Metrics.Summary{description: nil, event_name: [:evercam_media, :repo, :query], measurement: #Function<2.111777250/1 in Telemetry.Metrics.maybe_convert_measurement/2>, name: [:evercam_media, :repo, :query, :decode_time], reporter_options: [], tag_values: #Function<0.111777250/1 in Telemetry.Metrics.default_metric_options/0>, tags: [], unit: :millisecond}, %Telemetry.Metrics.Summary{description: nil, event_name: [:evercam_media, :repo, :query], measurement: #Function<2.111777250/1 in Telemetry.Metrics.maybe_convert_measurement/2>, name: [:evercam_media, :repo, :query, :query_time], reporter_options: [], tag_values: #Function<0.111777250/1 in Telemetry.Metrics.default_metric_options/0>, tags: [], unit: :millisecond}, %Telemetry.Metrics.Summary{description: nil, event_name: [:evercam_media, :repo, :query], measurement: #Function<2.111777250/1 in Telemetry.Metrics.maybe_convert_measurement/2>, name: [:evercam_media, :repo, :query, :queue_time], reporter_options: [], tag_values: #Function<0.111777250/1 in Telemetry.Metrics.default_metric_options/0>, tags: [], unit: :millisecond}, %Telemetry.Metrics.Summary{description: nil, event_name: [:evercam_media, :repo, :query], measurement: #Function<2.111777250/1 in Telemetry.Metrics.maybe_convert_measurement/2>, name: [:evercam_media, :repo, :query, :idle_time], reporter_options: [], tag_values: #Function<0.111777250/1 in Telemetry.Metrics.default_metric_options/0>, tags: [], unit: :millisecond}]}]}, :temporary, 5000, :worker, [Phoenix.LiveDashboard.TelemetryListener]}}, :infinity)
    ** (EXIT) no process: the process is not alive or there's no process currently associated with the given name, possibly because its application isn't started
Installed LiveDashboard on our staging app and when I go to the dashboard URL the browser just constantly redirects between the two nodes running the app. It will pull up the initial screen and the pointer will be set to spinning. It will then go through 20 or so redirects before refreshing the page and trying all over again. Anyone else seen this behavior?
Elixir 1.10.2
Phoenix 1.4.16
Dashboard 0.1.1
Chrome 81
So someone reported that keeping the "Metrics" tab open after a long period of time ended-up consuming 5GB of memory. This makes sense, given that we keep pushing data to charts forever and ever. I am wondering if we should put an upper limit on the number of elements on the chart and start pruning old data once we go past N elements, for example, N = 10000.
Hi @leeoniya, if you don't mind, do you have any insights on what we can do here?
Now that we have added a new element to the menu, things break down a bit:

However, if this is too complicate to fix, we can leave it as is for now. /cc @archdragon
We have upgraded our app to use the latest Phoenix and setup Phoenix LiveView. Our staging environment runs on Racher and the Phoenix app sits behind haproxy. The web socket for LiveView connects to the server but when we navigate to the LiveDashboard the websocket gets a 403 and the page just retries over and over.
I would expect the WS to connect using the same method as the main WS. We use guardian for our auth. It is very strange behavior. Anyone else experiencing this?
I get the following error on application startup:
[info] CONNECTED TO Phoenix.LiveView.Socket in 2ms
  Transport: :websocket
  Serializer: Phoenix.Socket.V2.JSONSerializer
  Parameters: %{"_csrf_token" => "REDACTED", "vsn" => "2.0.0"}
[error] GenServer #PID<0.723.0> terminating
** (ArgumentError) assign @menu not available in eex template.

Please make sure all proper assigns have been set. If this
is a child template, ensure assigns are given explicitly by
the parent template as they are not automatically forwarded.

Available assigns: [:flash, :inner_content, :live_action, :live_module, :socket]
My app has been API-only prior to adding LiveDashboard, so maybe I'm missing some standard pieces for it? Everything does seem to be working regardless of this error.
This may require a separate hook where we can register the event listener and fire the resize for all the charts at once.
See https://leeoniya.github.io/uPlot/demos/resize.html for an example event listener.

HTTP stats are not coming up.
      summary("http.request.stop.duration", unit: {:native, :millisecond}),
      summary("http.request.post.duration", unit: {:native, :millisecond}),
      summary("http.request.get.duration", unit: {:native, :millisecond}),
I get a 404 when visiting the link https://hexdocs.pm/phoenix_live_dashboard from https://github.com/phoenixframework/phoenix_live_dashboard/blame/master/README.md#L3
Safari version 13.0.5
I recorded a gif using the dashboard in both Safari and Chrome side by side and on Safari we get errors.

Similar to processes, but work with ETS tables.
:os_mon to the :extra_applications listmix phx.serverThe request fails with FunctionClauseError: no function clause matching in Phoenix.LiveDashboard.OSMonLive.calculate_cpu_total/2 (see phoenix error page screenshot for details)
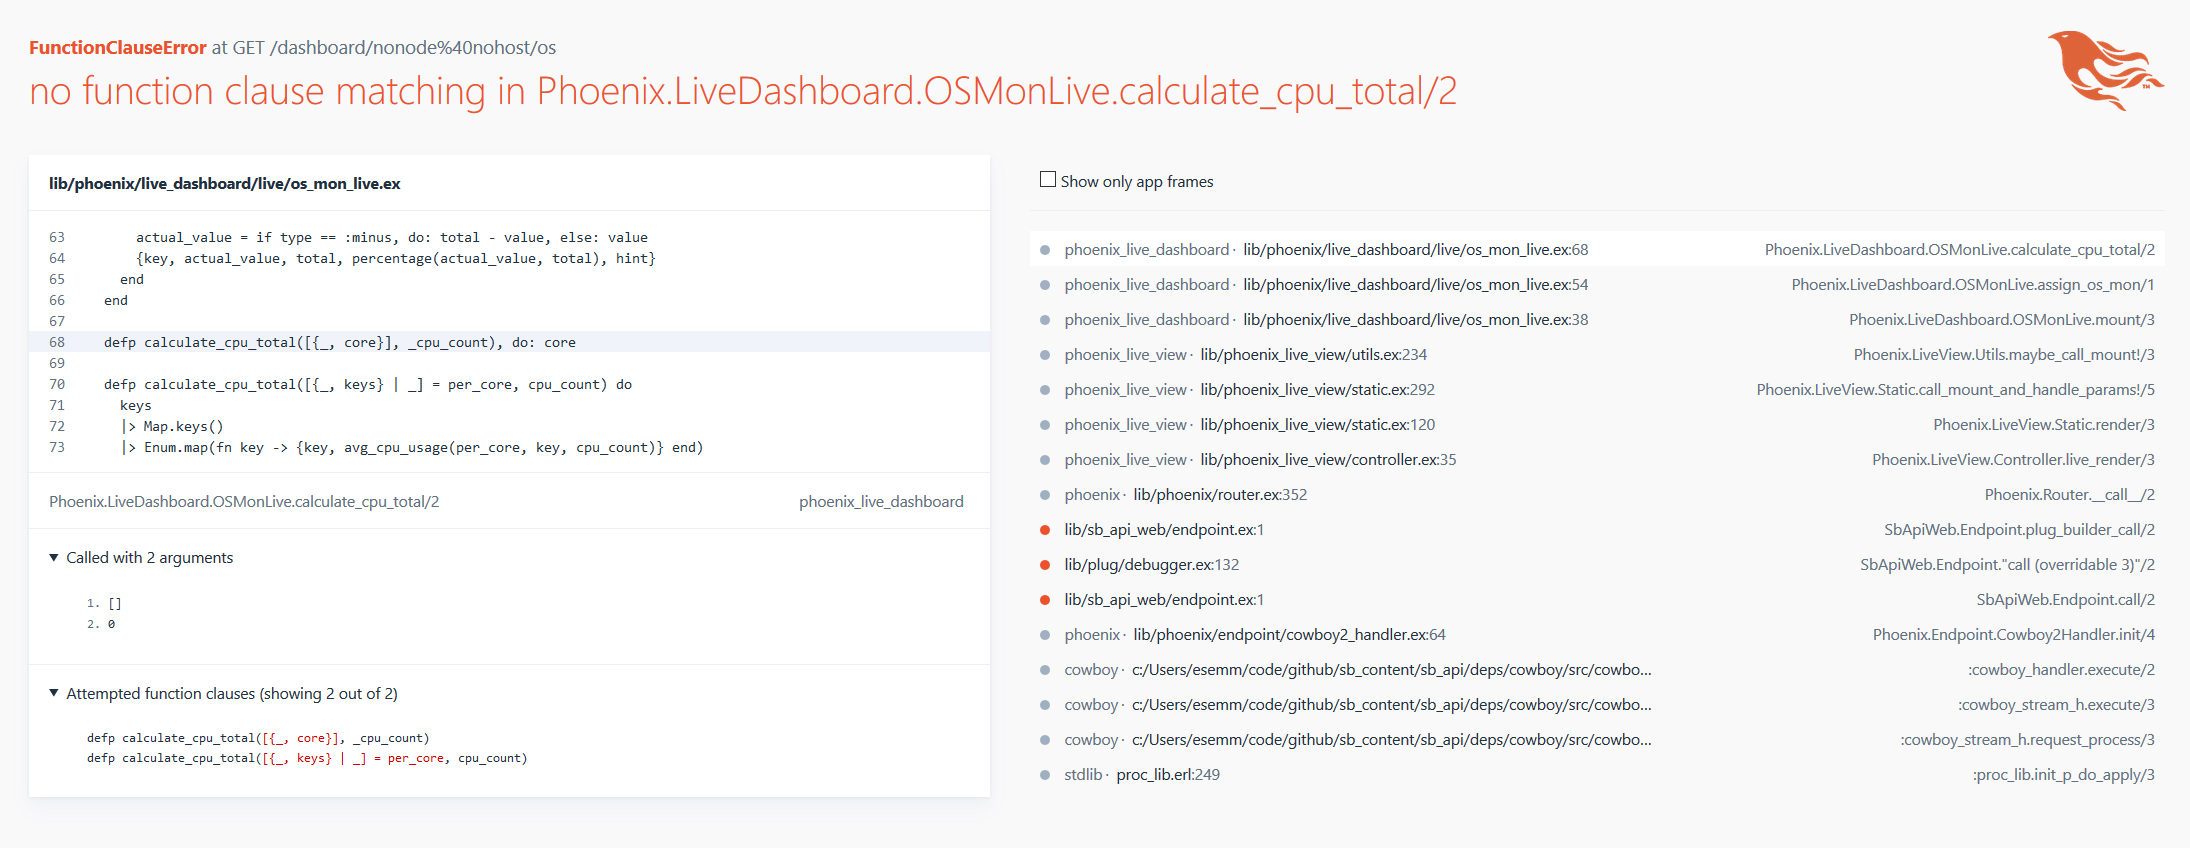
It seems that on Windows :os_mon does not support cpu metrics
Description
The operating system monitor, OS_Mon, provides the following services:
- cpu_sup CPU load and utilization supervision (Unix)
I confirmed this by manually trying to start the os_mon application on windows
iex(3)> :os_mon.start(nil, nil)
{:ok, #PID<0.106.0>}

iex(4)> :cpu_sup.util([:detailed, :per_cpu])

18:36:06.605 [warn]  OS_MON (:cpu_sup) called by #PID<0.102.0>, not started

{:all, 0, 0, []}The page should not break on Windows and should probably report inability to gather cpu stats
I added some simple styling just to keep the legend from "jumping around" too much on hover, but I'll leave the real styling to the professionals. :)
Check out the clip in the description for #40 to see what I mean.
I have added a process table, now we only need to style it before we add more tables. :)

/cc @archdragon
There are two broken links in the documentation. They both lead to https://hexdocs.pm/phoenix/telemetry.html.
I tried to figure out where those links were supposed to lead. There is no telemetry.md anywhere in https://github.com/phoenixframework/phoenix/tree/master/guides, but there used to be in this project, removed in #68.
Searching for :tele doesn't find :telemetry_poller_default, but searching for tele does.
Hi there,
I included Phoenix Live Dashboard in an existing application. It works fine, except the metrics, they throw JS errors:
Uncaught TypeError: Cannot read property '2' of undefined
    at VM23 cforum%40quirm:496
    at Array.map (<anonymous>)
    at Object.values (VM23 cforum%40quirm:496)
    at VM23 cforum%40quirm:496
    at Array.forEach (<anonymous>)
    at Dt (VM23 cforum%40quirm:496)
    at jt (VM23 cforum%40quirm:496)
    at Yt (VM23 cforum%40quirm:496)
    at dt (VM23 cforum%40quirm:496)
    at Object.ft [as setData] (VM23 cforum%40quirm:496)
    at e.value (VM23 cforum%40quirm:496)
    at e.value (VM23 cforum%40quirm:496)
    at e.updated (VM23 cforum%40quirm:496)
    at e.value (VM23 cforum%40quirm:496)
    at VM23 cforum%40quirm:496
    at VM23 cforum%40quirm:496
    at Array.forEach (<anonymous>)
    at e.value (VM23 cforum%40quirm:496)
    at VM23 cforum%40quirm:496
    at Array.forEach (<anonymous>)
    at e.value (VM23 cforum%40quirm:496)
    at e.value (VM23 cforum%40quirm:496)
    at e.value (VM23 cforum%40quirm:496)
    at VM23 cforum%40quirm:496
    at Set.forEach (<anonymous>)
    at VM23 cforum%40quirm:496
    at e.value (VM23 cforum%40quirm:496)
    at e.value (VM23 cforum%40quirm:496)
    at VM23 cforum%40quirm:496
    at VM23 cforum%40quirm:496
    at Object.callback (VM23 cforum%40quirm:496)
    at e.value (VM23 cforum%40quirm:496)
    at VM23 cforum%40quirm:496
    at e.decode (VM23 cforum%40quirm:496)
    at e.value (VM23 cforum%40quirm:496)
    at WebSocket.conn.conn.onmessage (VM23 cforum%40quirm:496)
Did I do something wrong?
Note that some modules are disabled on some OSes: http://erlang.org/doc/man/os_mon_app.html
The unit label on the y-axis and in the legend is confusing for a counter, since the values are simply positive whole numbers.
EDIT: I never bothered to add a description here because I assumed I would handle the implementation. That was clearly a mistake so I am adding a description now.
My plan for the implementation had been to use a bar chart, like the uPlot "latency histogram" demo:

Except that demo didn't exist when I made this issue, so now we have a huge head start :)
In the initial implementation, the buckets will be user-defined: values are given in reporter_options as described in the distribution/2 docs:
# lib/my_app_web/telemetry.ex
distribution("phoenix.router_dispatch.stop.duration",
  unit: {:native, :millisecond},
  reporter_options: [
    buckets: [200, 500, 1000]
  ]
)
...which would create a bar chart with four buckets:
-Inf – 200200 – 500500 – 10001000 – +InfThe trickier part is how to handle multi-series data, but we can solve that in a separate issue.
I recently build a liveview dashboard for a nerves device (cpu/memory usage) and needed to switch out chart.js at some time after choosing smaller intervals / greater resolution. I settled on https://github.com/leeoniya/uPlot, but even just the chart in the readme might be interesting to look at https://github.com/leeoniya/uPlot#performance. I hope this is helpful. I'm not trying to suggest a switch is absolutely needed, but it's worth considering.
Readme in dire need for screenshots. You know, +200 popularity for peanuts
When following the README to add the dashboard to an existing Phoenix app I get the following error:
[error] #PID<0.4802.0> running TestyWeb.Endpoint (connection #PID<0.4794.0>, stream id 3) terminated
Server: localhost:4000 (http)
Request: GET /dashboard/nonode%40nohost
** (exit) an exception was raised:
    ** (KeyError) key :menu not found in: %Phoenix.LiveView.Socket.AssignsNotInSocket{}
        (phoenix_live_dashboard 0.1.0) lib/phoenix/live_dashboard/live/menu_live.ex:66: Phoenix.LiveDashboard.MenuLive.maybe_active_live_redirect/4
        (phoenix_live_dashboard 0.1.0) lib/phoenix/live_dashboard/live/menu_live.ex:23: anonymous fn/2 in Phoenix.LiveDashboard.MenuLive.render/1
        (phoenix_live_view 0.10.0) lib/phoenix_live_view/diff.ex:221: Phoenix.LiveView.Diff.traverse/5
        (phoenix_live_view 0.10.0) lib/phoenix_live_view/diff.ex:92: Phoenix.LiveView.Diff.render/3
        (phoenix_live_view 0.10.0) lib/phoenix_live_view/static.ex:274: Phoenix.LiveView.Static.to_rendered_content_tag/4
        (phoenix_live_dashboard 0.1.0) lib/phoenix/live_dashboard/templates/layout/live.html.leex:7: anonymous fn/2 in Phoenix.LiveDashboard.LayoutView."live.html"/1
        (phoenix_live_view 0.10.0) lib/phoenix_live_view/diff.ex:221: Phoenix.LiveView.Diff.traverse/5
        (phoenix_live_view 0.10.0) lib/phoenix_live_view/diff.ex:92: Phoenix.LiveView.Diff.render/3
        (phoenix_live_view 0.10.0) lib/phoenix_live_view/static.ex:274: Phoenix.LiveView.Static.to_rendered_content_tag/4
        (phoenix_live_view 0.10.0) lib/phoenix_live_view/static.ex:137: Phoenix.LiveView.Static.render/3
        (phoenix_live_view 0.10.0) lib/phoenix_live_view/controller.ex:35: Phoenix.LiveView.Controller.live_render/3
        (phoenix 1.4.16) lib/phoenix/router.ex:288: Phoenix.Router.__call__/2
        (testy 0.1.0) lib/testy_web/endpoint.ex:1: TestyWeb.Endpoint.plug_builder_call/2
        (testy 0.1.0) lib/plug/debugger.ex:132: TestyWeb.Endpoint."call (overridable 3)"/2
        (testy 0.1.0) lib/testy_web/endpoint.ex:1: TestyWeb.Endpoint.call/2
        (phoenix 1.4.16) lib/phoenix/endpoint/cowboy2_handler.ex:42: Phoenix.Endpoint.Cowboy2Handler.init/4
        (cowboy 2.7.0) /Users/me/Projects/testy/deps/cowboy/src/cowboy_handler.erl:41: :cowboy_handler.execute/2
        (cowboy 2.7.0) /Users/me/Projects/testy/deps/cowboy/src/cowboy_stream_h.erl:320: :cowboy_stream_h.execute/3
        (cowboy 2.7.0) /Users/me/Projects/testy/deps/cowboy/src/cowboy_stream_h.erl:302: :cowboy_stream_h.request_process/3
        (stdlib 3.12) proc_lib.erl:249: :proc_lib.init_p_do_apply/3
Adding something like Map.has_key?(socket.assigns, :menu) && to the if statements in lines 66 and 76 in lib/phoenix/live_dashboard/live/menu_live.ex helped.
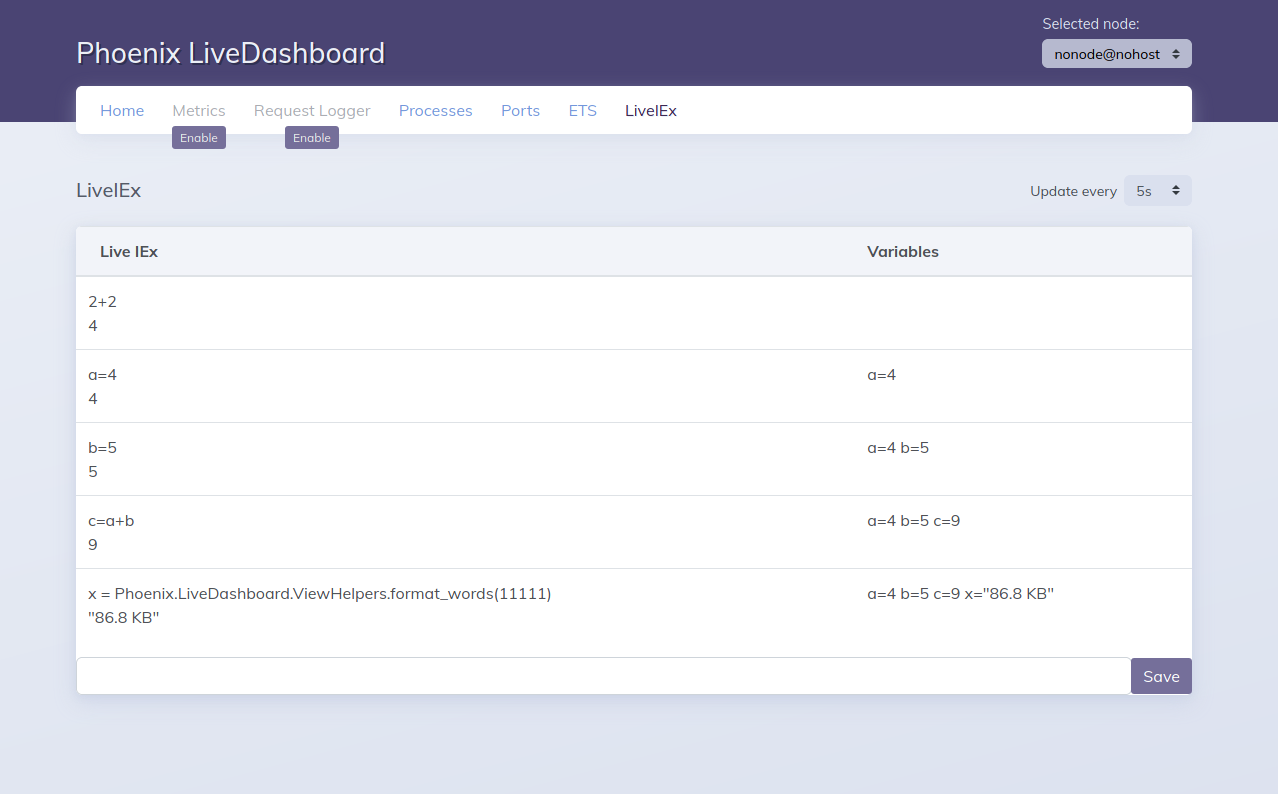
I created a proof of concept of iex - I use Code.string_eval currently but probably can be hooked up to real iex session. What are you thinking about something like that - Its useful but may be a security risk
Now that we are using OS Mon, we should probably setup the CI to run on Windows too.
The idea is to allow users to opt-in to displaying some env vars on the dashboard homepage. For example, when running on Gigalixir, it might be helpful to see the "SOURCE_VERSION" in the dashboard. AppSignal uses the var "APP_REVISION" to similar effect.
Selected env vars could be configured for display on the live_dashboard route, like so:
live_dashboard "/dashboard",
  metrics: MyAppWeb.Telemetry,
  environment: ["SOURCE_VERSION", "MY_ENV_VAR"]
Note: LiveDashboard would not define any "magic" env vars for any purpose -- the user can choose which of their env vars they would like to see displayed.
It would be useful to have a way to add own pages, I have some Ideas like calling ps aux and displaying the data on a page but its not something we want to have upstream probably.
also customizing the app.css name in the config - this way it can be branded like the rest of the app
Erlang ships with support for alarms in the SASL application. We could show any active alarm directly from the dashboard topbar and allow the user to dismiss it. Here is the Erlang API: http://erlang.org/doc/man/alarm_handler.html
We would need some UI for it first. :) Probably the a bell, like we see on github on the top right, which shows a counter of active alarms for us to interact with.
A declarative, efficient, and flexible JavaScript library for building user interfaces.
🖖 Vue.js is a progressive, incrementally-adoptable JavaScript framework for building UI on the web.
TypeScript is a superset of JavaScript that compiles to clean JavaScript output.
An Open Source Machine Learning Framework for Everyone
The Web framework for perfectionists with deadlines.
A PHP framework for web artisans
Bring data to life with SVG, Canvas and HTML. 📊📈🎉
JavaScript (JS) is a lightweight interpreted programming language with first-class functions.
Some thing interesting about web. New door for the world.
A server is a program made to process requests and deliver data to clients.
Machine learning is a way of modeling and interpreting data that allows a piece of software to respond intelligently.
Some thing interesting about visualization, use data art
Some thing interesting about game, make everyone happy.
We are working to build community through open source technology. NB: members must have two-factor auth.
Open source projects and samples from Microsoft.
Google ❤️ Open Source for everyone.
Alibaba Open Source for everyone
Data-Driven Documents codes.
China tencent open source team.