Giter VIP home page Giter VIP logo

multi-verse's Introduction

Published on webcomponents.org Netlify Status

<multi-verse>

Polymer elements for graphical and interactive multivariate analysis (built on top of universe) and using d3.js V5, crossfilter and reductio under the hood.

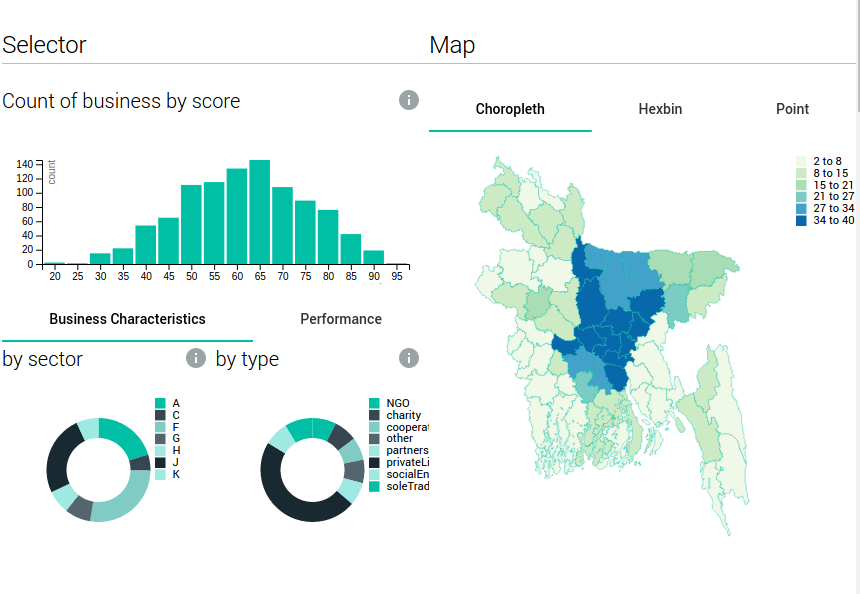
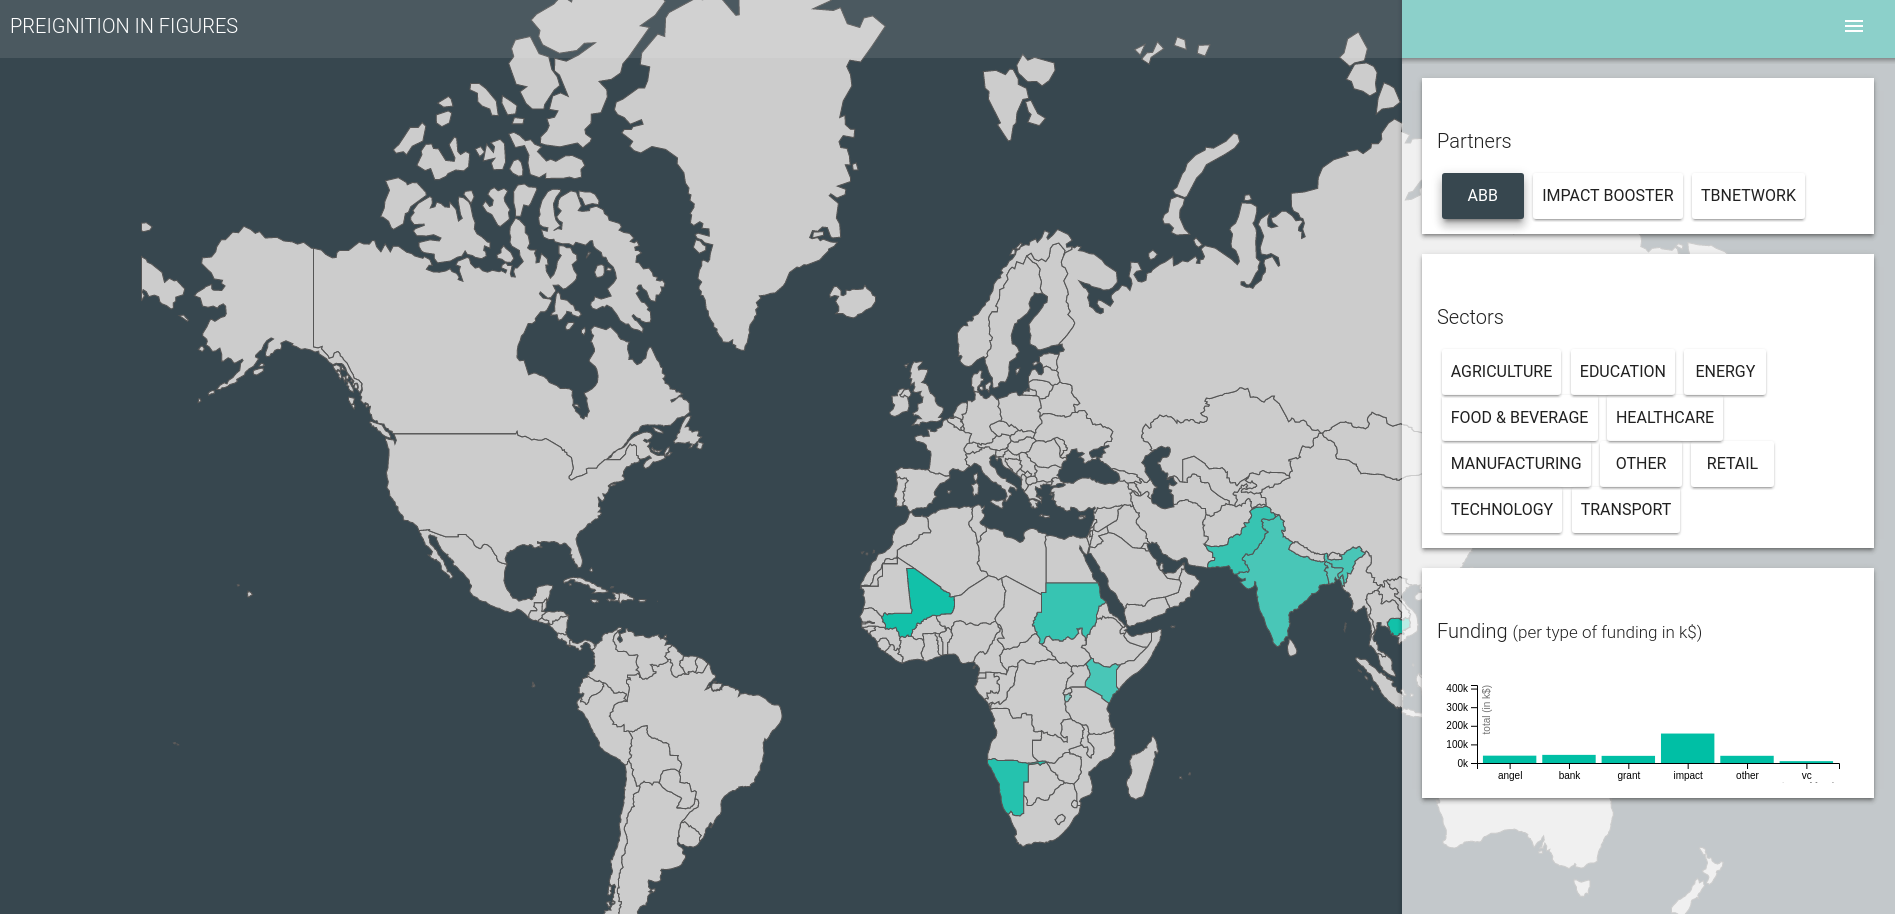
Charts are rendered using multi-chart, or multi-geo for geo charts like choropleth. They are data driven and reactive, providing instant feedback to user interaction.

Motivation

Multi-verse is inspired by dc.js, a charting library allowing highly efficient exploration on large multi-dimensional datasets.

While dc.js requires users to code some of the chart logic and data intagration in javascript, multi-verse proposes a markup-first approach. This allows to build complex dashboard simply by combining multi-verse and multi-chart web components together, as illustrated in the example below.

Multi-verse components leverages crossfilter and are responsible for data management (aggregation, sorting, grouping), while multi-charts components render processed data in customizable visulalizations.

Demo and API

Demo and API are now available on netlify.

Simple Example

 <!-- Load the data -->
 <multi-csv url="flight.csv" data="{{data}}"></multi-csv>

 <!-- Start a multi-verse -->
 <multi-verse id="universe" data="[[data]]" universe="{{universe}}">

   <!-- Group the data by distances, exposes grouped data under 'data' attribute -->
   <multi-group universe="[[universe]]" data="{{data-chart-distance}}" group-by="distances">

     <!-- Render this group in a bar chart-->
     <multi-verse-bar title="distance" data="[[data-chart-distance]]">
     </multi-verse-bar>
    
   </multi-group>

   <!-- Group the data by day-->
   <multi-group universe="[[universe]]" data="{{data-chart-day}}" group-by="day">

     <!-- Render this group in a pie chart-->
     <multi-verse-pie title="day (pie)" data="[[data-chart-day]]" color-scale="{{colorScale}}" width="{{width}}">

       <!-- Add a color scale legend to the chart -->
       <multi-legend legend chart-width="[[width]]" scale="[[colorScale]]" position="top-right">
       </multi-legend>
      
     </multi-verse-pie>
    
   </multi-group>
  
 </multi-verse>

Example of multi-verse in a interactive dashboard

Other advanced example - available from the demo

multi-verse's People

Contributors

abbeysside avatar christophe-g avatar

Stargazers

 avatar  avatar  avatar  avatar  avatar  avatar  avatar  avatar  avatar  avatar  avatar  avatar  avatar  avatar  avatar  avatar  avatar  avatar  avatar  avatar  avatar  avatar  avatar  avatar  avatar  avatar  avatar  avatar  avatar  avatar  avatar  avatar  avatar  avatar  avatar

Watchers

 avatar  avatar  avatar  avatar  avatar  avatar

multi-verse's Issues

Can't run demo

How can I best try this component out?
vaadin-grid dependency seems to be missing, paper-input is 3.x so the html file can't be imported (missing).

I cloned the component repo, ran polymer install and polymer serve.
Anything else I should do?

Recommend Projects

  • React photo React

    A declarative, efficient, and flexible JavaScript library for building user interfaces.

  • Vue.js photo Vue.js

    ๐Ÿ–– Vue.js is a progressive, incrementally-adoptable JavaScript framework for building UI on the web.

  • Typescript photo Typescript

    TypeScript is a superset of JavaScript that compiles to clean JavaScript output.

  • TensorFlow photo TensorFlow

    An Open Source Machine Learning Framework for Everyone

  • Django photo Django

    The Web framework for perfectionists with deadlines.

  • D3 photo D3

    Bring data to life with SVG, Canvas and HTML. ๐Ÿ“Š๐Ÿ“ˆ๐ŸŽ‰

Recommend Topics

  • javascript

    JavaScript (JS) is a lightweight interpreted programming language with first-class functions.

  • web

    Some thing interesting about web. New door for the world.

  • server

    A server is a program made to process requests and deliver data to clients.

  • Machine learning

    Machine learning is a way of modeling and interpreting data that allows a piece of software to respond intelligently.

  • Game

    Some thing interesting about game, make everyone happy.

Recommend Org

  • Facebook photo Facebook

    We are working to build community through open source technology. NB: members must have two-factor auth.

  • Microsoft photo Microsoft

    Open source projects and samples from Microsoft.

  • Google photo Google

    Google โค๏ธ Open Source for everyone.

  • D3 photo D3

    Data-Driven Documents codes.