Giter VIP home page Giter VIP logo

prisma2020's Introduction

Check & Deploy GitHub release (latest by date) GitHub Repo stars DOI DOI ko-fi

PRISMA2020 Flow Diagram

You can use this package to produce a flow diagram that conforms to the PRISMA 2020 standards using the PRISMA_flowdiagram() function. The data can be manually entered into the function, or loaded up using the template CSV file provided in 'INST/EXTDATA/'. The function, (if 'interactive = TRUE') produces an interactive HTML ouput with each box linking to a specific page (e.g. of search results or methods details), and hover-over tooltips for further information.

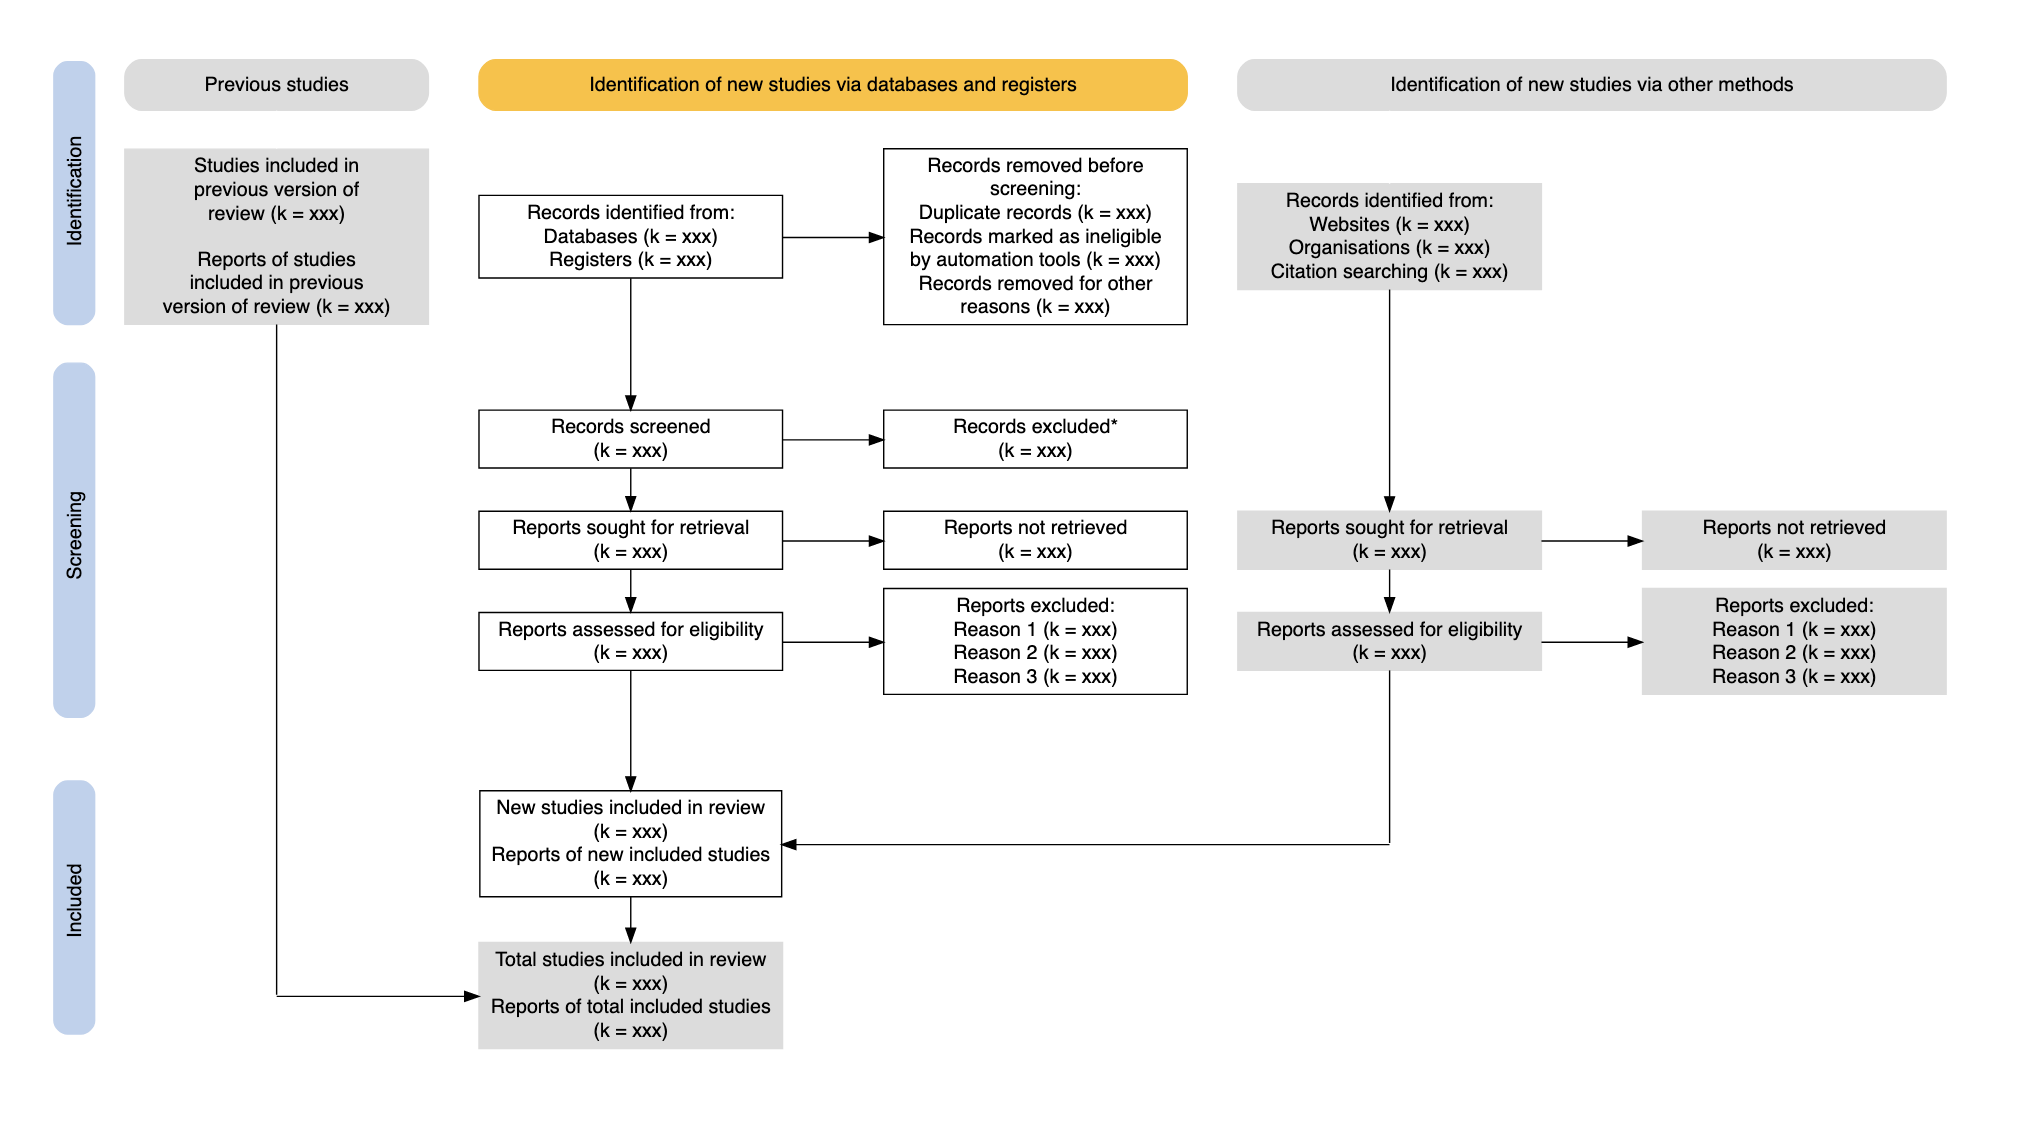
The 'Previous' and 'Other' study arms of the flowchart can be toggled on and off and removed or added to the diagram by specifying this in the function inputs.

A static version is produced otherwise.

See the interactive template here.

Visit the web-based Shiny app for a point-and-click user interface here.


Docker Installation

You can quickly install the PRISMA2020 package and run the included example shinyapp using Docker.

docker build . -t prisma-shiny:1
docker run -it --rm -p 3838:3838 prisma-shiny:1

Then visit http://localhost:3838/app in your web browser. To stop the app, press Ctrl+C in the terminal.


Please cite as:
Haddaway, N. R., Page, M. J., Pritchard, C. C., & McGuinness, L. A. (2022). PRISMA2020: An R package and Shiny app for producing PRISMA 2020-compliant flow diagrams, with interactivity for optimised digital transparency and Open Synthesis. Campbell Systematic Reviews, 18, e1230. https://doi.org/10.1002/cl2.1230
Citation in .ris format (right click 'Save Link As')

prisma2020's People

Contributors

chapb avatar chriscpritchard avatar hammady avatar mcguinlu avatar nealhaddaway avatar

Stargazers

 avatar  avatar  avatar  avatar  avatar  avatar  avatar  avatar  avatar  avatar  avatar  avatar  avatar  avatar  avatar  avatar  avatar  avatar  avatar  avatar  avatar  avatar  avatar  avatar  avatar  avatar  avatar  avatar  avatar  avatar  avatar  avatar  avatar  avatar  avatar  avatar  avatar  avatar  avatar  avatar  avatar  avatar  avatar  avatar  avatar  avatar  avatar  avatar  avatar  avatar  avatar  avatar  avatar  avatar  avatar  avatar  avatar  avatar  avatar  avatar  avatar  avatar  avatar  avatar  avatar  avatar  avatar  avatar  avatar  avatar  avatar  avatar  avatar  avatar  avatar  avatar  avatar  avatar  avatar  avatar  avatar  avatar  avatar  avatar  avatar  avatar  avatar  avatar  avatar  avatar  avatar  avatar  avatar  avatar  avatar  avatar  avatar  avatar  avatar  avatar

Watchers

 avatar  avatar  avatar  avatar  avatar  avatar  avatar  avatar

prisma2020's Issues

Specific Databases not working

I can't seem to get Specific Databases or Specific Registers to appear when pulling from the csv template via the R package.

I have tried setting the Databases (r6) and Registers (r8) rows to 'xxx', '', 'NA' in the 'n' column (H); and adding in some dummy numbers for the 3 default databases in the template.

I can get all other rows to edit as I wish, so I hope I am doing anything wrong, but any help/edits would be great.

If upload my csv onto the Shiny app it works, but doesn't when running on R.

Data sheet:
data_prisma.csv
R screenshot:
Screenshot 2023-01-25 122857

Customizable for umbrella review

I have a suggested feature request. I haven't been able to figure out how to add a new line in a box to report multiple numbers. I mostly conduct umbrella reviews, so in our PRISMA chart we often report many different numbers in a single flow chart box. For example, we often report the number of references (n) and reviews (k) assessed for eligibility. We aslo end up reporting the number of included reviews (k) and primary studies (j). It would be great to have a solution that allowed the user to choose the letter for the value reported (e.g., n, k, or j), and be able to report multiple in one box, if desired. One alternative could be to allow the user to modify the n variable in the template file with the full text of what they want shown ("n = 10; k = 5), rather than just numbers (10). Another option would be to allow the user to add boxes within existing nodes that would add a line in each box to provide more information.

Add a prisma_save() function

Hi @nealhaddaway,

I think it would be worth adding a convience prisma_save() function to the package which takes the output of PRISMA_flowchart() and saves to a file - I just recommended the pacakge to a friend who wasn't sure how to save the resulting image.

Additional warning message documentation

Is your feature request related to a problem? Please describe.
When I produce my PRISMA diagram, I get warnings like:

Warning message:
In PRISMA2020::PRISMA_flowdiagram(data = PRISMAdata_list, detail_databases = T,  :
  1.5

It's not clear what this refers to, as my PRISMA diagram looks fine.

Describe the solution you'd like
Some more documentation.

Describe alternatives you've considered
NA

Additional context
NA

Please add Instructions for CSV to landing page

I had to pull up the Preprint in order to learn how to use the CSV (i.e., which columns to edit vs leave untouched). ... I never found explanation that to turn off a box, I had to delete all text from the "n" column; I found that out by trial and error.

A few simple instructions, and perhaps a worked example, would be very helpful.

This is a lovely tool - works great - thank you for creating and sharing!

Export CSV file

It would be useful to create an export function to CVS (graph structure) using the shiny app.

Shiny improvements

The shinyapp version of this tool could benefit from some improvements:

  • replace "functions.R" with calls to the library version
  • add option within PRISMA_flowchart()to show, or hide, the blue side labels
  • add SVG download option
  • implement side labels to include text rotation
  • allow download of interactive HTML from shiny app

The "Identification" side label is cut off when exporting the flowchart.

Describe the bug
I wanted to document the process of a systematic review with your Shiny application, which I find particularly useful for automating processes. When I finish it and click on export, in all possible formats the side label "identification" appears as cut off - it appears "entification", "ntification"... And the words go out of the blue bubble.

Expected behavior
I would expect to get a flowchart graphic in which the word "Identification" is not cut off.

Screenshots
I attach one of the flowchart examples with the problem I describe.
prisma

Desktop (please complete the following information):

  • OS: Windows 11 Home
  • Browser: Chrome
  • Version: Versión 112.0.5615.140 (Build oficial) (64 bits)

Thanks in advance and congratulations for such great work!! @hammady @chriscpritchard @chapb @mcguinlu

Option to add additional boxes for studies excluded/included (in narrative synthesis) after quality appraisal and studies excluded/included in quantiative synthesis

Is your feature request related to a problem? Please describe.
Not able to easily add boxes in Inclusion section for studies excluded/included (in narrative synthesis) after quality appraisal and studies excluded/included in quantiative synthesis (as in ROSES; see image).
``
Describe the solution you'd like
Add this feature and options to turn qual appraisal/narrative/quant synth boxes on/off.

Describe alternatives you've considered
Had a look at implementing a few changes/additions I wanted myself but DiagrammeR doesn't allow you to easily edit an object once it's created from my experience (unlike ggplot's + feature for example). I also briefly tried editing your source code but got some weird errors with hidden functions that appear to be in the PRISMA2020 package but not immediately accessible to users (e.g. 'PRISMA_get_height_'):

Error in PRISMA_get_height_(stringr::str_count(other_identified_label,  : 
  could not find function "PRISMA_get_height_"
 > PRISMA2020::PRISMA_get_height_()
Error: 'PRISMA_get_height_' is not an exported object from 'namespace:PRISMA2020' 

Additional context
See discussion with @nealhaddaway on his ROSES package here: nealhaddaway/ROSES_flowchart#2)

image

Option to make box titles bold

Is your feature request related to a problem? Please describe.
Bit difficult to read box content especially when have a lot of records (this is a problem with PRISMA diagrams generally, not just your version of them!)

Describe the solution you'd like
If could make box titles like 'Records identified from' bold, and maybe subtitles like 'Databases' italic or better spaced, might make things more readable.

Describe alternatives you've considered
NA

Additional context
NA

Resolution and sizing customisation

Much like ggsave or jpeg/tiff etc in R, it would be great if we could edit the resolution, width/height of the output plot in R.

This would make it easier for authors to adhere to journal requirements for figures (e.g. dpi, filesize, dimensions).

NO ME DEJA ACCEDER A LA APP PARA CREAR DAGRAMA DE FLUJO PRISMA 2020

Describe the bug
A clear and concise description of what the bug is.

To Reproduce
Steps to reproduce the behavior:

  1. Go to '...'
  2. Click on '....'
  3. Scroll down to '....'
  4. See error

Expected behavior
A clear and concise description of what you expected to happen.

Screenshots
If applicable, add screenshots to help explain your problem.

Desktop (please complete the following information):

  • OS: [e.g. iOS]
  • Browser [e.g. chrome, safari]
  • Version [e.g. 22]

Smartphone (please complete the following information):

  • Device: [e.g. iPhone6]
  • OS: [e.g. iOS8.1]
  • Browser [e.g. stock browser, safari]
  • Version [e.g. 22]

Additional context
Add any other context about the problem here.

PRISMA 2020 FLOW DIAGRAM

Hi,

Whenever I try to upload my edited csv template, the upload completes but then the page says "Disconnected from the server. Reload"?

Shiny App cannot be deployed. (PAGE NOT FOUND)

There is a bug where the Shiny App is not deployed when following the steps described in the README.md

Step 1: Clone the Git Repo into a folder
Step 2: Build the image with docker build . -t prisma-shiny:1 in the PRISMA2020 directory
Step 3: Deploy the app with docker run -it --rm -p 3838:3838 prisma-shiny:1
Step 4: Go to localhost:3838

Outcome:
image

Add annotations

Is your feature request related to a problem? Please describe.
Cannot find a way to add an annotation to PRISMA2020 diagram produced.

Describe the solution you'd like
Option to add annotation to specify extra detail e.g. on Web of Science databases searched. Something like the * and † annotations in the image below

Describe alternatives you've considered
Have tried looking at the DiagrammeR docs and stack discussions but there doesn't appear to be an easy way to add an annotation to the empty space in the diagramme, at least once it's produced. Might need to be done within-function as I appreciate DiagrammeR is a tricky package with unusual syntax to work with.

Additional context
F1 large

P.S. Amazing package Chris and Neal!

More github actions

I think it would be really great if we could have github actions take some of the hard work out of version bumps / releases.

Functionality I'd like to see:

  • on release tag automatically update zenodo release
  • on release tag automatically deploy to shinyapps.io
  • on release tag automatically submit to CRAN (I think this might be a bit tricky since they require email submissions, that said I do have my own mailserver so I could probably get that automated and CC all of us)

Error - Online tool

When I upload a customised csv file and try to create a diagram I get the following message: "An error has occurred. Check your logs or contact the app author for clarification". Any suggestions of what to do or why this is happening? Thanks a lot!

Can't get specific databases to appear

Not sure if doing something wrong, but in R I am unable to find a way to get specific database return counts to appear.

Steps to reproduce the behavior:

  1. In R, I use code from https://rdrr.io/github/nealhaddaway/PRISMA2020/man/PRISMA_flowdiagram.html:
    PRISMA_flowdiagram( data, interactive = FALSE, previous = TRUE, other = TRUE, detail_databases = FALSE, detail_registers = FALSE, fontsize = 7, font = "Helvetica", title_colour = "Goldenrod1", greybox_colour = "Gainsboro", main_colour = "Black", arrow_colour = "Black", arrow_head = "normal", arrow_tail = "none", side_boxes = TRUE )

  2. This produces this error in R:
    Error in PRISMA_flowdiagram(data, interactive = FALSE, previous = TRUE, : unused arguments (detail_databases = FALSE, detail_registers = FALSE)

The code runs if I remove detail_databases = FALSE, detail_registers = FALSE,
But I cannot get the specific databases to appear not matter what I try (e.g. editing the .csv, adjust R code).

Fixed the CRAN PRISMA2020 has not yet been updated with the GITHUB version.

Unsure how to use PRISMA R package

Hi there,
I'm new to R and unsure where to start in terms of creating PRISMA diagrams with this package. I looked through the files available on Github but didn't find a step-by-step guide. Without more guidance, I may not stand any chance of using this successfully. In case it helps you help me, I was hoping R could generate output like the shinyapp interactive HTML while also letting me customize its labels and add or manipulate bubbles. Some things I want to do include:

  • Name the specific databases contributing to my search yield
  • Indicate the reasons a prior review's studies were excluded and explicitly show the N excluded
  • Present Key Question-specific yields below the overall N of included studies

I'll try tagging everyone I can in case it helps draw your attention here. Please be patient - I'm also new to posting on Github!
@chriscpritchard @mcguinlu @nealhaddaway

Thanks in advance,
Manny

Standardise function names

Given that a naming convention has begun naturally, I think we should retrospecitvely apply it to the other two functions:

E.g.

  • PRISMA_flowdiagram() (no change)

  • PRISMA_save() (no change)

  • read_PRISMAdata() -> PRISMA_data()

  • sr_flow_interactive() -> PRISMA_interactive()

Issue with PRISMA_data()

Hello,

I'm trying to build the flowdiagram from a csv file but the numbers do not match those of my csv file(flow_chart_data.csv):

flow

It seems that the problem occurs with the PRISMA_data() function as the list that it prints doesn't match my template. Also, when i upload my csv file in the Shiny.app, it works fine...
I'm doing:

flow_data <- read.csv("flow_chart_data.csv")
flow_data <- PRISMA_data(flow_data)
PRISMA_flowdiagram(flow_data1,
fontsize = 12,
interactive = TRUE,
previous = FALSE,
other = TRUE)

Thank you for your work !

Fix CRAN review comments

We've received the following response from manual inspection on CRAN:

Please add \value to .Rd files regarding exported methods and explain
the functions results in the documentation. Please write about the
structure of the output (class) and also what the output means. (If a
function does not return a value, please document that too, e.g.
\value{No return value, called for side effects} or similar)
Missing Rd-tags:
PRISMA_add_hyperlink_.Rd: \value

Functions which are supposed to only run interactively (e.g. shiny)
should be wrapped in if(interactive()).
Please replace /dontrun{} with if(interactive()){} if possible,
then users can see that the functions are not intended for use in
scripts / functions that are supposed to run non interactively.

Error in PRISMA_flowdiagram() if reason for exclusion is 1

An error comes when the a single reason of exclusion is supplied
I'm trying to create a PRISMA flow diagram. The code works fine when the reasons for excluding a study is more than one but fails when I give a single reason. I first experienced it while using the R package but it also happens with the shinyapp.

To Reproduce
Steps to reproduce the behavior (using the example in the PRISMA2020 package documentation):
library(PRISMA2020)
csvFile <- system.file("extdata", "PRISMA.csv", package = "PRISMA2020")
data <- read.csv(csvFile)
data[23, "n"] #three reasons are supplied in the template
data[23, "n"] <- "Reason1, xxx" #Replace with a single reason
data <- PRISMA_data(data)
PRISMA_flowdiagram(data, fontsize = 12, interactive = TRUE, previous = FALSE, other = TRUE)

Expected behavior
A PRISMA flow diagram

Screenshots
error: Error in if (lines > min) { : the condition has length > 1
image

session info
image
I'm using PRISMA2020 version 1.1.1 date 2023-02-09 CRAN (R 4.3.1)

I tried using the shinyapp
Here's how to reproduce the error on the shinyapp

  1. Go to the create flow diagram and click on reports excluded
    image
  2. Delete the 2 last reasons and leave only one
    image
  3. An error comes: An error has occurred. Check your logs or contact the app author for clarification.
    image

More context
Maintaining the ";" at the end of the reason supplied doesn't solve the issue.

Help will be appreciated. Thanks.

Remove need to attach() data

Hi @nealhaddaway,

Prompted by a user I recommended the package to missing the attach() step and getting a non-informative error, it might be worth reassessing the need for users to attach() the data before they can run PRISMA_flowchart(). It would be better to explicitly refer to objects within the PRISMA_flowchart() function using $ rather than the current set-up (e.g. so tooltips becomes data$tooltips). [I imagine this is a hang-over from the old way the function inputs were defined, and is on the to-do list, but wanted to formally flag it 😀]

Some more relevant info on why attach() can be dangerous here, in case it's useful: https://www.r-bloggers.com/2011/05/to-attach-or-not-attach-that-is-the-question/

PRISMA_data -> PRISMA_flowdiagram issue

Hi, thanks for this package! I've used the ShinyApp before but am excited to be able to integrate this. :)

I am having a challenging time troubleshooting an issue where PRISMA_data where the boxtext and values are all completed as if they are the first row in the template. Perplexingly, the shiny app works when I upload my completed csv. This leads me to think it's something in my rstudio. Any ideas?

I am not quite sure where to start here - if there is something obvious I have missed please let me know.

`library(readr)
library(PRISMA2020)

PRISMA <- read_csv("PRISMA.csv")

flow_chart_data <- PRISMA2020::PRISMA_data(PRISMA)

flow_chart <- PRISMA2020::PRISMA_flowdiagram(flow_chart_data)
flow_chart
`

Screen Shot 2022-02-24 at 11 07 16 PM

Numeric strings in labels in PRISMA.csv

Is there any purpose to the numeric strings added to the inst/extdata/PRISMA.csv file?

  • "Identification4231412341"
  • "Identification of new studies via other methods5235325235"

I've removed them in 6e5708c, but have another PR open already; this could be easily added if they are in fact not needed.

Total studies included in review not appearing

Describe the bug
When I do not include previous studies, the total studies included in review and reports of total included studies disappear. Our review does not include any previous studies. But we do need the grey box of total studies.

To Reproduce
Steps to reproduce the behavior:

  1. Go to 'Previous studies'
  2. Click on 'No Included'
  3. See error: The grey box of 'Total studies included in review and reports of total included studies' disappear

Expected behavior
still have the grey box of 'Total studies included in review and reports of total included studies' no matter there are previous studies.

Screenshots
issue_pic

Desktop (please complete the following information):

  • OS: Windows
  • Browser chrome
  • Version not known

Additional context
Add any other context about the problem here.

Question: How to rotate labels?

Hi,
Thanks for your awesome efforts in creating this elaborate diagram / PRISMA flowchart! I've been using your code as inspiration for a graph/flowchart I'm trying to create myself.

I've looked at your code numerous times but cannot figure out how you managed to have the "Identification", "Screening", and "Included" labels to become rotated. I really like this way of identifying the phases of the review, but find it difficult to replicate. Could you perhaps elaborate on how you managed to do this? Or point me towards where you coded this?

Thanks!
Sally

Add support for additional arguments

Is your feature request related to a problem? Please describe.
Would be useful to be able to specify whether or not other sources and previous review arms should be visible by specifying a URL argument

Describe the solution you'd like
A url argument to specify whether to show or hide various features

Describe alternatives you've considered
change the defaults such that the basic diagram is the default

Add specific database and extra boxes

Hello,

Thanks for creating this wonderful package! I have two questions:

  1. I would like to know if it is possible (or rather how it can become possible), instead of reporting the number of records retrieved by databases (in box 2 "Records identified from:", one can write e.g. "Databases (n = 400"), to report numbers from specific databases, e.g.

Databases:
PsycInfo (n = 10)
PubMed (n = 20)
Scopus (n = 40)

  1. Is it possible to add more boxes? I would like to report the screening process step-by-step, i.e.

Instead of

Records screened ( n =. 100) ----------------Records excluded (n = 30)

To say:

Titles screened (n = 1000) ------ Reports excluded:
Reason 1 (n = 300)
Reason 2 (n = 100)
Reason 3 (n = 50)

Abstracts screened (n = 200) ----------Reports excluded:
Reason 1 (n = 300)
Reason 2 (n = 100)
Reason 3 (n = 50)
[and then as it is, e.g.:
Records sought for retrieval (n = 200) ---------- Records not retrieved ( n = 40)]

I thank you in advance,

Marietta Papadatou-Pastou
(see one of our recent paper heres: https://psycnet.apa.org/record/2020-23033-001)

Recommend Projects

  • React photo React

    A declarative, efficient, and flexible JavaScript library for building user interfaces.

  • Vue.js photo Vue.js

    🖖 Vue.js is a progressive, incrementally-adoptable JavaScript framework for building UI on the web.

  • Typescript photo Typescript

    TypeScript is a superset of JavaScript that compiles to clean JavaScript output.

  • TensorFlow photo TensorFlow

    An Open Source Machine Learning Framework for Everyone

  • Django photo Django

    The Web framework for perfectionists with deadlines.

  • D3 photo D3

    Bring data to life with SVG, Canvas and HTML. 📊📈🎉

Recommend Topics

  • javascript

    JavaScript (JS) is a lightweight interpreted programming language with first-class functions.

  • web

    Some thing interesting about web. New door for the world.

  • server

    A server is a program made to process requests and deliver data to clients.

  • Machine learning

    Machine learning is a way of modeling and interpreting data that allows a piece of software to respond intelligently.

  • Game

    Some thing interesting about game, make everyone happy.

Recommend Org

  • Facebook photo Facebook

    We are working to build community through open source technology. NB: members must have two-factor auth.

  • Microsoft photo Microsoft

    Open source projects and samples from Microsoft.

  • Google photo Google

    Google ❤️ Open Source for everyone.

  • D3 photo D3

    Data-Driven Documents codes.