Giter VIP home page Giter VIP logo

prometheus-pve-exporter's Introduction

Prometheus Proxmox VE Exporter

Build Status Package Version

This is an exporter that exposes information gathered from Proxmox VE node for use by the Prometheus monitoring system.

Installation

Requires Python 3.9 or better.

Using pip:

python3 -m pip install prometheus-pve-exporter
pve_exporter --help

Using docker:

docker pull prompve/prometheus-pve-exporter

Example: Display usage message:

docker run -it --rm prompve/prometheus-pve-exporter --help

Example: Run the image with a mounted configuration file and published port:

docker run --init --name prometheus-pve-exporter -d -p 127.0.0.1:9221:9221 -v /path/to/pve.yml:/etc/prometheus/pve.yml prompve/prometheus-pve-exporter

Prometheus PVE Exporter will now be reachable at http://localhost:9221/.

Usage

usage: pve_exporter [-h] [--collector.status | --no-collector.status]
                    [--collector.version | --no-collector.version]
                    [--collector.node | --no-collector.node]
                    [--collector.cluster | --no-collector.cluster]
                    [--collector.resources | --no-collector.resources]
                    [--collector.config | --no-collector.config]
                    [--collector.replication | --no-collector.replication]
                    [--config.file CONFIG_FILE]
                    [--web.listen-address WEB_LISTEN_ADDRESS]
                    [--server.keyfile SERVER_KEYFILE]
                    [--server.certfile SERVER_CERTFILE]

options:
  -h, --help            show this help message and exit
  --config.file CONFIG_FILE
                        Path to config file (/etc/prometheus/pve.yml)
  --web.listen-address WEB_LISTEN_ADDRESS
                        Address on which to expose metrics and web server.
                        ([::]:9221)
  --server.keyfile SERVER_KEYFILE
                        SSL key for server
  --server.certfile SERVER_CERTFILE
                        SSL certificate for server

cluster collectors:
  cluster collectors are run if the url parameter cluster=1 is set and
  skipped if the url parameter cluster=0 is set on a scrape url.

  --collector.status, --no-collector.status
                        Exposes Node/VM/CT-Status
  --collector.version, --no-collector.version
                        Exposes PVE version info
  --collector.node, --no-collector.node
                        Exposes PVE node info
  --collector.cluster, --no-collector.cluster
                        Exposes PVE cluster info
  --collector.resources, --no-collector.resources
                        Exposes PVE resources info

node collectors:
  node collectors are run if the url parameter node=1 is set and skipped if
  the url parameter node=0 is set on a scrape url.

  --collector.config, --no-collector.config
                        Exposes PVE onboot status
  --collector.replication, --no-collector.replication
                        Exposes PVE replication info

Use [::] in the --web.listen-address flag in order to bind to both IPv6 and IPv4 sockets on dual stacked machines.

Visit http://localhost:9221/pve?target=1.2.3.4&cluster=1&node=1 where 1.2.3.4 is the IP of the Proxmox VE node to get metrics from. Specify the module request parameter, to choose which module to use from the config file.

The target request parameter defaults to localhost. Hence if pve_exporter is deployed directly on the proxmox host, target can be omitted.

Use the --collector.X / --no-collector.X flags to enable disable selected collectors.

Note that that the config collector results in one API call per guest VM/CT. It is therefore recommended to disable this collector using the --no-collector.config flag on big deployments.

See the wiki for more examples and docs.

Exported Metrics

Here's an example of the metrics exported.

# HELP pve_up Node/VM/CT-Status is online/running
# TYPE pve_up gauge
pve_up{id="node/proxmox"} 1.0
pve_up{id="qemu/100"} 1.0
# HELP pve_disk_size_bytes Size of storage device
# TYPE pve_disk_size_bytes gauge
pve_disk_size_bytes{id="qemu/100"} 6.8719476736e+010
pve_disk_size_bytes{id="node/proxmox"} 3.1044079616e+010
pve_disk_size_bytes{id="storage/proxmox/local"} 3.1044079616e+010
pve_disk_size_bytes{id="storage/proxmox/local-lvm"} 6.9243764736e+010
pve_disk_size_bytes{id="storage/proxmox/vms"} 1.934882766848e+012
# HELP pve_disk_usage_bytes Disk usage in bytes
# TYPE pve_disk_usage_bytes gauge
pve_disk_usage_bytes{id="qemu/100"} 0.0
pve_disk_usage_bytes{id="node/proxmox"} 1.7571426304e+010
pve_disk_usage_bytes{id="storage/proxmox/local"} 1.7571426304e+010
pve_disk_usage_bytes{id="storage/proxmox/local-lvm"} 6.619703908e+09
pve_disk_usage_bytes{id="storage/proxmox/vms"} 8.32870981632e+011
# HELP pve_memory_size_bytes Size of memory
# TYPE pve_memory_size_bytes gauge
pve_memory_size_bytes{id="qemu/100"} 1.7179869184e+010
pve_memory_size_bytes{id="node/proxmox"} 6.739961856e+010
# HELP pve_memory_usage_bytes Memory usage in bytes
# TYPE pve_memory_usage_bytes gauge
pve_memory_usage_bytes{id="qemu/100"} 1.6573280275e+010
pve_memory_usage_bytes{id="node/proxmox"} 5.3907812352e+010
# HELP pve_network_transmit_bytes Number of bytes transmitted over the network
# TYPE pve_network_transmit_bytes gauge
pve_network_transmit_bytes{id="qemu/100"} 7.75070828e+09
# HELP pve_network_receive_bytes Number of bytes received over the network
# TYPE pve_network_receive_bytes gauge
pve_network_receive_bytes{id="qemu/100"} 1.529756162e+09
# HELP pve_disk_write_bytes Number of bytes written to storage
# TYPE pve_disk_write_bytes gauge
pve_disk_write_bytes{id="qemu/100"} 1.50048127488e+011
# HELP pve_disk_read_bytes Number of bytes read from storage
# TYPE pve_disk_read_bytes gauge
pve_disk_read_bytes{id="qemu/100"} 7.473739264e+09
# HELP pve_cpu_usage_ratio CPU usage (value between 0.0 and pve_cpu_usage_limit)
# TYPE pve_cpu_usage_ratio gauge
pve_cpu_usage_ratio{id="qemu/100"} 0.105009724408557
pve_cpu_usage_ratio{id="node/proxmox"} 0.984243806697115
# HELP pve_cpu_usage_limit Maximum allowed CPU usage
# TYPE pve_cpu_usage_limit gauge
pve_cpu_usage_limit{id="qemu/100"} 1.0
pve_cpu_usage_limit{id="node/proxmox"} 4.0
# HELP pve_uptime_seconds Number of seconds since the last boot
# TYPE pve_uptime_seconds gauge
pve_uptime_seconds{id="qemu/100"} 315039.0
pve_uptime_seconds{id="node/proxmox"} 315069.0
# HELP pve_storage_shared Whether or not the storage is shared among cluster nodes
# TYPE pve_storage_shared gauge
pve_storage_shared{id="storage/proxmox/local"} 0.0
pve_storage_shared{id="storage/proxmox/local-lvm"} 0.0
pve_storage_shared{id="storage/proxmox/vms"} 0.0
# HELP pve_guest_info VM/CT info
# TYPE pve_guest_info gauge
pve_guest_info{id="qemu/100",name="samplevm1",node="proxmox",type="qemu",tags="tag1;tag2"} 1.0
# HELP pve_storage_info Storage info
# TYPE pve_storage_info gauge
pve_storage_info{id="storage/proxmox/local",node="proxmox",storage="local"} 1.0
pve_storage_info{id="storage/proxmox/local-lvm",node="proxmox",storage="local-lvm"} 1.0
pve_storage_info{id="storage/proxmox/vms",node="proxmox",storage="vms"} 1.0
# HELP pve_node_info Node info
# TYPE pve_node_info gauge
pve_node_info{id="node/proxmox",level="",name="proxmox",nodeid="0"} 1.0
# HELP pve_onboot_status Proxmox vm config onboot value
# TYPE pve_onboot_status gauge
pve_onboot_status{id="qemu/201",node="proxmox",type="qemu"} 1.0
# HELP pve_version_info Proxmox VE version info
# TYPE pve_version_info gauge
pve_version_info{release="7.1",repoid="6fe299a0",version="7.1-5"} 1.0
# HELP pve_replication_duration_seconds Proxmox vm replication duration
# TYPE pve_replication_duration_seconds gauge
pve_replication_duration_seconds{id="1-0"} 7.73584
# HELP pve_replication_last_sync_timestamp_seconds Proxmox vm replication last_sync
# TYPE pve_replication_last_sync_timestamp_seconds gauge
pve_replication_last_sync_timestamp_seconds{id="1-0"} 1.713382503e+09
# HELP pve_replication_last_try_timestamp_seconds Proxmox vm replication last_try
# TYPE pve_replication_last_try_timestamp_seconds gauge
pve_replication_last_try_timestamp_seconds{id="1-0"} 1.713382503e+09
# HELP pve_replication_next_sync_timestamp_seconds Proxmox vm replication next_sync
# TYPE pve_replication_next_sync_timestamp_seconds gauge
pve_replication_next_sync_timestamp_seconds{id="1-0"} 1.7134689e+09
# HELP pve_replication_failed_syncs Proxmox vm replication fail_count
# TYPE pve_replication_failed_syncs gauge
pve_replication_failed_syncs{id="1-0"} 0.0
# HELP pve_replication_info Proxmox vm replication info
# TYPE pve_replication_info gauge
pve_replication_info{guest="qemu/1",id="1-0",source="node/proxmox1",target="node/proxmox2",type="local"} 1.0

Authentication

Using pve.yml config file

Example pve.yml for password authentication:

default:
    user: prometheus@pve
    password: sEcr3T!
    # Optional: set to false to skip SSL/TLS verification
    verify_ssl: true

Example pve.yml for token authentication:

default:
    user: prometheus@pve
    token_name: "your-token-id"
    token_value: "..."

Using environment variables:

If the PVE_USER environment variable exists, then configuration is taken from the environment instead of from the pve.yml config file. The following environment variables are respected:

  • PVE_USER: user name

Required for password authentication:

  • PVE_PASSWORD: user password

Required for token authentication:

  • PVE_TOKEN_NAME: token name
  • PVE_TOKEN_VALUE: token value

Optional:

  • PVE_VERIFY_SSL: Either true or false, whether or not to verify PVE tls certificate. Defaults to true.
  • PVE_MODULE: Name of the configuration module. Defaults to default.

The configuration is passed directly into proxmoxer.ProxmoxAPI().

Note on verify_ssl and certificate trust store:

When operating PVE with self-signed certificates, then it is necessary to either import the certificate into the local trust store (see this SE answer for Debian/Ubuntu) or add verify_ssl: false to the config dict as a sibling to the credentials. Note that PVE supports Let's Encrypt out ouf the box. In many cases setting up trusted certificates is the better option than operating with self-signed certs.

Proxmox VE Configuration

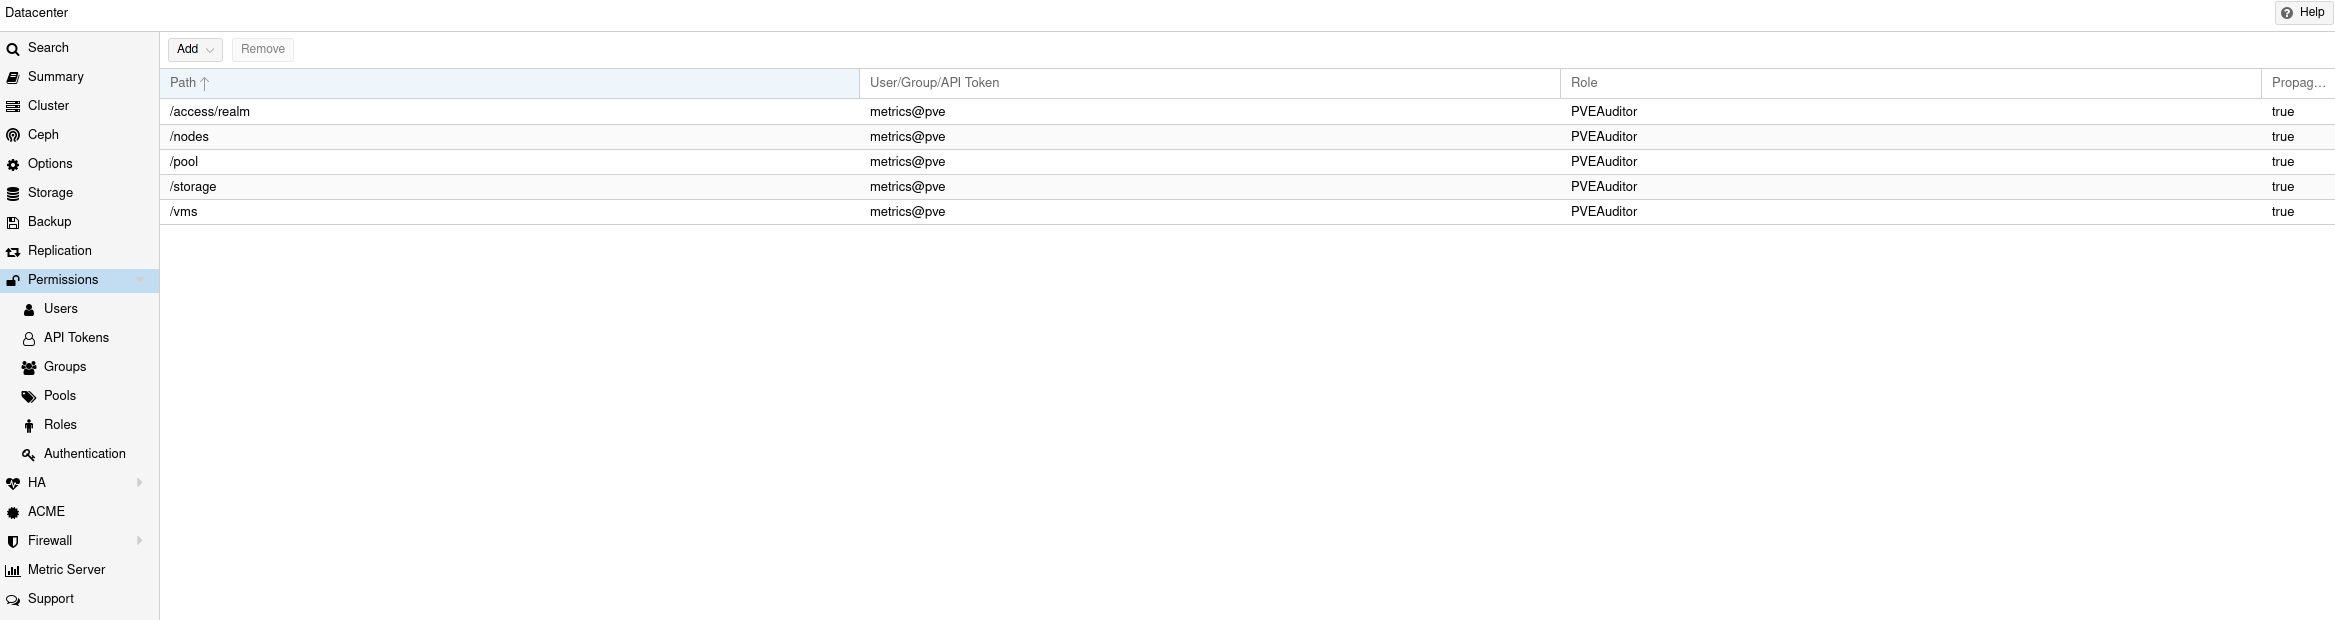
For security reasons it is essential to add a user with read-only access (PVEAuditor role) for the purpose of metrics collection.

Refer to the Proxmox Documentation for the several ways of creating a user. Once created, assign the user the / path permission.

Prometheus Configuration

The PVE exporter can be deployed either directly on a Proxmox VE node or onto a separate machine.

Example config for PVE exporter running on PVE node:

scrape_configs:
  - job_name: 'pve'
    static_configs:
      - targets:
        - 192.168.1.2:9221  # Proxmox VE node with PVE exporter.
        - 192.168.1.3:9221  # Proxmox VE node with PVE exporter.
    metrics_path: /pve
    params:
      module: [default]
      cluster: ['1']
      node: ['1']

Example config for PVE exporter running on Prometheus host:

scrape_configs:
  - job_name: 'pve'
    static_configs:
      - targets:
        - 192.168.1.2  # Proxmox VE node.
        - 192.168.1.3  # Proxmox VE node.
    metrics_path: /pve
    params:
      module: [default]
      cluster: ['1']
      node: ['1']
    relabel_configs:
      - source_labels: [__address__]
        target_label: __param_target
      - source_labels: [__param_target]
        target_label: instance
      - target_label: __address__
        replacement: 127.0.0.1:9221  # PVE exporter.

Note on alerting:

You can do VM tag based alerting, by using joins on pve_guest_info metric. For example, alerting only when VM with critical tag is down:

(pve_guest_info{tags=~".*critical.*"} * on(id) group_left(name) pve_up{}) == 0

Note on scraping large clusters:

It is adviced to setup separate jobs to collect cluster metrics and node metrics in larger deployments. Scraping any node in a cluster with the url params set to cluster=1&node=0 results in the same set of metrics. Hence cluster metrics can be scraped efficiently from a single node or from a subset of cluster nodes (e.g., a different node selected on every scrape via round-robin DNS).

Node metrics can only be scraped from a given node. In order to compile a complete set of node metrics it is necessary to scrape every node in a cluster with url params set to cluster=0&node=1.

Grafana Dashboards

prometheus-pve-exporter's People

Contributors

adam-petro avatar ajgon avatar akam-it avatar crabhi avatar dependabot[bot] avatar elsbrock avatar frenkye avatar jmangs avatar perlun avatar resmo avatar spearcrow avatar svengerber avatar tassatux avatar whysthatso avatar zhangsean avatar znerol avatar

Stargazers

 avatar  avatar  avatar  avatar  avatar  avatar  avatar  avatar  avatar  avatar  avatar  avatar  avatar  avatar  avatar  avatar  avatar  avatar  avatar  avatar  avatar  avatar  avatar  avatar  avatar  avatar  avatar  avatar  avatar  avatar  avatar  avatar  avatar  avatar  avatar  avatar  avatar  avatar  avatar  avatar  avatar  avatar  avatar  avatar  avatar  avatar  avatar  avatar  avatar  avatar  avatar  avatar  avatar  avatar  avatar  avatar  avatar  avatar  avatar  avatar  avatar  avatar  avatar  avatar  avatar  avatar  avatar  avatar  avatar  avatar  avatar  avatar  avatar  avatar  avatar  avatar  avatar  avatar  avatar  avatar  avatar  avatar  avatar  avatar  avatar  avatar  avatar  avatar  avatar  avatar  avatar  avatar  avatar  avatar  avatar  avatar  avatar  avatar  avatar  avatar

Watchers

 avatar  avatar  avatar  avatar  avatar  avatar  avatar

prometheus-pve-exporter's Issues

Docker image fails on Raspberry Pi 4

The following error occurs when attempting to run the docker image on a Raspberry Pi 4 with Alpine 3.14, causing the container to stop:

standard_init_linux.go:228: exec user process caused: exec format error

I believe this is due to the Alpine version in the Dockerfile being specified as 3.13.6, which might not support ARM 64 CPU architecture. Alpine's Official Dockerhub Image specifies the following tags as being supported:

    20210804, edge
    3.15.0-rc.4, 3.15
    3.14.3, 3.14, 3, latest
    3.13.7, 3.13
    3.12.9, 3.12
    3.11.13, 3.11

Updating the Dockerfile from ARG alpine_version=3.13.6 => ARG alpine_version=3.14.3 resolves the issue on my device.

Can't connect to Proxmox VE Node

Hello everyone!
I have prometheus VM with installed pve_exporter on it.

Content of pve.yml:
default:
user: groot
password: Rock123!
verify_ssl: false

Proxmox VE is set on other ip and can be opened by https://proxmox_ip:8006 with authentication above.

But when i type http://pve_exporter_ip:9221/pve?target=proxmox_ip
it gets me an error:

Internal Server Error
The server encountered an internal error and was unable to complete your request. Either the server is overloaded or there is an error in the application.

Apr 16 09:50:21 prometheus pve_exporter[16507]: raise AuthenticationError("Couldn't authenticate user: {0} to {1}".format(self.username, self.base_url + "/access/ticket"))
Apr 16 09:50:21 prometheus pve_exporter[16507]: proxmoxer.backends.https.AuthenticationError: Couldn't authenticate user: groot to https://proxmox_ip:8006/api2/json/access/ticket
Apr 16 09:50:21 prometheus pve_exporter[16507]: client_ip - - [16/Apr/2021 09:50:21] "GET /pve?target=proxmox_ip HTTP/1.1" 500 -

Any help wil be appreciated. Many thanks.

HTTP 500: target not set correct

Hi,

just deployed pve_exporter via docker on the proxmox host directly. Exporter works when i try scraping metrics manually via curl:

$ curl http://192.168.1.181:9221/pve?target=192.168.1.181
# HELP pve_up Node/VM/CT-Status is online/running
# TYPE pve_up gauge
...

However, i configured prometheus like explained but it only gets HTTP 500:

  - job_name: "test-pve_exporter"
    static_configs:
      - targets: 
        - '192.168.1.181:9221' 
    metrics_path: /pve
    params:
      module: [default]

Looks to me like when i curl manually and don't set any target:

$ curl http://192.168.1.181:9221/pve
<!DOCTYPE HTML PUBLIC "-//W3C//DTD HTML 3.2 Final//EN">
<title>500 Internal Server Error</title>
<h1>Internal Server Error</h1>
<p>The server encountered an internal error and was unable to complete your request. Either the server is overloaded or there is an error in the application.</p>

Shouldn't the target been set automatically by prometheus?

Thanks
Regards,
Kilian

timeout issues

Hi,

I am getting timeout errors while trying to get informations. I think I know where this error come from, but first, I would like to handle this problem properly.

Bellow the output of journalctl on this service:

Mar 30 11:59:18 node03 pve_exporter[8669]: Exception thrown while scraping quemu/lxc config from IronThrone01
Mar 30 11:59:18 node03 pve_exporter[8669]: Traceback (most recent call last):
Mar 30 11:59:18 node03 pve_exporter[8669]:   File "/opt/prometheus-pve-exporter/lib/python3.7/site-packages/pve_exporter/collector.py", line 289, in collect
Mar 30 11:59:18 node03 pve_exporter[8669]:     for vmdata in self._pve.nodes(node['node']).qemu.get():
Mar 30 11:59:18 node03 pve_exporter[8669]:   File "/opt/prometheus-pve-exporter/lib/python3.7/site-packages/proxmoxer/core.py", line 105, in get
Mar 30 11:59:18 node03 pve_exporter[8669]:     return self(args)._request("GET", params=params)
Mar 30 11:59:18 node03 pve_exporter[8669]:   File "/opt/prometheus-pve-exporter/lib/python3.7/site-packages/proxmoxer/core.py", line 94, in _request
Mar 30 11:59:18 node03 pve_exporter[8669]:     resp.reason, resp.content))
Mar 30 11:59:18 node03 pve_exporter[8669]: proxmoxer.core.ResourceException: 595 Errors during connection establishment, proxy handshake: Connection timed out - b''

However, I am able to retrieve manually those values:

time wget -O px03.html http://localhost:9221/pve?target=1.2.3.4

It took almost 1 minute, and px03.html seems to be a valid plain ASCII text file with keys/values.

My first idea was to increase this timeout values. Any idea if this is directly possible from the daemon ?

When I grep directly into the code for timeout values I found many references, but I do not see any global option ?

Best regards,

500 & 403 errors in logs

I'm hitting 500 & 403 errors when attempting to run prometheus-pve-exporter in Docker. I am having difficulty determining what is causing these errors. I confirmed the user and token details - so I'm pretty confident that it's a not copy/paste issue.

Environment details

Proxmox

  • 6.4-4

VM running

  • Ubuntu 20.04.2
  • Docker 20.10.2
  • Docker-compose 1.25.0

Proxmox token settings

Screen Shot 2021-07-12 at 2 11 48 PM

docker-compose.yml

version: "3.3"
proxmox:
    image: prompve/prometheus-pve-exporter
    container_name: prometheus-pve-exporter
    ports:
      - 9221:9221
    volumes:
      - ./proxmox/pve.yml:/etc/pve.yml

pve.yml

default:
    user: monitor@pve
    token_name: exporter
    token_value: XXXXXXXX-XXXX-XXXX-XXXX-XXXXXXXXXXXX
    verify_ssl: false

Logs

* Running on http://localhost:9221/ (Press CTRL+C to quit),
Exception thrown while rendering view,
Traceback (most recent call last):,
  File "/usr/lib/python3.8/site-packages/pve_exporter/http.py", line 96, in view,
    return view_registry[endpoint](**params),
  File "/usr/lib/python3.8/site-packages/pve_exporter/http.py", line 38, in on_pve,
    output = collect_pve(self._config[module], target, self._collectors),
  File "/usr/lib/python3.8/site-packages/pve_exporter/collector.py", line 332, in collect_pve,
    return generate_latest(registry),
  File "/usr/lib/python3.8/site-packages/prometheus_client/exposition.py", line 107, in generate_latest,
    for metric in registry.collect():,
  File "/usr/lib/python3.8/site-packages/prometheus_client/registry.py", line 83, in collect,
    for metric in collector.collect():,
  File "/usr/lib/python3.8/site-packages/pve_exporter/collector.py", line 45, in collect,
    for entry in self._pve.cluster.status.get():,
  File "/usr/lib/python3.8/site-packages/proxmoxer/core.py", line 105, in get,
    return self(args)._request("GET", params=params),
  File "/usr/lib/python3.8/site-packages/proxmoxer/core.py", line 90, in _request,
    raise ResourceException("{0} {1}: {2} - {3}".format(,
proxmoxer.core.ResourceException: 403 Forbidden: Permission check failed (/, Sys.Audit) - b'{"data":null}',
10.0.0.200 - - [12/Jul/2021 20:50:03] "GET /pve?module=default&target=proxmox.lan HTTP/1.1" 500 -

CA Certificates

Hey friends,

is it possible to install ca-certificates in DOCKERFILE? I'm using a valid letsencrypt certificate for proxmox but cannot use SSL verify on true.

I'm using a docker-compose file, so I want to skip the step creating an own image just for installing ca-certificates. I think this should get into core, you're already "proxying" requests, so this should also work with ssl validation.

Performance issue

Hello,
since v 1.2+ version I see the performance drop with loading metrics page.
I have the proxmox cluster with multiple nodes and ~500 VMs.
The metrics page has near 7000 lines.

The 1.1.2 version of pve exporter - the metrics page loads for ~400ms
The 1.2 or v2.0.3 version - the metrics page loads for ~7s

image
image

Can't run pve_exporter

I've install pve_exporter but can't run it
This is what I did:

  • python3 -m venv /opt/prometheus-pve-exporter
  • /opt/prometheus-pve-exporter/bin/pip install prometheus-pve-exporter

Then I tryed to start it: /opt/prometheus-pve-exporter/bin/pve_exporter /etc/prometheus/pve.yml but got an errorr:

Traceback (most recent call last):
  File "/opt/prometheus-pve-exporter/bin/pve_exporter", line 7, in <module>
    from pve_exporter.cli import main
  File "/opt/prometheus-pve-exporter/lib/python3.5/site-packages/pve_exporter/cli.py", line 40
    help += f" (default: {default})"
                                   ^
SyntaxError: invalid syntax

image

Looking for a Co-maintainer

Prometheus PVE Exporter has developed into a project used by people and organizations around the globe. It is a honor for me to contribute a small piece of software which makes the lives easier for fellow sysadmins and devops engineers.

At this point I can easily keep up with resolving issues and reviewing / merging PRs. In the long run it will for sure be beneficial for the project if more than one person is capable of maintaining the code base and rolling releases.

Thus, I am looking for some reliable creature who is willing to assume responsibility for the maintenance of this project and for keeping its users happy. If you are actively using Prometheus PVE Exporter, if you did contribute to this project in the past and if you like to step up as a maintainer, then please ping me (use the e-mail address on my github profile page).

Exporter does not start

Good day,

i try to use your exporter, but it does not start:

root@mt-grafana-prox:~# /opt/prometheus-pve-exporter/bin/pve_exporter /etc/prometheus/pve.yml
Traceback (most recent call last):
  File "/opt/prometheus-pve-exporter/bin/pve_exporter", line 8, in <module>
    sys.exit(main())
  File "/opt/prometheus-pve-exporter/lib/python3.9/site-packages/pve_exporter/cli.py", line 108, in main
    config = config_from_yaml(yaml.safe_load(handle))
  File "/opt/prometheus-pve-exporter/lib/python3.9/site-packages/yaml/__init__.py", line 162, in safe_load
    return load(stream, SafeLoader)
  File "/opt/prometheus-pve-exporter/lib/python3.9/site-packages/yaml/__init__.py", line 114, in load
    return loader.get_single_data()
  File "/opt/prometheus-pve-exporter/lib/python3.9/site-packages/yaml/constructor.py", line 49, in get_single_data
    node = self.get_single_node()
  File "/opt/prometheus-pve-exporter/lib/python3.9/site-packages/yaml/composer.py", line 36, in get_single_node
    document = self.compose_document()
  File "/opt/prometheus-pve-exporter/lib/python3.9/site-packages/yaml/composer.py", line 55, in compose_document
    node = self.compose_node(None, None)
  File "/opt/prometheus-pve-exporter/lib/python3.9/site-packages/yaml/composer.py", line 84, in compose_node
    node = self.compose_mapping_node(anchor)
  File "/opt/prometheus-pve-exporter/lib/python3.9/site-packages/yaml/composer.py", line 133, in compose_mapping_node
    item_value = self.compose_node(node, item_key)
  File "/opt/prometheus-pve-exporter/lib/python3.9/site-packages/yaml/composer.py", line 64, in compose_node
    if self.check_event(AliasEvent):
  File "/opt/prometheus-pve-exporter/lib/python3.9/site-packages/yaml/parser.py", line 98, in check_event
    self.current_event = self.state()
  File "/opt/prometheus-pve-exporter/lib/python3.9/site-packages/yaml/parser.py", line 449, in parse_block_mapping_value
    if not self.check_token(KeyToken, ValueToken, BlockEndToken):
  File "/opt/prometheus-pve-exporter/lib/python3.9/site-packages/yaml/scanner.py", line 116, in check_token
    self.fetch_more_tokens()
  File "/opt/prometheus-pve-exporter/lib/python3.9/site-packages/yaml/scanner.py", line 227, in fetch_more_tokens
    return self.fetch_alias()
  File "/opt/prometheus-pve-exporter/lib/python3.9/site-packages/yaml/scanner.py", line 610, in fetch_alias
    self.tokens.append(self.scan_anchor(AliasToken))
  File "/opt/prometheus-pve-exporter/lib/python3.9/site-packages/yaml/scanner.py", line 929, in scan_anchor
    raise ScannerError("while scanning an %s" % name, start_mark,
yaml.scanner.ScannerError: while scanning an alias
  in "/etc/prometheus/pve.yml", line 3, column 15
expected alphabetic or numeric character, but found '*'
  in "/etc/prometheus/pve.yml", line 3, column 23

permissions issue

Receiving the following when trying to access my metrics

proxmoxer.core.ResourceException: 403 Forbidden: Permission check failed (/, Sys.Audit) - b'{"data":null}'                                                                                                  
10.150.33.152 - - [14/Apr/2021 07:41:23] "GET /pve?module=default HTTP/1.1" 500 -
Exception thrown while rendering view
Traceback (most recent call last):
  File "/usr/local/lib/python3.7/dist-packages/pve_exporter/http.py", line 96, in view
    return view_registry[endpoint](**params)
  File "/usr/local/lib/python3.7/dist-packages/pve_exporter/http.py", line 38, in on_pve
    output = collect_pve(self._config[module], target, self._collectors)
  File "/usr/local/lib/python3.7/dist-packages/pve_exporter/collector.py", line 332, in collect_pve
    return generate_latest(registry)
  File "/usr/local/lib/python3.7/dist-packages/prometheus_client/exposition.py", line 177, in generate_latest
    for metric in registry.collect():
  File "/usr/local/lib/python3.7/dist-packages/prometheus_client/registry.py", line 83, in collect
    for metric in collector.collect():
  File "/usr/local/lib/python3.7/dist-packages/pve_exporter/collector.py", line 45, in collect
    for entry in self._pve.cluster.status.get():
  File "/usr/local/lib/python3.7/dist-packages/proxmoxer/core.py", line 105, in get
    return self(args)._request("GET", params=params)
  File "/usr/local/lib/python3.7/dist-packages/proxmoxer/core.py", line 94, in _request
    resp.reason, resp.content))

my config file is as such:

user: "prometheus@pve"
   token_name: prometheus
   token_value: "token_value"
   verify_ssl: false

The user has PVEAuditor permissions, and the group of which it is a member has access to the whole tree.

Exporter displaying traceback on target weblink

Hello, when i start the exporter and go to http://10.0.1.14:9221/pve?target=10.0.1.14 (ip is of my proxmox host and the exporter as well, i get the following traceback:

  File "/usr/local/lib/python2.7/dist-packages/pve_exporter/http.py", line 44, in do_GET
    output = collect_pve(self._config[module], target)
  File "/usr/local/lib/python2.7/dist-packages/pve_exporter/collector.py", line 207, in collect_pve
    return generate_latest(registry)
  File "/usr/local/lib/python2.7/dist-packages/prometheus_client/exposition.py", line 63, in generate_latest
    for metric in registry.collect():
  File "/usr/local/lib/python2.7/dist-packages/prometheus_client/core.py", line 97, in collect
    for metric in collector.collect():
  File "/usr/local/lib/python2.7/dist-packages/pve_exporter/collector.py", line 84, in collect
    del node['online']
KeyError: 'online'```

Only the first Disk

Hi,
it seems, that the pve_exporter is only getting one of (i.e.) four disks:

pve_disk_write_bytes{id="qemu/999"} 743841035264.0
pve_disk_usage_bytes{id="qemu/999"} 0.0
pve_disk_size_bytes{id="qemu/999"} 34359738368.0
pve_disk_read_bytes{id="qemu/999"} 279691497472.0

My VM (999) has
scsi0: cephcluster:vm-999-disk-1,discard=on,size=32G
scsi1: cephcluster:vm-999-disk-2,backup=0,size=2T
scsi2: cephcluster:vm-999-disk-5,backup=0,discard=on,size=20T
scsi3: cephcluster:vm-999-disk-3,size=5T

am i doing something wrong?

Invalid config: Invalid module config entries in config file

I have the following configuration directly in proxmox:

default:
#    user: root@pam!root
    user: root@pam
    token_name: "...."
    token_value: "......"

scrape_configs:
  - job_name: 'pve'
    static_configs:
      - targets:
        - 10.0.0.200:9221
        - 10.0.0.240:9221
        - 10.0.0.250:9221
    metrics_path: /pve

But I get the following error and the yml is correctly undetermined, what can it be? :

usage: pve_exporter [-h] [--collector.status] [--collector.version]
                    [--collector.node] [--collector.cluster]
                    [--collector.resources] [--collector.config]
                    [config] [port] [address]
pve_exporter: error: Invalid config: Invalid module config entries in config file
  - scrape_configs: Invalid config: Not a dictionary. Check the syntax of the YAML config file.

v2.2.0 isn't available on dockerhub

It seems v2.2.0 isn't available yet on dockerhub. I know they recently changes something that stops the automated builds if you don't have a premium account.

You still can build the image locally, and push it to the registry.

kubernetes service discovery

Hi, I'm running this container in Kubernetes and trying to use kubernetes service discovery to discover this prometheus endpoint. Prometheus discovers it just fine, but the endpoint does not work due to the "?" being encoded. I'll add a screenshot below on what this looks like in prometheus. Any idea how this could work? In the end I made a scraper for it, but it would be nice if it could just be discovered.

image

After upgrading to Proxmox 7, the pve-exporter stopped working

I just upgraded to V7 of proxmox (clean install) and I want to re-install the pve-exporter.
This is what I did:

  • Created os user: useradd prometheus -M
  • Then created user in proxmox GUI as well (see screenshot below)
  • Then changed password
  • Then installed the pve exporter using:
apt-get install python3-venv
python3 -m venv /opt/prometheus-pve-exporter
cd /opt/prometheus-pve-exporter
/opt/prometheus-pve-exporter/bin/pip install prometheus-pve-exporter

Now when I start the pve-exporter using /opt/prometheus-pve-exporter/bin/pve_exporter /etc/prometheus/pve.yml 9211 localhost, it successfully binds and I can reach it. However, when trying to get the metrics, I get this error:

Jul 07 20:44:47 pve pve_exporter[9736]:   File "/opt/prometheus-pve-exporter/lib/python3.9/site-packages/proxmoxer/core.py", line 127, in __init__
Jul 07 20:44:47 pve pve_exporter[9736]:     self._backend = importlib.import_module('.backends.%s' % backend, 'proxmoxer').Backend(host, **kwargs)
Jul 07 20:44:47 pve pve_exporter[9736]:   File "/opt/prometheus-pve-exporter/lib/python3.9/site-packages/proxmoxer/backends/https.py", line 198, in __init__
Jul 07 20:44:47 pve pve_exporter[9736]:     self.auth = ProxmoxHTTPAuth(self.base_url, user, password, verify_ssl, timeout)
Jul 07 20:44:47 pve pve_exporter[9736]:   File "/opt/prometheus-pve-exporter/lib/python3.9/site-packages/proxmoxer/backends/https.py", line 66, in __init__
Jul 07 20:44:47 pve pve_exporter[9736]:     self._getNewTokens(password=password)
Jul 07 20:44:47 pve pve_exporter[9736]:   File "/opt/prometheus-pve-exporter/lib/python3.9/site-packages/proxmoxer/backends/https.py", line 79, in _getNewTokens
Jul 07 20:44:47 pve pve_exporter[9736]:     raise AuthenticationError("Couldn't authenticate user: {0} to {1}".format(self.username, self.base_url + "/access/ticket"))
Jul 07 20:44:47 pve pve_exporter[9736]: proxmoxer.backends.https.AuthenticationError: Couldn't authenticate user: prometheus@pve to https://localhost:8006/api2/json/access/ticket
Jul 07 20:44:47 pve pve_exporter[9736]: 127.0.0.1 - - [07/Jul/2021 20:44:47] "GET /pve HTTP/1.1" 500 -

Screenshot 2021-07-07 at 20 45 06

The contents of my /etc/prometheus/pve.yml-file is this:

default:
    user: prometheus@pve
    password: sEcr3T!
    verify_ssl: false

Error 500s from remote exporter

Summary of Issue

Running prometheus-pve-exporter on a non-proxmox server. prometheus-pve-exporter is returning 500s when queried.

Environment

PVE Manager Version pve-manager/5.2-1
I am running the prometheus-pve-exporter-1.1.1 pip release which I saw patched a similar issue.

Detailed Description

prometheus-pve-exporter logs show:

[10/Jun/2018 19:28:41] "GET /pve?module=default&target=192.168.1.2 HTTP/1.1" 500 -
[10/Jun/2018 19:28:49] "GET /pve?module=default&target=192.168.1.4 HTTP/1.1" 500 -
[10/Jun/2018 19:28:50] "GET /pve?module=default&target=192.168.1.3 HTTP/1.1" 500 -

proxmox node syslogs show:

Jun 10 13:44:49 proxnode pvedaemon[2470]: <root@pam> successful auth for user 'prometheus@pve'

Permissions:
image

Additional Notes

If I navigate to /pve?target=192.168.1.2 on the exporter server I get:

Internal Server Error
'name'

Error when doing pip install

Hey Guys new to the pve_exporter: I ran the install on cli and got the following:

cfadmin@cfart:/var/tmp/prometheus-pve-exporter-1.1.2$ sudo pip3 install prometheus-pve-exporter
The directory '/home/cfadmin/.cache/pip/http' or its parent directory is not owned by the current user and the cache has been disabled. Please check the permissions and owner of that directory. If executing pip with sudo, you may want sudo's -H flag.
The directory '/home/cfadmin/.cache/pip' or its parent directory is not owned by the current user and caching wheels has been disabled. check the permissions and owner of that directory. If executing pip with sudo, you may want sudo's -H flag.

Any have any clues as to why this is doing this?

Thanks,
Michael

Curl pve metrics from endpoint

hello, thanks for this exporter.

I just would like to export metrics from curl and i dont succeed, can you help ? Trying to pass login/pass or targets doesnt change the result.

# curl localhost:9111/pve
<!DOCTYPE HTML PUBLIC "-//W3C//DTD HTML 3.2 Final//EN">
<title>500 Internal Server Error</title>
<h1>Internal Server Error</h1>
<p>HTTPSConnectionPool(host='localhost', port=8006): Max retries exceeded with url: /api2/json/access/ticket (Caused by NewConnectionError('&lt;urllib3.connection.VerifiedHTTPSConnection object at 0x74f8f7b9c550&gt;: Failed to establish a new connection: [Errno 111] Connection refused',))</p>

Thanks in advance

500 Internal Server Error type object argument after ** must be a mapping, not NoneType

Hi-
Trying to get this up and running and keep running into a 500 error I cannot seem to figure out.

Running the exporter on a proxmox node and prometheus remote.

journal on proxmox shows a failed get request.
"GET /pve?module=default HTTP/1.1" 500 -

UI and a curl shows this error-

`

<title>500 Internal Server Error</title>

Internal Server Error

type object argument after ** must be a mapping, not NoneType

`

I cannot for the life of me figure this out so any help would be great! Let me know what you need and I'll get it for you.

Used this guide here to get it installed if that helps any.
https://blog.zwindler.fr/2020/01/06/proxmox-ve-prometheus/?unapproved=21086&moderation-hash=07cf6a6aa2cbec783032cc651e69b38a#comment-21086

permissions for audituser unclear

first of: i can run the exporter successfully from a secondary machine against my single proxmox node using the root@pam user account, so i confirmed the exporter (using docker) works for me.

i've created a pve user through the gui: metrics@pve
i then added the the following roles for the list of paths:
Screenshot_20211203_233757

however, i am getting an exception with a 403. i cannot deduce what role/permission i seem to be missing.

can anybody help?

Exception thrown while rendering view
Traceback (most recent call last):
  File "/usr/lib/python3.8/site-packages/pve_exporter/http.py", line 96, in view
    return view_registry[endpoint](**params)
  File "/usr/lib/python3.8/site-packages/pve_exporter/http.py", line 38, in on_pve
    output = collect_pve(self._config[module], target, self._collectors)
  File "/usr/lib/python3.8/site-packages/pve_exporter/collector.py", line 332, in collect_pve
    return generate_latest(registry)
  File "/usr/lib/python3.8/site-packages/prometheus_client/exposition.py", line 107, in generate_latest
    for metric in registry.collect():
  File "/usr/lib/python3.8/site-packages/prometheus_client/registry.py", line 83, in collect
    for metric in collector.collect():
  File "/usr/lib/python3.8/site-packages/pve_exporter/collector.py", line 45, in collect
    for entry in self._pve.cluster.status.get():
  File "/usr/lib/python3.8/site-packages/proxmoxer/core.py", line 105, in get
    return self(args)._request("GET", params=params)
  File "/usr/lib/python3.8/site-packages/proxmoxer/core.py", line 90, in _request
    raise ResourceException("{0} {1}: {2} - {3}".format(
proxmoxer.core.ResourceException: 403 Forbidden: Permission check failed (/, Sys.Audit) - b'{"data":null}'

Cannot add as Grafana datasource

Hi there,

I can reach the endpoint of prometheus and see the metrics, but it seems I cannot connect to Grafana. Whatever I try it says "Not Found" or "Bad Gateway".

image

prometheus.yml

image

docker-compose.yml

image

I have tried http://localhost:9221, http://<ip-of_exporter>:9221, http://127.0.0.1:9221/pve, http://:9221. I even tried /pve or /pve?target=.

I really don't know what I do wrong, it is probably something small, but I am breaking my head for almost two days trying to fix it.

Anyone can show me the right way? Thanks!

500 Internal Server Error 'module' object has no attribute 'urllib3'

doing some test I see this below ( I removed my real IP)

curl http://127.0.0.1:9221/pve?module=default&target=(internalproxmoxip)
[1] 21218
[root@internalproxmoxip home]#

<title>500 Internal Server Error</title> "

Internal Server Error

"

'module' object has no attribute 'urllib3'

  • job_name: 'pve'
    static_configs:
    • targets:
      • internalproxmoxip # Proxmox VE node with PVE exporter.
        metrics_path: /pve
        params:
        module: [default]
        relabel_configs:
    • source_labels: [address]
      target_label: __param_target
    • source_labels: [__param_target]
      target_label: instance
    • target_label: address
      replacement: 127.0.0.1:9221 # PVE exporter.

to make sure I didn't have access issues I used root for testing

[root@secretservername home]# more pve.yml
default:
user: root
password: mypassword
verify_ssl: false

thanks any guidance

ModuleNotFoundError: No module named 'pve_exporter'

Got this error when running the provided docker command. Is the dockerfile not importing the module correctly, or something a little more mysterious?

$ docker run -it --rm prompve/prometheus-pve-exporter --help

Traceback (most recent call last):
  File "/usr/bin/pve_exporter", line 5, in <module>
    from pve_exporter.cli import main
ModuleNotFoundError: No module named 'pve_exporter'

Node level network_receive/transmit_bytes missing

Hey there,

the exporter is working great but I have a problem. I am interested in reading out the network_receive_bytes and network_transmit_bytes for a whole node to monitor things like CEPH traffic and not just the data for each VM/CT. But it only shows CTs/VMs for the id label.

Is this intended behavior? I read in some other issues, that there are API limitations to what can be read out, so I am wondering if this is maybe also such a limitation?

command pve_exporter not working

Hi,
i was just trying to install everything as it looked great but i am unable to find the config file.
The command: pve_export config troughs me an Error. pve_exporter -h works.
Details on the attached picture.
image

Thanks ahead for your help.

Proxmox Host on port 443 instead of 8006

Hi,

Is there a way to configure the exporter to query on port 443 via nginx instead of 8006?

I have to keep 8006 open for the remote query via /etc/default/pveproxy and cannot close it down.

Thanks.

Internal Server Error 'status'

Please help me find the solution

  • Im not running a cluster proxmox ve

/etc/prometheus/prometheus.yml

  - job_name: 'pve'
    static_configs:
      - targets:
        - 172.16.1.1 # Proxmox VE node.
        - 172.16.1.2 # Proxmox VE node.
    metrics_path: /pve
    params:
      module: [default]
    relabel_configs:
      - source_labels: [__address__]
        target_label: __param_target
      - source_labels: [__param_target]
        target_label: instance
      - target_label: __address__
        replacement: 127.0.0.1:9221  # PVE exporter.

pve.yml

default:
    user: root@pam
    password: mypassecret
    verify_ssl: false

Can somebody help me regarding on the error . Thanks

[root@prometheus bin]# systemctl status prometheus-pve-exporter
● prometheus-pve-exporter.service - Prometheus exporter for Proxmox VE
   Loaded: loaded (/etc/systemd/system/prometheus-pve-exporter.service; disabled; vendor preset: disabled)
   Active: active (running) since Wed 2020-05-27 22:05:37 PST; 1min 18s ago
     Docs: https://github.com/znerol/prometheus-pve-exporter
 Main PID: 7119 (pve_exporter)
   CGroup: /system.slice/prometheus-pve-exporter.service
           └─7119 /usr/bin/python3 /usr/local/bin/pve_exporter /etc/prometheus/pve.yml

May 27 22:06:54 prometheus.it.sparcprc.com pve_exporter[7119]: File "/usr/local/lib/python3.6/site-packages/pve_exporter/collector.py", line 301, in collect_pve
May 27 22:06:54 prometheus.it.sparcprc.com pve_exporter[7119]: return generate_latest(registry)
May 27 22:06:54 prometheus.it.sparcprc.com pve_exporter[7119]: File "/usr/local/lib/python3.6/site-packages/prometheus_client/exposition.py", line 106, in generate_latest
May 27 22:06:54 prometheus.it.sparcprc.com pve_exporter[7119]: for metric in registry.collect():
May 27 22:06:54 prometheus.it.sparcprc.com pve_exporter[7119]: File "/usr/local/lib/python3.6/site-packages/prometheus_client/registry.py", line 82, in collect
May 27 22:06:54 prometheus.it.sparcprc.com pve_exporter[7119]: for metric in collector.collect():
May 27 22:06:54 prometheus.it.sparcprc.com pve_exporter[7119]: File "/usr/local/lib/python3.6/site-packages/pve_exporter/collector.py", line 269, in collect
May 27 22:06:54 prometheus.it.sparcprc.com pve_exporter[7119]: if node["status"] == "online":
May 27 22:06:54 prometheus.it.sparcprc.com pve_exporter[7119]: KeyError: 'status'
May 27 22:06:54 prometheus.it.sparcprc.com pve_exporter[7119]: 127.0.0.1 - - [27/May/2020 22:06:54] "GET /pve?module=default&target=172.16.1.2 HTTP/1.1" 500 -
[root@prometheus bin]# 

browser output

image

Examples: pve-exporter using dns_sd_configs

Hi,

I was wondering if it was possible to add a few examples to the documentation to include pve-exporter running on prometheus host and trying to reach proxmox using dns_sd_configs: section.

No metrics on authorization failure

I observed some random outages of our metrics for all proxmox nodes during incidents with only a single affected node. The log is showing this authorization failure triggered by a request done in the collector.py to get the VM metrics. So I think it happens if a node is reported as online but isn't correctly reachable or has other problems. This should be handled by a try/except logic to allow all other metrics to get correctly collected. I'll add a pull request for that.

Dec 21 00:00:14 node5 pve_exporter[476752]: Exception thrown while rendering view
Dec 21 00:00:14 node5 pve_exporter[476752]: Traceback (most recent call last):
Dec 21 00:00:14 node5 pve_exporter[476752]:   File "/usr/local/lib/python3.7/dist-packages/pve_exporter/http.py", line 101, in view
Dec 21 00:00:14 node5 pve_exporter[476752]:     return self._views[endpoint](**params)
Dec 21 00:00:14 node5 pve_exporter[476752]:   File "/usr/local/lib/python3.7/dist-packages/pve_exporter/http.py", line 53, in on_pve
Dec 21 00:00:14 node5 pve_exporter[476752]:     output = collect_pve(self._config[module], target)
Dec 21 00:00:14 node5 pve_exporter[476752]:   File "/usr/local/lib/python3.7/dist-packages/pve_exporter/collector.py", line 301, in collect_pve
Dec 21 00:00:14 node5 pve_exporter[476752]:     return generate_latest(registry)
Dec 21 00:00:14 node5 pve_exporter[476752]:   File "/usr/local/lib/python3.7/dist-packages/prometheus_client/exposition.py", line 90, in generate_latest
Dec 21 00:00:14 node5 pve_exporter[476752]:     for metric in registry.collect():
Dec 21 00:00:14 node5 pve_exporter[476752]:   File "/usr/local/lib/python3.7/dist-packages/prometheus_client/registry.py", line 75, in collect
Dec 21 00:00:14 node5 pve_exporter[476752]:     for metric in collector.collect():
Dec 21 00:00:14 node5 pve_exporter[476752]:   File "/usr/local/lib/python3.7/dist-packages/pve_exporter/collector.py", line 272, in collect
Dec 21 00:00:14 node5 pve_exporter[476752]:     for vmdata in self._pve.nodes(node['node']).qemu.get():
Dec 21 00:00:14 node5 pve_exporter[476752]:   File "/usr/local/lib/python3.7/dist-packages/proxmoxer/core.py", line 84, in get
Dec 21 00:00:14 node5 pve_exporter[476752]:     return self(args)._request("GET", params=params)
Dec 21 00:00:14 node5 pve_exporter[476752]:   File "/usr/local/lib/python3.7/dist-packages/proxmoxer/core.py", line 79, in _request
Dec 21 00:00:14 node5 pve_exporter[476752]:     resp.content))
Dec 21 00:00:14 node5 pve_exporter[476752]: proxmoxer.core.ResourceException: 401 Unauthorized: b''

cpu usage???

Tell me what about cpu usage?
shows completely different meanings between.
For example, proxymox CPU usage 4.52%, and in monitoring 0.42, etc.
I don’t understand why.

New to Exporter and Prometheus

Hello Guys,

I have installed the exporter on my Prometheus Server however I am getting a http 500 error during the connect process:

127.0.0.1 - - [28/Feb/2018 09:29:14] "GET /pve?module=default&target=192.168.1.2 HTTP/1.1" 500 -
127.0.0.1 - - [28/Feb/2018 09:29:29] "GET /pve?module=default&target=192.168.1.2 HTTP/1.1" 500 -
127.0.0.1 - - [28/Feb/2018 09:29:44] "GET /pve?module=default&target=192.168.1.2 HTTP/1.1" 500 -
127.0.0.1 - - [28/Feb/2018 09:29:59] "GET /pve?module=default&target=192.168.1.2 HTTP/1.1" 500 -
127.0.0.1 - - [28/Feb/2018 09:30:14] "GET /pve?module=default&target=192.168.1.2 HTTP/1.1" 500 -
127.0.0.1 - - [28/Feb/2018 09:30:29] "GET /pve?module=default&target=192.168.1.2 HTTP/1.1" 500 -
127.0.0.1 - - [28/Feb/2018 09:30:44] "GET /pve?module=default&target=192.168.1.2 HTTP/1.1" 500 -

error in prometheus webui:
Get http://127.0.0.1:9221/pve?module=default&target=192.168.1.2: dial tcp 127.0.0.1:9221: getsockopt: connection refused

This is my pve.yml:
default:
user: prometheus@pam
password: sEcr3T!
verify_ssl: false

This is my prometheus.yml:
#############################################

PVE on Prometheus

  • job_name: 'pve'
    static_configs:
    • targets:
      • 192.168.1.2 # PVE exporter running on Prometheus
      • 192.168.1.3 # PVE exporter running on Prometheus
        metrics_path: /pve
        params:
        module: [default]
        relabel_configs:
    • source_labels: [address]
      target_label: __param_target
    • source_labels: [__param_target]
      target_label: instance

Yes this user exists on the promox server and is read only.

Thanks,

return 500 status when any node from cluster is unavailable

I have proxmox cluster with similar nodes 5.4-13 version.
I used exporter version 1.1.2 and all was ok.
With 'http://host:9221/pve' url I get the summary cluster status and nodes info.

But I tried to update exporter to 1.2.0 version and found some troubles.
When one of cluster nodes unavailable - the exporter report 500 status page and no any metrics.
Also the page http://host:9221/pve?target=proxmox-08 (for example) says '595 Errors during connection establishment'
So, when one of my cluster nodes is unavailable - the exporter not show any metrics, only error page.
The previous version 1.1.2 works fine and shows metrics. Here is shown that unavailable node has 'pve_up' metric '0'.

IPv6 support

Can you add IPv6 support? So that the http server also listens on ::9221 if on dual stack. I would supply a patch but I have nearly zero python knowledge

QEMU disks always report 0 usage

It seems all metrics reporting the root disk usage of QEMU VMs report zero (size is correct). Eg:

pve_disk_usage_bytes{id="qemu/104",instance="pve1",job="pve"} 0

Related to #12 so I'm assuming this is an issue with the Proxmox API too - I'll do some more digging and report back if I find anything.

pve_disk_usage_bytes on all qemu guest is null

on all qemu vm is null, lxc - ок

ON pve 6 or 7. Cluster or one node.

pip list --local
Package           Version
----------------- -------
prometheus-client 0.11.0
proxmoxer         1.1.1
Werkzeug          2.0.1
# HELP pve_disk_usage_bytes Disk usage in bytes
# TYPE pve_disk_usage_bytes gauge
pve_disk_usage_bytes{id="qemu/136"} 0.0
pve_disk_usage_bytes{id="lxc/128"} 2.1141504e+09
pve_disk_usage_bytes{id="lxc/119"} 0.0
pve_disk_usage_bytes{id="lxc/120"} 4.493533184e+09
pve_disk_usage_bytes{id="qemu/126"} 0.0
pve_disk_usage_bytes{id="lxc/100"} 6.127427584e+09
pve_disk_usage_bytes{id="lxc/106"} 6.14606848e+09
pve_disk_usage_bytes{id="qemu/114"} 0.0
pve_disk_usage_bytes{id="lxc/108"} 3.995119616e+09
pve_disk_usage_bytes{id="qemu/143"} 0.0
pve_disk_usage_bytes{id="lxc/103"} 4.350595072e+09
pve_disk_usage_bytes{id="qemu/111"} 0.0
pve_disk_usage_bytes{id="lxc/115"} 4.468477952e+0

Error after cluster Construction

Hi,
i had everything running on me server but as i added the first other server to form a cluster it has brocken. (not high available).
Under the domain http://192.168.20.55:9221/pve?target=192.168.20.5 i am seeing this error: 595 Errors during connection establishment, proxy handshake: No route to host -

The second server is not running when i get this error.
If i turn both on it works expect the host cpu an host memory with error: Only queries that return single series/table is supported.
What also could be why it is not showing because the turned off server is called 1 and is listed above the main server called 3.

Thanks for any ideas how to solve my problem of monitoring if on server is turned off and maybe also how to monitor all cpus.

Recommend Projects

  • React photo React

    A declarative, efficient, and flexible JavaScript library for building user interfaces.

  • Vue.js photo Vue.js

    🖖 Vue.js is a progressive, incrementally-adoptable JavaScript framework for building UI on the web.

  • Typescript photo Typescript

    TypeScript is a superset of JavaScript that compiles to clean JavaScript output.

  • TensorFlow photo TensorFlow

    An Open Source Machine Learning Framework for Everyone

  • Django photo Django

    The Web framework for perfectionists with deadlines.

  • D3 photo D3

    Bring data to life with SVG, Canvas and HTML. 📊📈🎉

Recommend Topics

  • javascript

    JavaScript (JS) is a lightweight interpreted programming language with first-class functions.

  • web

    Some thing interesting about web. New door for the world.

  • server

    A server is a program made to process requests and deliver data to clients.

  • Machine learning

    Machine learning is a way of modeling and interpreting data that allows a piece of software to respond intelligently.

  • Game

    Some thing interesting about game, make everyone happy.

Recommend Org

  • Facebook photo Facebook

    We are working to build community through open source technology. NB: members must have two-factor auth.

  • Microsoft photo Microsoft

    Open source projects and samples from Microsoft.

  • Google photo Google

    Google ❤️ Open Source for everyone.

  • D3 photo D3

    Data-Driven Documents codes.