Giter VIP home page Giter VIP logo

segregation's Introduction

Segregation Analysis, Inference, and Decomposition with PySAL

codecov PyPI - Python Version PyPI Conda (channel only) GitHub commits since latest release (branch) DOI Documentation

The PySAL segregation package is a tool for analyzing patterns of urban segregation. With only a few lines of code, segregation users can

Calculate over 40 segregation measures from simple to state-of-the art, including:

Test whether segregation estimates are statistically significant:

Decompose segregation comparisons into

  • differences arising from spatial structure
  • differences arising from demographic structure

Installation

Released versions of segregation are available on pip and anaconda

pip:

pip install segregation

anaconda:

conda install -c conda-forge segregation

You can also install the current development version from this repository

download anaconda:

cd into the directory and run the following commands

conda env create -f environment.yml
conda activate segregation
python setup.py develop

Getting started

For a complete guide to the segregation API, see the online documentation.

For code walkthroughs and sample analyses, see the example notebooks

Calculating Segregation Measures

Each index in the segregation module is implemented as a class, which is built from a pandas.DataFrame or a geopandas.GeoDataFrame. To estimate a segregation statistic, a user needs to call the segregation class she wishes to estimate, and pass three arguments:

  • the DataFrame containing population data
  • the name of the column with population counts for the group of interest
  • the name of the column with the total population for each enumeration unit

Every class in segregation has a statistic and a core_data attributes. The first is a direct access to the point estimation of the specific segregation measure and the second attribute gives access to the main data that the module uses internally to perform the estimates.

Single group measures

If, for example, a user was studying income segregation and wanted to know whether high-income residents tend to be more segregated from others. This user may want would want to fit a dissimilarity index (D) to a DataFrame called df to a specific group with columns like "hi_income", "med_income" and "low_income" that store counts of people in each income bracket, and a total column called "total_population". A typical call would be something like this:

from segregation.aspatial import Dissim
d_index = Dissim(df, "hi_income", "total_population")

To see the estimated D in the first generic example above, the user would have just to run d_index.statistic to see the fitted value.

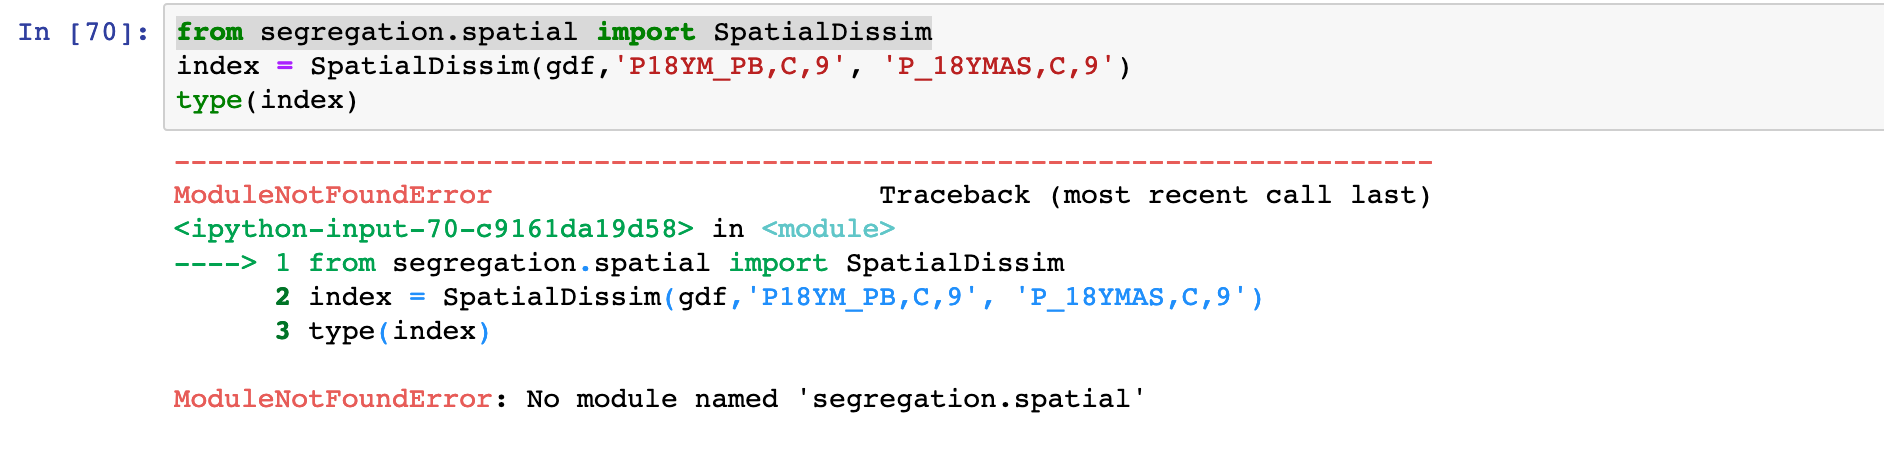
If a user would want to fit a spatial dissimilarity index (SD), the call would be nearly identical, save for the fact that the DataFrame now needs to be a GeoDataFrame with an appropriate geometry column

from segregation.spatial import SpatialDissim
spatial_index = SpatialDissim(gdf, "hi_income", "total_population")

Some spatial indices can also accept either a PySAL W object, or a pandana Network object, which allows the user full control over how to parameterize spatial effects. The network functions can be particularly useful for teasing out differences in segregation measures caused by two cities that have two very different spatial structures, like for example Detroit MI (left) and Monroe LA (right):

For point estimation, all single-group indices available are summarized in the following table:

Measure Class/Function Spatial? Specific Arguments
Dissimilarity (D) Dissim No -
Gini (G) GiniSeg No -
Entropy (H) Entropy No -
Isolation (xPx) Isolation No -
Exposure (xPy) Exposure No -
Atkinson (A) Atkinson No b
Correlation Ratio (V) CorrelationR No -
Concentration Profile (R) ConProf No m
Modified Dissimilarity (Dct) ModifiedDissim No iterations
Modified Gini (Gct) ModifiedGiniSeg No iterations
Bias-Corrected Dissimilarity (Dbc) BiasCorrectedDissim No B
Density-Corrected Dissimilarity (Ddc) DensityCorrectedDissim No xtol
Minimun-Maximum Index (MM) MinMax No
Spatial Proximity Profile (SPP) SpatialProxProf Yes m
Spatial Dissimilarity (SD) SpatialDissim Yes w, standardize
Boundary Spatial Dissimilarity (BSD) BoundarySpatialDissim Yes standardize
Perimeter Area Ratio Spatial Dissimilarity (PARD) PerimeterAreaRatioSpatialDissim Yes standardize
Distance Decay Isolation (DDxPx) DistanceDecayIsolation Yes alpha, beta, metric
Distance Decay Exposure (DDxPy) DistanceDecayExposure Yes alpha, beta, metric
Spatial Proximity (SP) SpatialProximity Yes alpha, beta, metric
Absolute Clustering (ACL) AbsoluteClustering Yes alpha, beta, metric
Relative Clustering (RCL) RelativeClustering Yes alpha, beta, metric
Delta (DEL) Delta Yes -
Absolute Concentration (ACO) AbsoluteConcentration Yes -
Relative Concentration (RCO) RelativeConcentration Yes -
Absolute Centralization (ACE) AbsoluteCentralization Yes -
Relative Centralization (RCE) RelativeCentralization Yes -
Spatial Minimun-Maximum (SMM) SpatialMinMax Yes network, w, decay, distance, precompute

Multigroup measures

segregation also facilitates the estimation of multigroup segregation measures.

In this case, the call is nearly identical to the single-group, only now we pass a list of column names rather than a single string; reprising the income segregation example above, an example call might look like this

from segregation.aspatial import MultiDissim
index = MultiDissim(df, ['hi_income', 'med_income', 'low_income'])
index.statistic

Available multi-group indices are summarized in the table below:

Measure Class/Function Spatial? Specific Arguments
Multigroup Dissimilarity MultiDissim No -
Multigroup Gini MultiGiniSeg No -
Multigroup Normalized Exposure MultiNormalizedExposure No -
Multigroup Information Theory MultiInformationTheory No -
Multigroup Relative Diversity MultiRelativeDiversity No -
Multigroup Squared Coefficient of Variation MultiSquaredCoefficientVariation No -
Multigroup Diversity MultiDiversity No normalized
Simpson’s Concentration SimpsonsConcentration No -
Simpson’s Interaction SimpsonsInteraction No -
Multigroup Divergence MultiDivergence No -

Local measures

Also, it is possible to calculate local measures of segregation. A statistics attribute will contain the values of these indexes. Note: in this case the attribute is in the plural since, many statistics are fitted, one for each enumeration unit Local segregation indices have the same signature as their global cousins and are summarized in the table below:

Measure Class/Function Spatial? Specific Arguments
Location Quotient MultiLocationQuotient No -
Local Diversity MultiLocalDiversity No -
Local Entropy MultiLocalEntropy No -
Local Simpson’s Concentration MultiLocalSimpsonConcentration No -
Local Simpson’s Interaction MultiLocalSimpsonInteraction No -
Local Centralization LocalRelativeCentralization Yes -

Testing for Statistical Significance

Once the segregation indexes are fitted, the user can perform inference to shed light for statistical significance in regional analysis. The summary of the inference framework is presented in the table below:

Inference Type Class/Function Function main Inputs Function Outputs
Single Value SingleValueTest seg_class, iterations_under_null, null_approach, two_tailed p_value, est_sim, statistic
Two Values TwoValueTest seg_class_1, seg_class_2, iterations_under_null, null_approach p_value, est_sim, est_point_diff

Another useful analysis that can be performed with the segregation module is a decompositional approach where two different indexes can be broken down into their spatial component (c_s) and attribute component (c_a). This framework is summarized in the table below:

Framework Class/Function Function main Inputs Function Outputs
Decomposition DecomposeSegregation index1, index2, counterfactual_approach c_a, c_s

In this case, the difference in measured D statistics between Detroit and Monroe is attributable primarily to their demographic makeup, rather than the spatial structure of the two cities. (Note, this is to be expected since D is not a spatial index)

Contributing

PySAL-segregation is under active development and contributors are welcome.

If you have any suggestion, feature request, or bug report, please open a new issue on GitHub. To submit patches, please follow the PySAL development guidelines and open a pull request. Once your changes get merged, you’ll automatically be added to the Contributors List.

Support

If you are having issues, please talk to us in the gitter room.

License

The project is licensed under the BSD license.

Funding

Award #1831615 RIDIR: Scalable Geospatial Analytics for Social Science Research

Renan Xavier Cortes is grateful for the support of Coordenação de Aperfeiçoamento de Pessoal de Nível Superior - Brazil (CAPES) - Process number 88881.170553/2018-01

Citation

To cite segregation, we recommend the following

@software{renan_xavier_cortes_2020,
  author       = {Renan Xavier Cortes and
                  eli knaap and
                  Sergio Rey and
                  Wei Kang and
                  Philip Stephens and
                  James Gaboardi and
                  Levi John Wolf and
                  Antti Härkönen and
                  Dani Arribas-Bel},
  title        = {PySAL/segregation: Segregation Analysis, Inference, & Decomposition},
  month        = feb,
  year         = 2020,
  publisher    = {Zenodo},
  doi          = {10.5281/zenodo.3265359},
  url          = {https://doi.org/10.5281/zenodo.3265359}
}

segregation's People

Contributors

anttihaerkoenen avatar darribas avatar jgaboardi avatar knaaptime avatar ljwolf avatar martinfleis avatar noahbouchier avatar pastephens avatar renanxcortes avatar sjsrey avatar weikang9009 avatar

Stargazers

 avatar  avatar  avatar  avatar  avatar  avatar  avatar  avatar  avatar  avatar  avatar  avatar  avatar  avatar  avatar  avatar  avatar  avatar  avatar  avatar  avatar  avatar  avatar  avatar  avatar  avatar  avatar  avatar  avatar  avatar  avatar  avatar  avatar  avatar  avatar  avatar  avatar  avatar  avatar  avatar  avatar  avatar  avatar  avatar  avatar  avatar  avatar  avatar  avatar  avatar  avatar  avatar  avatar  avatar  avatar  avatar  avatar  avatar  avatar  avatar  avatar  avatar  avatar  avatar  avatar  avatar  avatar  avatar  avatar  avatar  avatar  avatar  avatar  avatar  avatar  avatar  avatar  avatar  avatar  avatar  avatar  avatar  avatar  avatar  avatar  avatar  avatar  avatar  avatar  avatar  avatar  avatar  avatar  avatar  avatar  avatar  avatar  avatar  avatar  avatar

Watchers

 avatar  avatar  avatar  avatar  avatar  avatar  avatar  avatar  avatar  avatar  avatar  avatar  avatar  avatar  avatar  avatar  avatar  avatar  avatar  avatar  avatar  avatar

segregation's Issues

improve readme with network examples

I'm +1 for improving the ReadMe to encourage users to use the package. I think that the network graphs of Atlanta would be a nice visualization to add in the ReadMe right after the inference example. Aso an explanation of the networks based segregation in the readme would be cool (or perhaps only mentioning the notebook, but I think a summary would be suitable).

handling nans/missing values

the following will result in a np.nan value for the statistic because n_nonhsip_black_persons has NaN values.

dc = Community(source='ltdb', cbsafips='47900')
dc = dc.tracts.merge(dc.census,left_on='geoid', right_index=True)
dc_sd = SpatialDissim(dc, group_pop_var='n_nonhisp_black_persons', total_pop_var='n_total_pop')

We should either move to more robust numpy operators that handle nans, or check whether there are any present in group_pop_var or total_pop_var and raise accordingly

parallelization simulation based indexes and inference wrappers

  • Some indexes such as Modified Dissimilarity (Dct), Modified Gini (Gct) and Bias-Corrected Dissimilarity (Dbc) could be leveraged to work in parallel since they rely on independent draws of probability distributions and recalculating the index.

  • Also, the inference wrappers (Infer_Segregation and Compare_Segregation) could be leveraged to work in parallel since they rely on independent simulations framework.

A possibility to implement is to use Dask (https://github.com/dask/dask), concurrent.futures (https://docs.python.org/3/library/concurrent.futures.html), etc.

error when installing using pip

Hi, I've been getting an error when I try to install segregation using option 2, the pip install option.

Command "python setup.py egg_info" failed with error code 1 in C:\Users\lm13n\AppData\Local\Temp\pip-install-r6y591a0\fiona\

I am installing into an Anaconda Python 3.6.8 environment on Windows 10. However, option 1 installs successfully.

Thanks,
Levon

change the current API of network notebook

Currently nbsit and Multi_Information_Theory function are performing the same calculations. I think it makes more sense to go with the current segregation API, i.e., the latter approach:

image

I could make a PR with this change, but I still didn't manage to fetch 5000 buffer for the example.

plots should return fig/ax for composability

most of the plotting functionality started as a convenience for ourselves, but now that we're using them more often we need to make sure we're returning at least the axes object so users can edit/save/combine plots, etc

Strange non-corresponding legend on output (Out)when running indexes

When running segregation indexes, I get a non-corresponding output legend (Out). It repeats the same output line: "segregation.spatial.spatial_indexes.SpatialDissim" regardless if the index has change... here an example of two different indexes, same Out legend:
Screen Shot 2019-08-22 at 7 20 42 PM

This seems to be the default Output line in my local results... in every index...but this is not the case in the examples from the notebook.

Any ideas as to what can be the problem in my local version? Thanks!!!

add DOI

i turned on the zenodo integration for this repo, so the next github release should get tagged automatically with a DOI. Once that happens, we should add the badge to the repo

To Do:

  • cut github release
  • add badge to readme

consider multi-group segregation indexes

Consider implement the multi-group indexes. A good start can be the following (Luc Anselin questioned that to me at the AAG 2019):
"Reardon, Sean F., and Glenn Firebaugh. "Measures of multigroup segregation." Sociological methodology 32.1 (2002): 33-67."

consider refactor to scikit-style mixins

@renanxcortes and I have had some conversations about refactoring this project so that, instead of each segregation index being implemented as its own class, we might have two classes (e.g. spatial and aspatial), and the indices themselves would move to subclasses or functions.

In another thread, as we work on spopt we're making a concerted effort to use the BaseClass/Mixin structure that scikit-learn uses. I want to raise the option here of adopting a similar architecture, which i think would make a lot of sense for this project

[ENH] extend segregation profile function to accept more spatial indices

compute_segregation_profile calculates SIT for varying distances, but it should be extended to calculate any index that takes a W or a Network

currently, these include SIT or spatial divergence, but this might be a good time to think through which others could be re/written to follow the subclass pattern those use (I think spatialdissim, maybe others). That would help get us on the road to #4

sidenote that I still think compute_segregation_profile is a bit verbose, so i'd be open to new name suggestions

absolute concentration values not matching with other open-source options?

I've been struggling with the concentration indexes (especially the ACO), because I'm trying to match the values with the ones that is generated by OasisR (https://cran.r-project.org/web/packages/OasisR/OasisR.pdf)... in the original paper of OasisR the author (page 12, Table 6) states that this index matches the one of the GSA implementations.

However, I'm closely checking line by line of the functions and am not seeing any difference of the R implementation (https://github.com/cran/OasisR/blob/99f5d028c205329c4f3b1355e5bcaa09e1fcc077/R/SegFunctions.R#L1358) and our implementation. I highlight that the R and GSA implementation might be not correct, but I wanted to open a discussion of this.

The original formula is:

image

To reproduce this in Python (edit path needed):

import geopandas as gpd
import segregation
from segregation.spatial import Absolute_Concentration

irreg = gpd.read_file('C:\\Users\\renan\\Desktop\\oasisTests\\irregular_lattice_50.shp')
irreg['group_pop_var'] = list(range(1, 51))
irreg['total_pop_var'] = 100
index1 = Absolute_Concentration(irreg, 'group_pop_var', 'total_pop_var')
index1.statistic

to reproduce this in R (edit path needed):

library(OasisR)
library(rgdal)
irreg<-readOGR("C:\\Users\\renan\\Desktop\\oasisTests","irregular_lattice_50")
vector1 <- seq(1,50) # Group 1 Population
tot <- rep(100, 50)
vector2 <- tot - vector1 # Group 2 Population
irreg_input_data <- cbind(vector1, vector2)
ACO(irreg_input_data, spatobj = irreg)
# The first value is the ACO value for the first group

The irregular lattice used is attached.
irregular_lattice_50.zip

function to calculate segregation profiles

in this piece, Reardon et al calculate multiscalar segregation profiles by calculating several spatial information theory indices with different specifications of W (increasing in kernel distance). By calculating the ratio of SIT w/ a small-distance W against SIT w/ a large-distance W, they can decompose segregation as a function of scale

"In particular, we find that the proportion of micro-scale segregation that is due to macro-scale segregation ranges between 20% and 80% across these 40 metropolitan areas, with macro-scale segregation generally accounting for a larger share of white-black segregation than of white-Hispanic or white Asian segregation. This heterogeneity raises a number of >additional questions that we (and other scholars, we hope) will address in subsequent research."

Now that we have SIT in the library, we could provide a function to do the same. This would also serve to help movtivate the use of network-based kernel weights, like discussed here

Defining urban core for centralization indices

The definition of urban core is essential to the centralization indices. Right now, the urban core is defined as the geometric center of the centroids of input polygons (e.g. tract boundaries). While this definition is convenient and could be meaningful in some cases, it might not be the best way to define urban core in others. Some other options could be:

  • the central business district (CBD)
  • the population centroid
  • the centroid of the MSA (the dissolved boundary of all tracts)

I think it would be nice to provide these options to users.

Another complication related to measuring the centralization dimension of a MSA is that it could host several cities, each of which has an urban core.

release checklist

TODO Prior to next release:

Critical

  • RX: rename profile to compute_all()
  • RX: compute_all should return a pandas.DataFrame instead of a dict
  • RX: smart counterfactual approach
  • RX: decide on distance decay isolation name
  • EK: docstrings for network funcs
  • EK: dosctrings for util plots
  • EK: add tests for network measures
  • EK: move udst dependencies into extra_requirements.txt and add warning to network functions
  • EK: update readme
    • add DOI badge to readme
    • add network example

Minor:

  • decide on signature for spatial indices as discussed here
    e.g.:
def localize(data, w):
	new_data = []
	w = pysal.weights.insert_diagonal(w) # attach focal unit to environment
	for y in data:
		new_data.append(lag_spatial(w,y)
	return new_data

Building Error (after tqdm inclusion?)

I think that after adding tqdm in #109, TravisCI broke and the error log is:

Using /home/travis/build/pysal/segregation/miniconda/envs/test-env/lib/python3.7/site-packages
Finished processing dependencies for segregation==1.1.0
The command "python setup.py install" exited with 0.
21.95s$ nosetests -v segregation --with-coverage
Failure: ImportError (libcfitsio.so.5: cannot open shared object file: No such file or directory) ... ERROR
======================================================================
ERROR: Failure: ImportError (libcfitsio.so.5: cannot open shared object file: No such file or directory)
----------------------------------------------------------------------

Not really sure how to to debug this. Any ideas?

Swap to more robust tests that rely on numpy seeds

Segregation on PySAL started to fail on travis https://travis-ci.org/pysal/pysal/jobs/566597373#L2405

This is due to indexes that rely on simulations and, therefore, numpy seeds. Travis now is building using numpy 1.17.0 (released 6 days ago). Some features were changed in the generating process of the seeds as you can read in https://github.com/numpy/numpy/releases.

image

I upgraded locally my numpy to 1.17.0 (previously it was 1.16.0) and, now, my seed generates the values that match the new tests (7 digit precision).

Since I don't think it is a good thing the rely on the numpy version for the simulation-based tests... I think I'll increase the degree of tolerance of all tests and rewrite the tests (inference based also will change since they also rely on numpy seeds).

tweaks readme

The sentence To see the estimated D in the first generic example above, the user would have just to run index.statistic to see the fitted value. should change its location to after the "d_index" call and be updated to "d_index".

Also, we can pt a point after "total_population" and put uppercase "A" in:

"a typical call would be something like this:"

Recommend Projects

  • React photo React

    A declarative, efficient, and flexible JavaScript library for building user interfaces.

  • Vue.js photo Vue.js

    🖖 Vue.js is a progressive, incrementally-adoptable JavaScript framework for building UI on the web.

  • Typescript photo Typescript

    TypeScript is a superset of JavaScript that compiles to clean JavaScript output.

  • TensorFlow photo TensorFlow

    An Open Source Machine Learning Framework for Everyone

  • Django photo Django

    The Web framework for perfectionists with deadlines.

  • D3 photo D3

    Bring data to life with SVG, Canvas and HTML. 📊📈🎉

Recommend Topics

  • javascript

    JavaScript (JS) is a lightweight interpreted programming language with first-class functions.

  • web

    Some thing interesting about web. New door for the world.

  • server

    A server is a program made to process requests and deliver data to clients.

  • Machine learning

    Machine learning is a way of modeling and interpreting data that allows a piece of software to respond intelligently.

  • Game

    Some thing interesting about game, make everyone happy.

Recommend Org

  • Facebook photo Facebook

    We are working to build community through open source technology. NB: members must have two-factor auth.

  • Microsoft photo Microsoft

    Open source projects and samples from Microsoft.

  • Google photo Google

    Google ❤️ Open Source for everyone.

  • D3 photo D3

    Data-Driven Documents codes.