English | 简体中文


Graphic Walker is an open-source alternative to Tableau. It allows data scientists to analyze data and visualize patterns with simple drag-and-drop operations.
Main features:
- A grammar of graphics based visual analytic user interface where users can build visualization from low-level visual channel encodings.
- A Data Explainer which explains why some patterns occur / what may cause them.
First, upload your CSV file, preview your data, and define the analytic type of columns (dimension or measure).
We are developing more types of data sources. Welcome to raise an issue telling us the types of sources you are using. If you are a developer, graphic-walker can be used as an embedding component, and you can pass your parsed data source to it. For example, Rath uses graphic-walker as an embeding components, and it supports many common data sources. You can load your data in Rath and bring the data into graphic-walker. In this way, users can also benefit from data cleaning and transformation features in Rath.
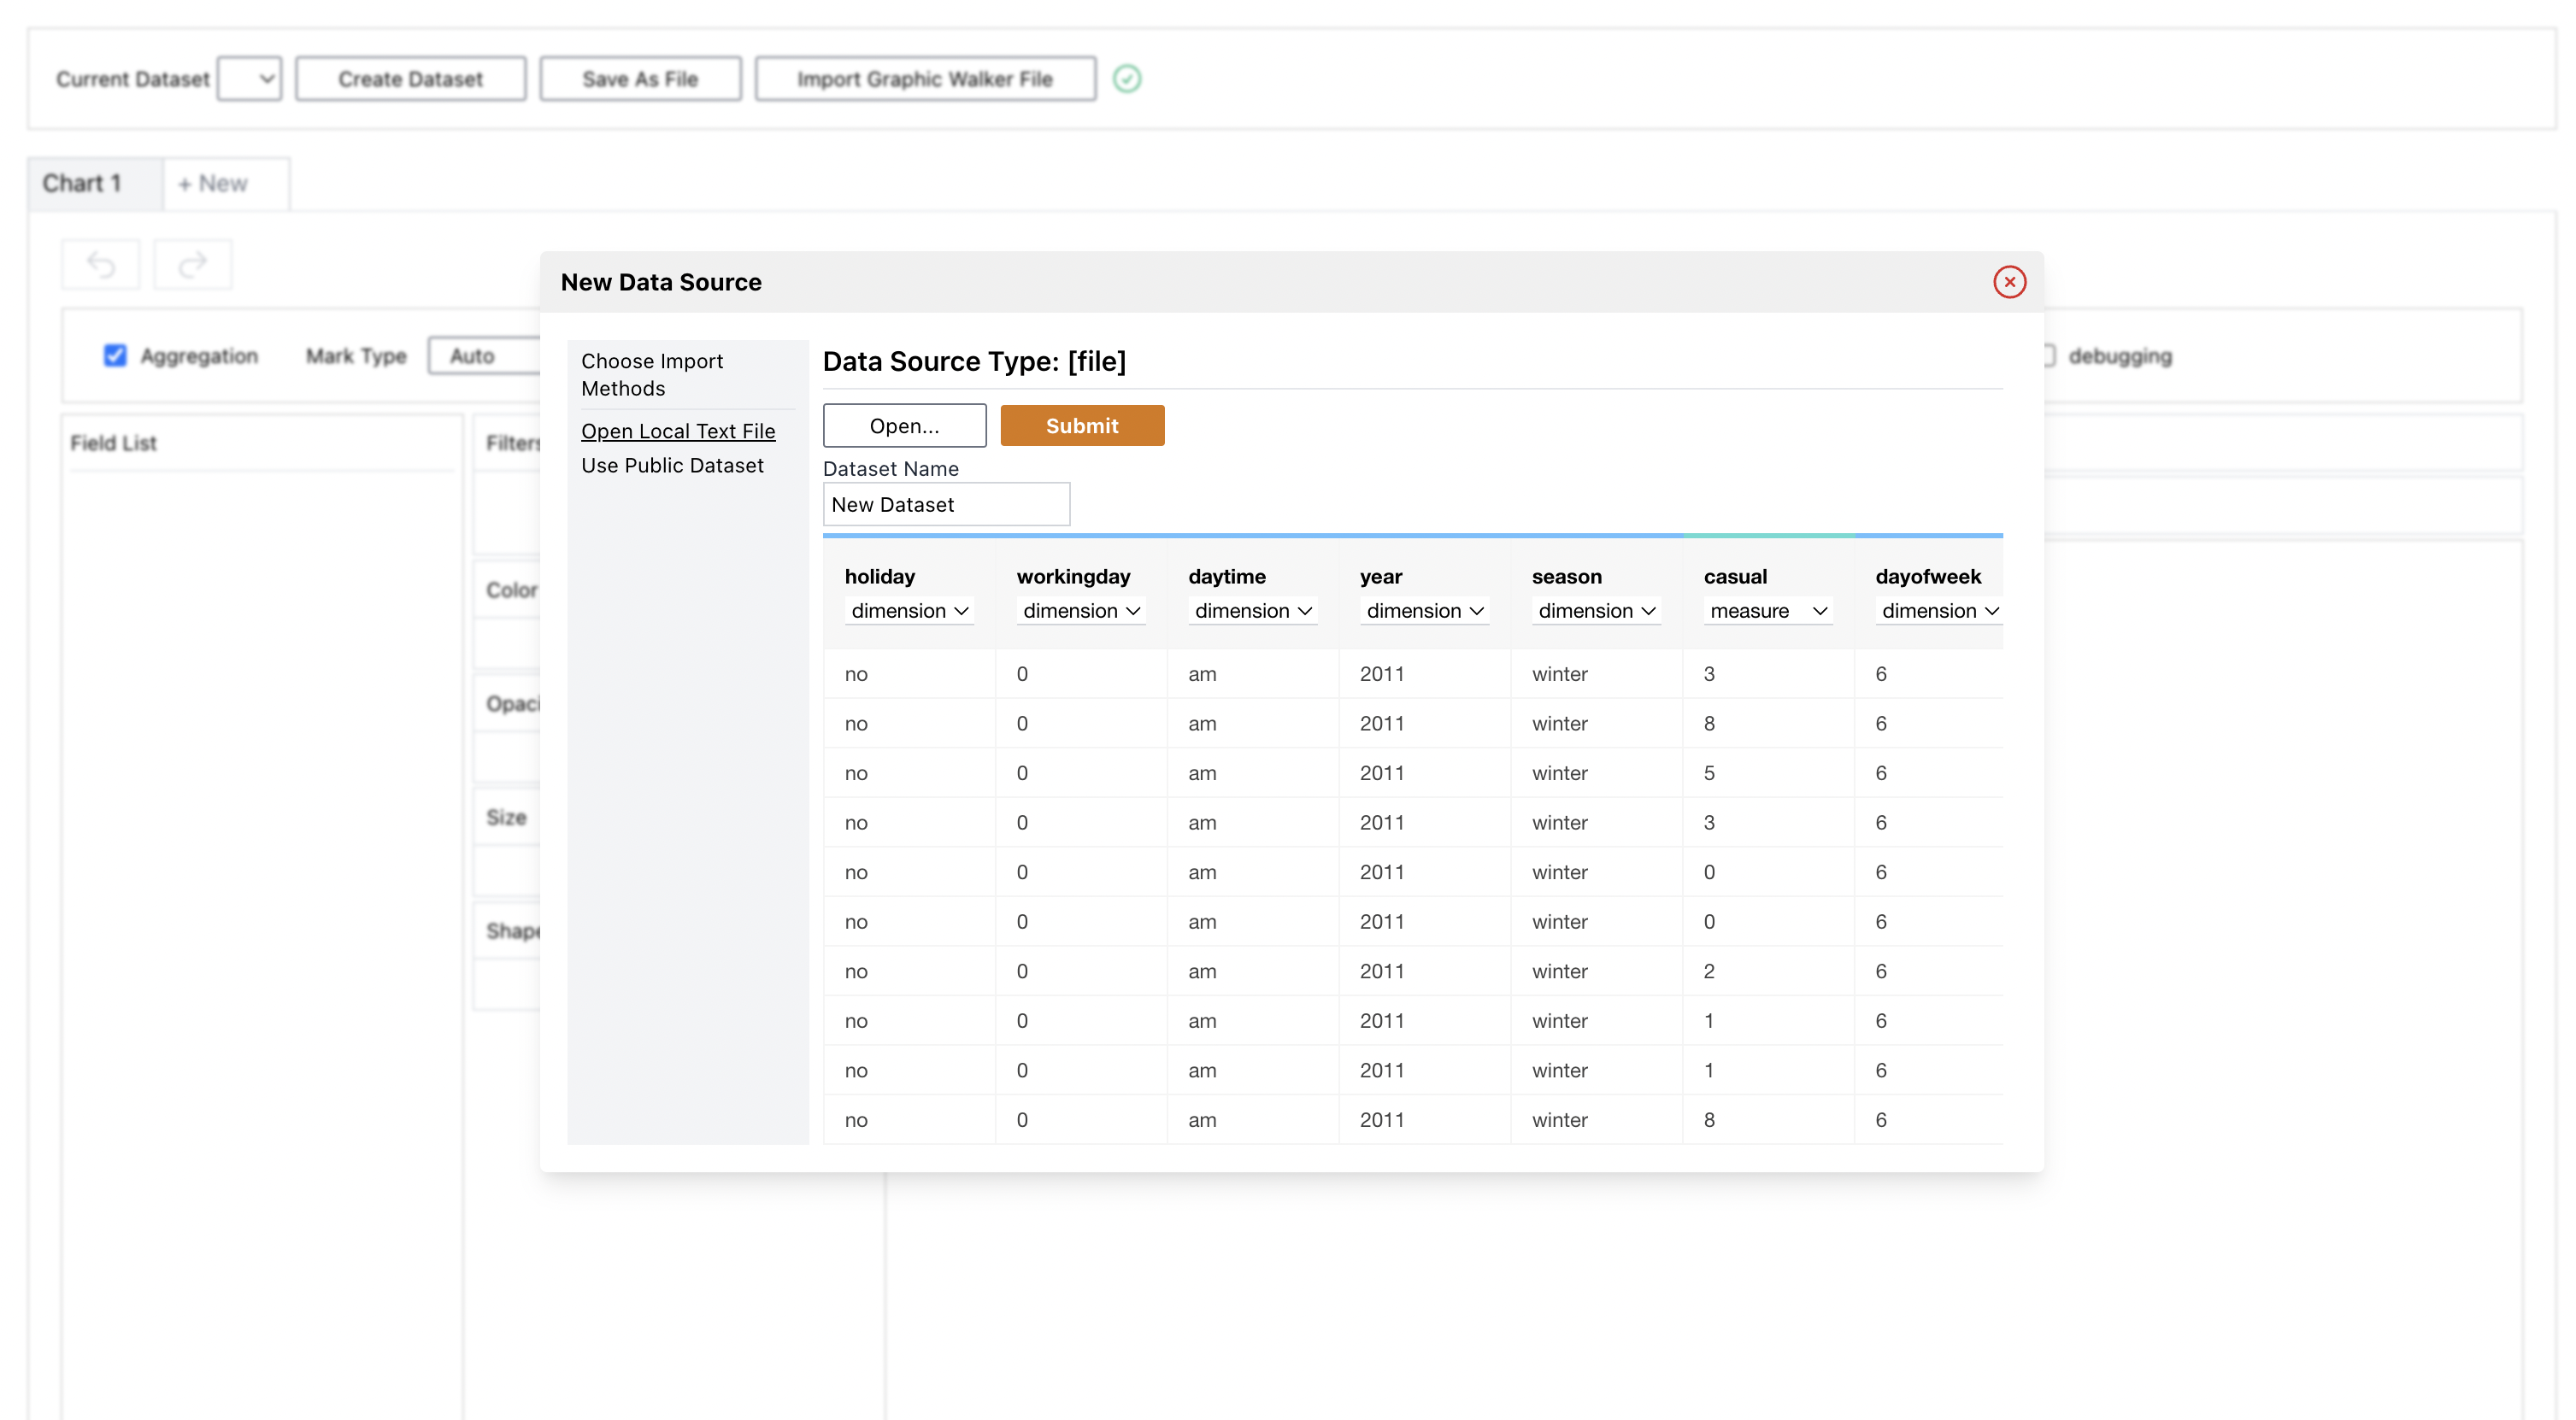
When the data is ready, click the 'Submit' button to use the data. On the left-hand side, Field List is all your original columns in the table. You can drag them into visual channels (rows, columns, color, opacity, etc.) and make visualizations.

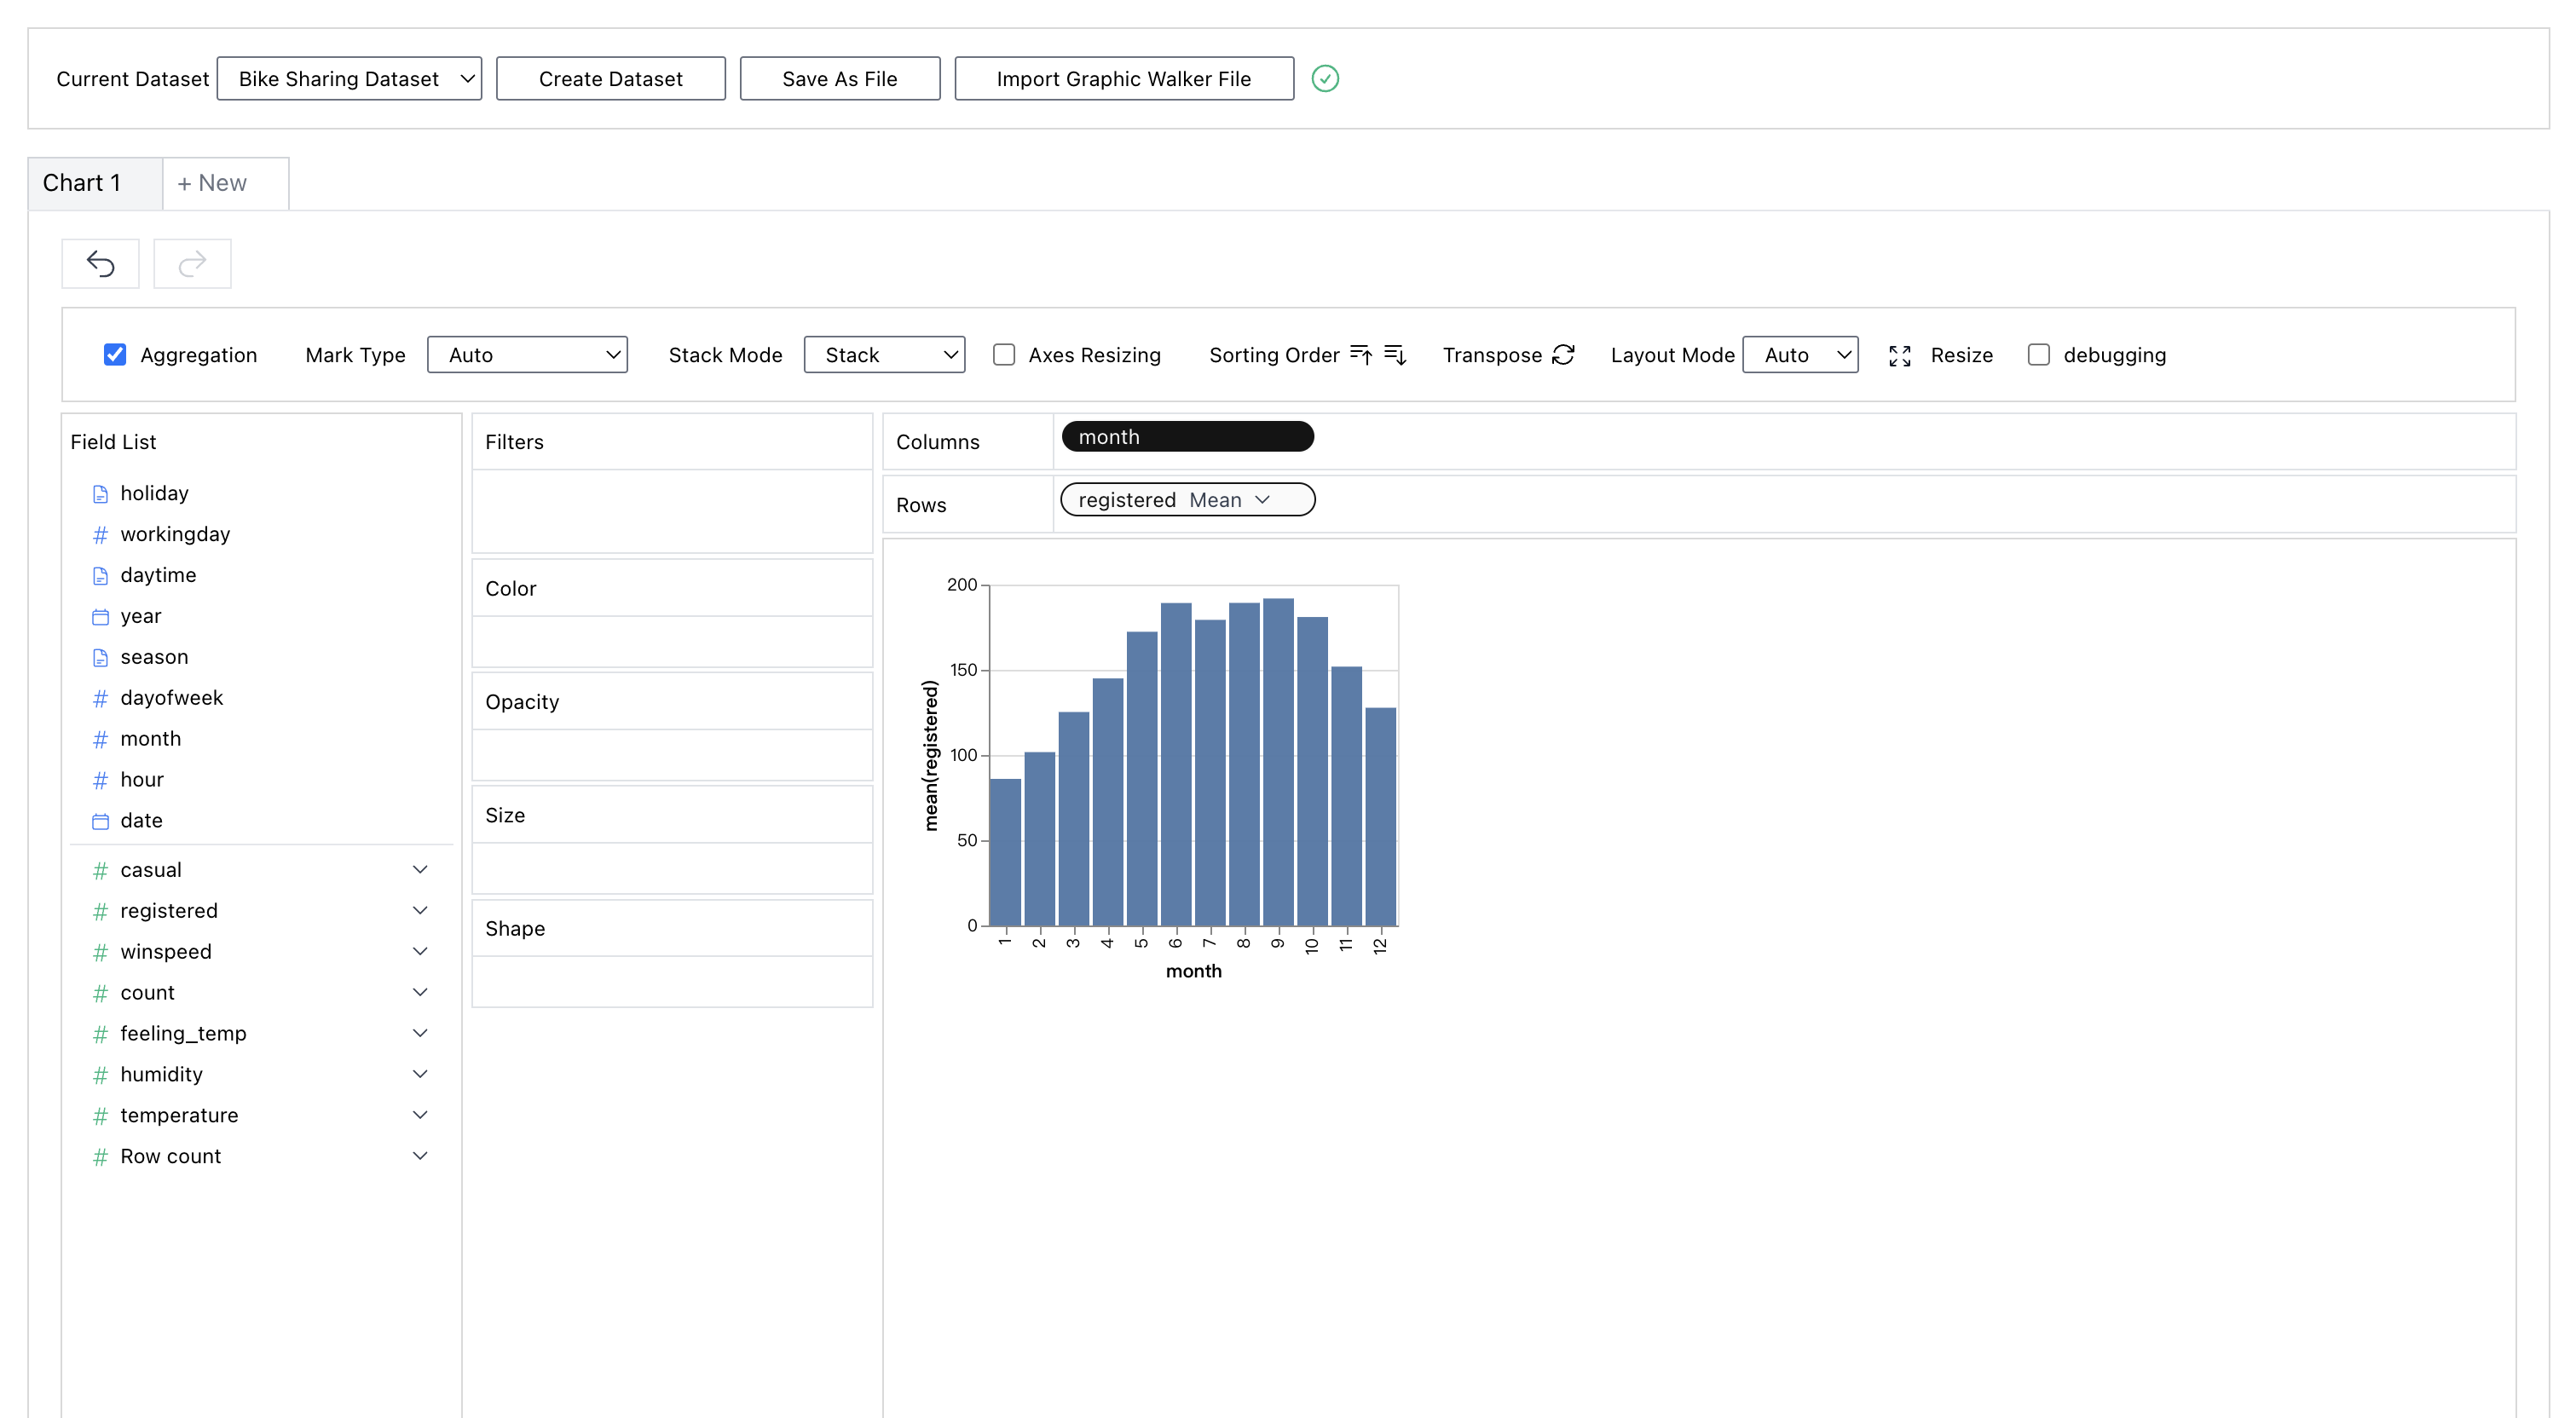
Visualize your data with drag and drop operation. For measures, you can define the aggregation methods (sum, mean, count etc.)
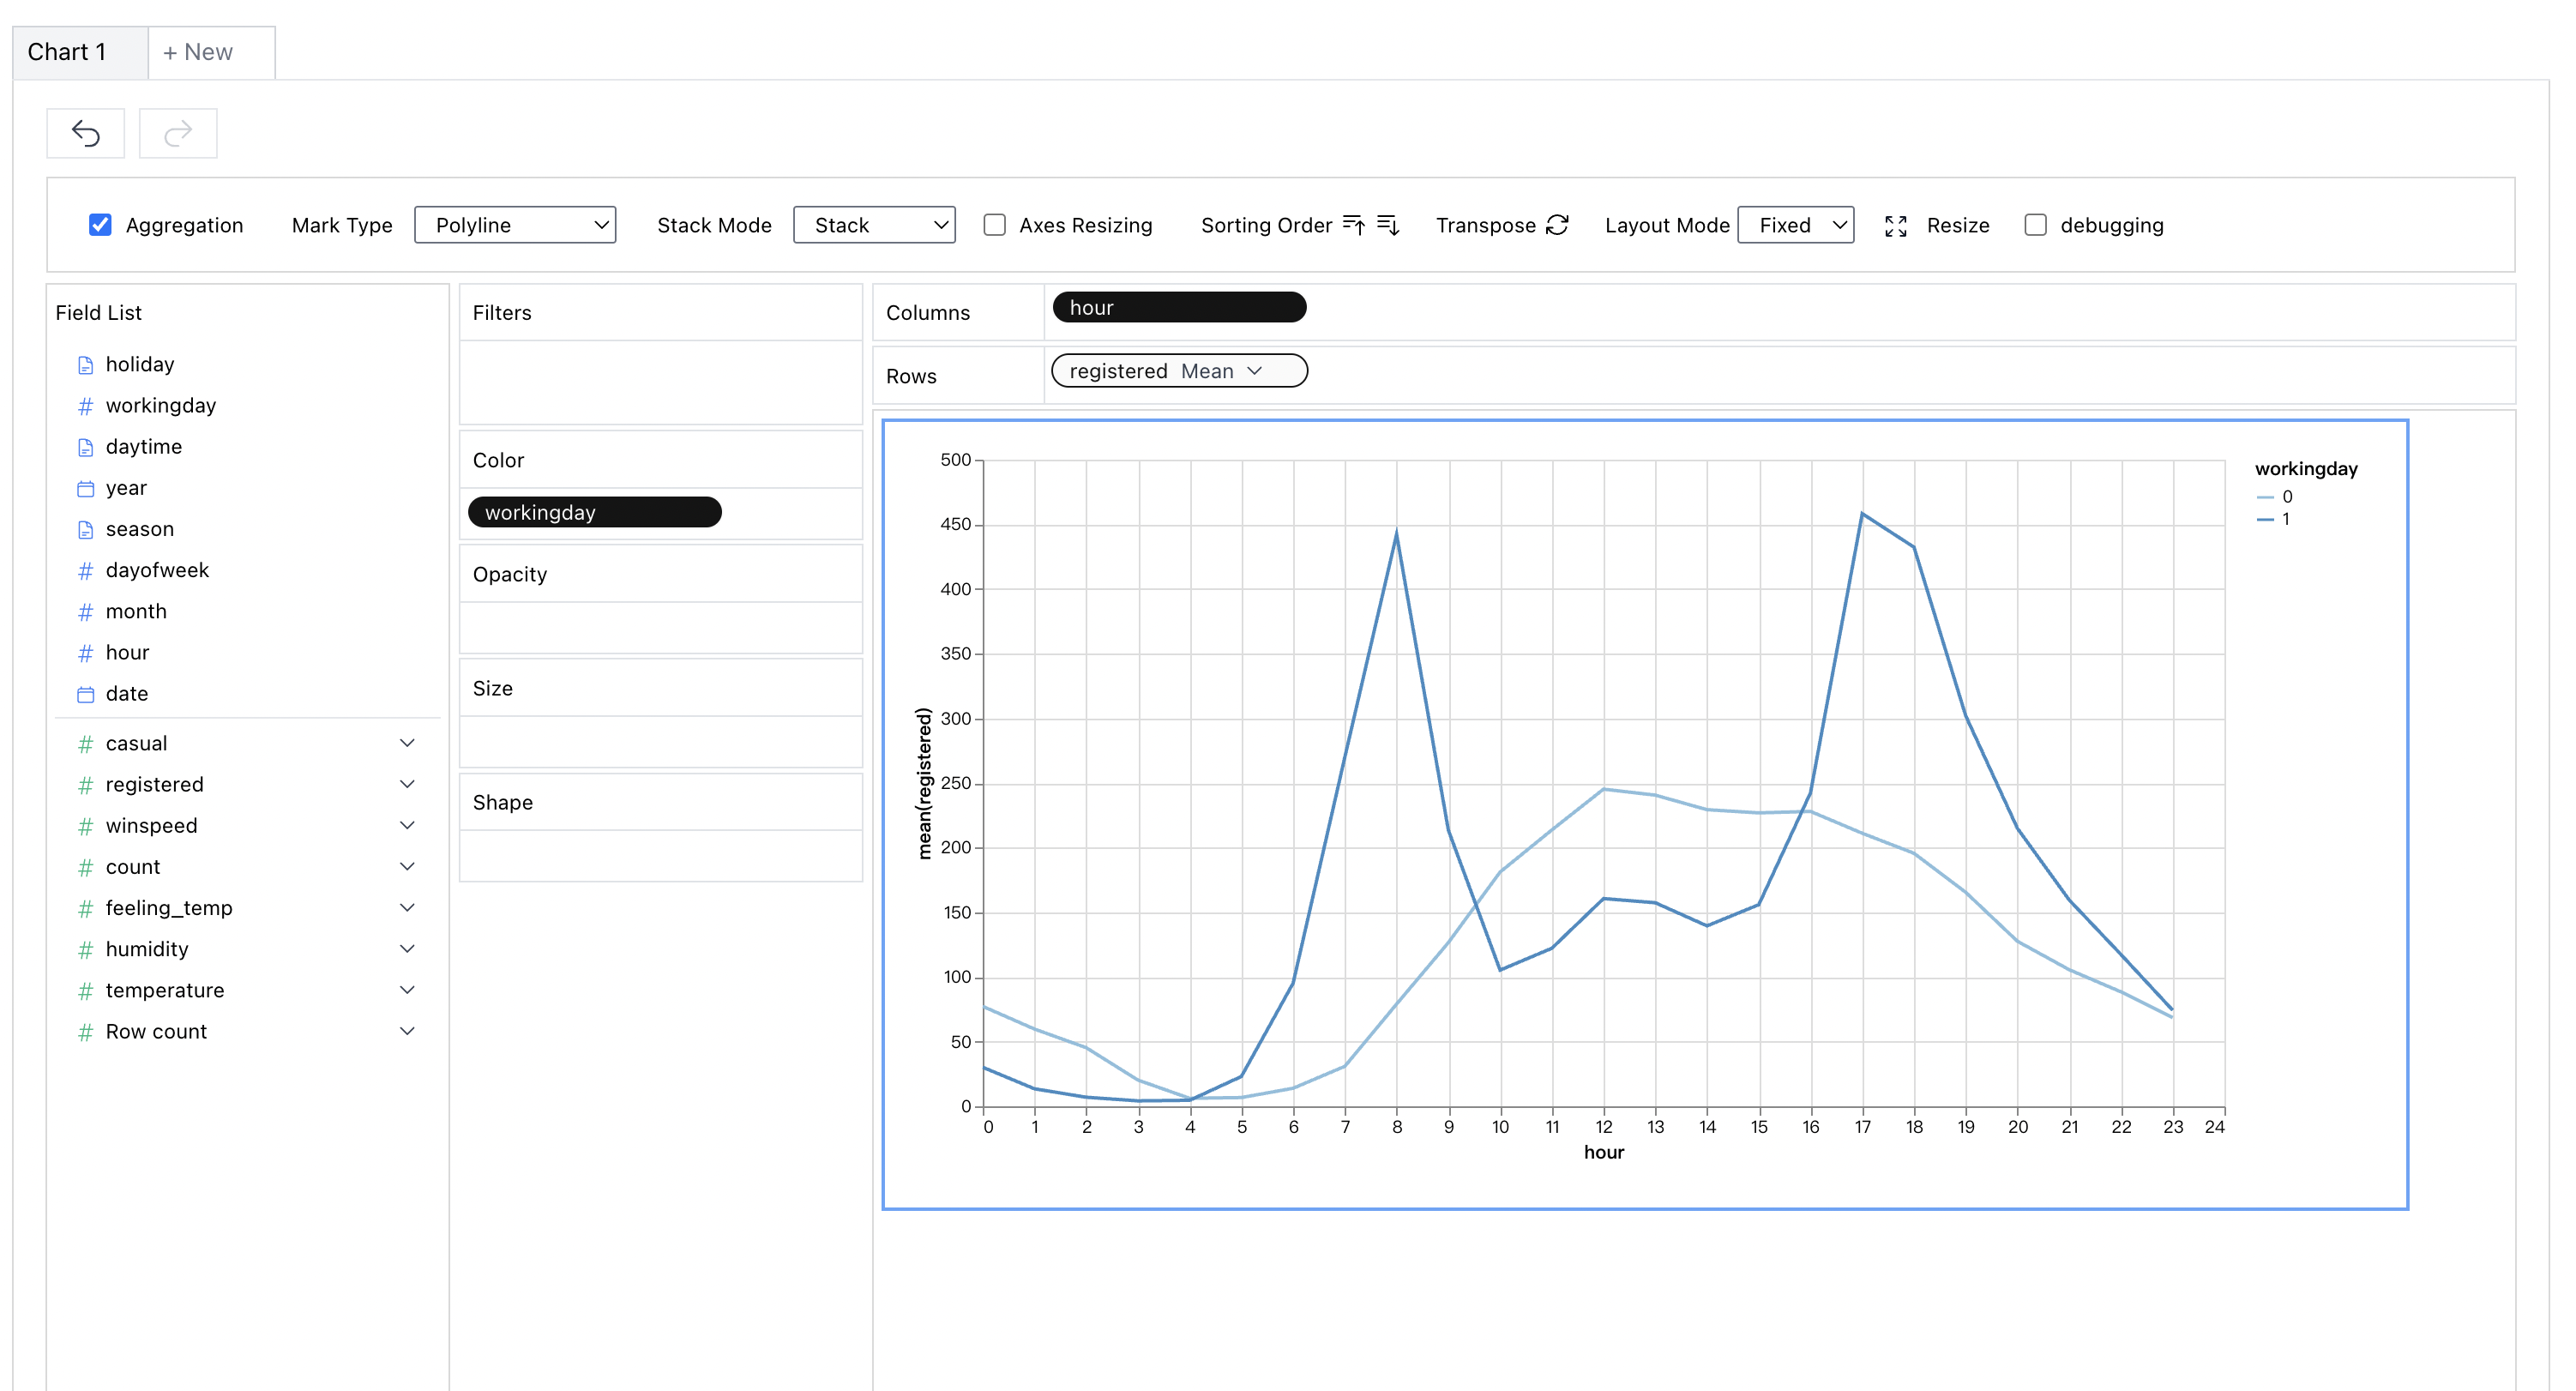
You can change the mark type into others to make different charts, for example, a line chart.
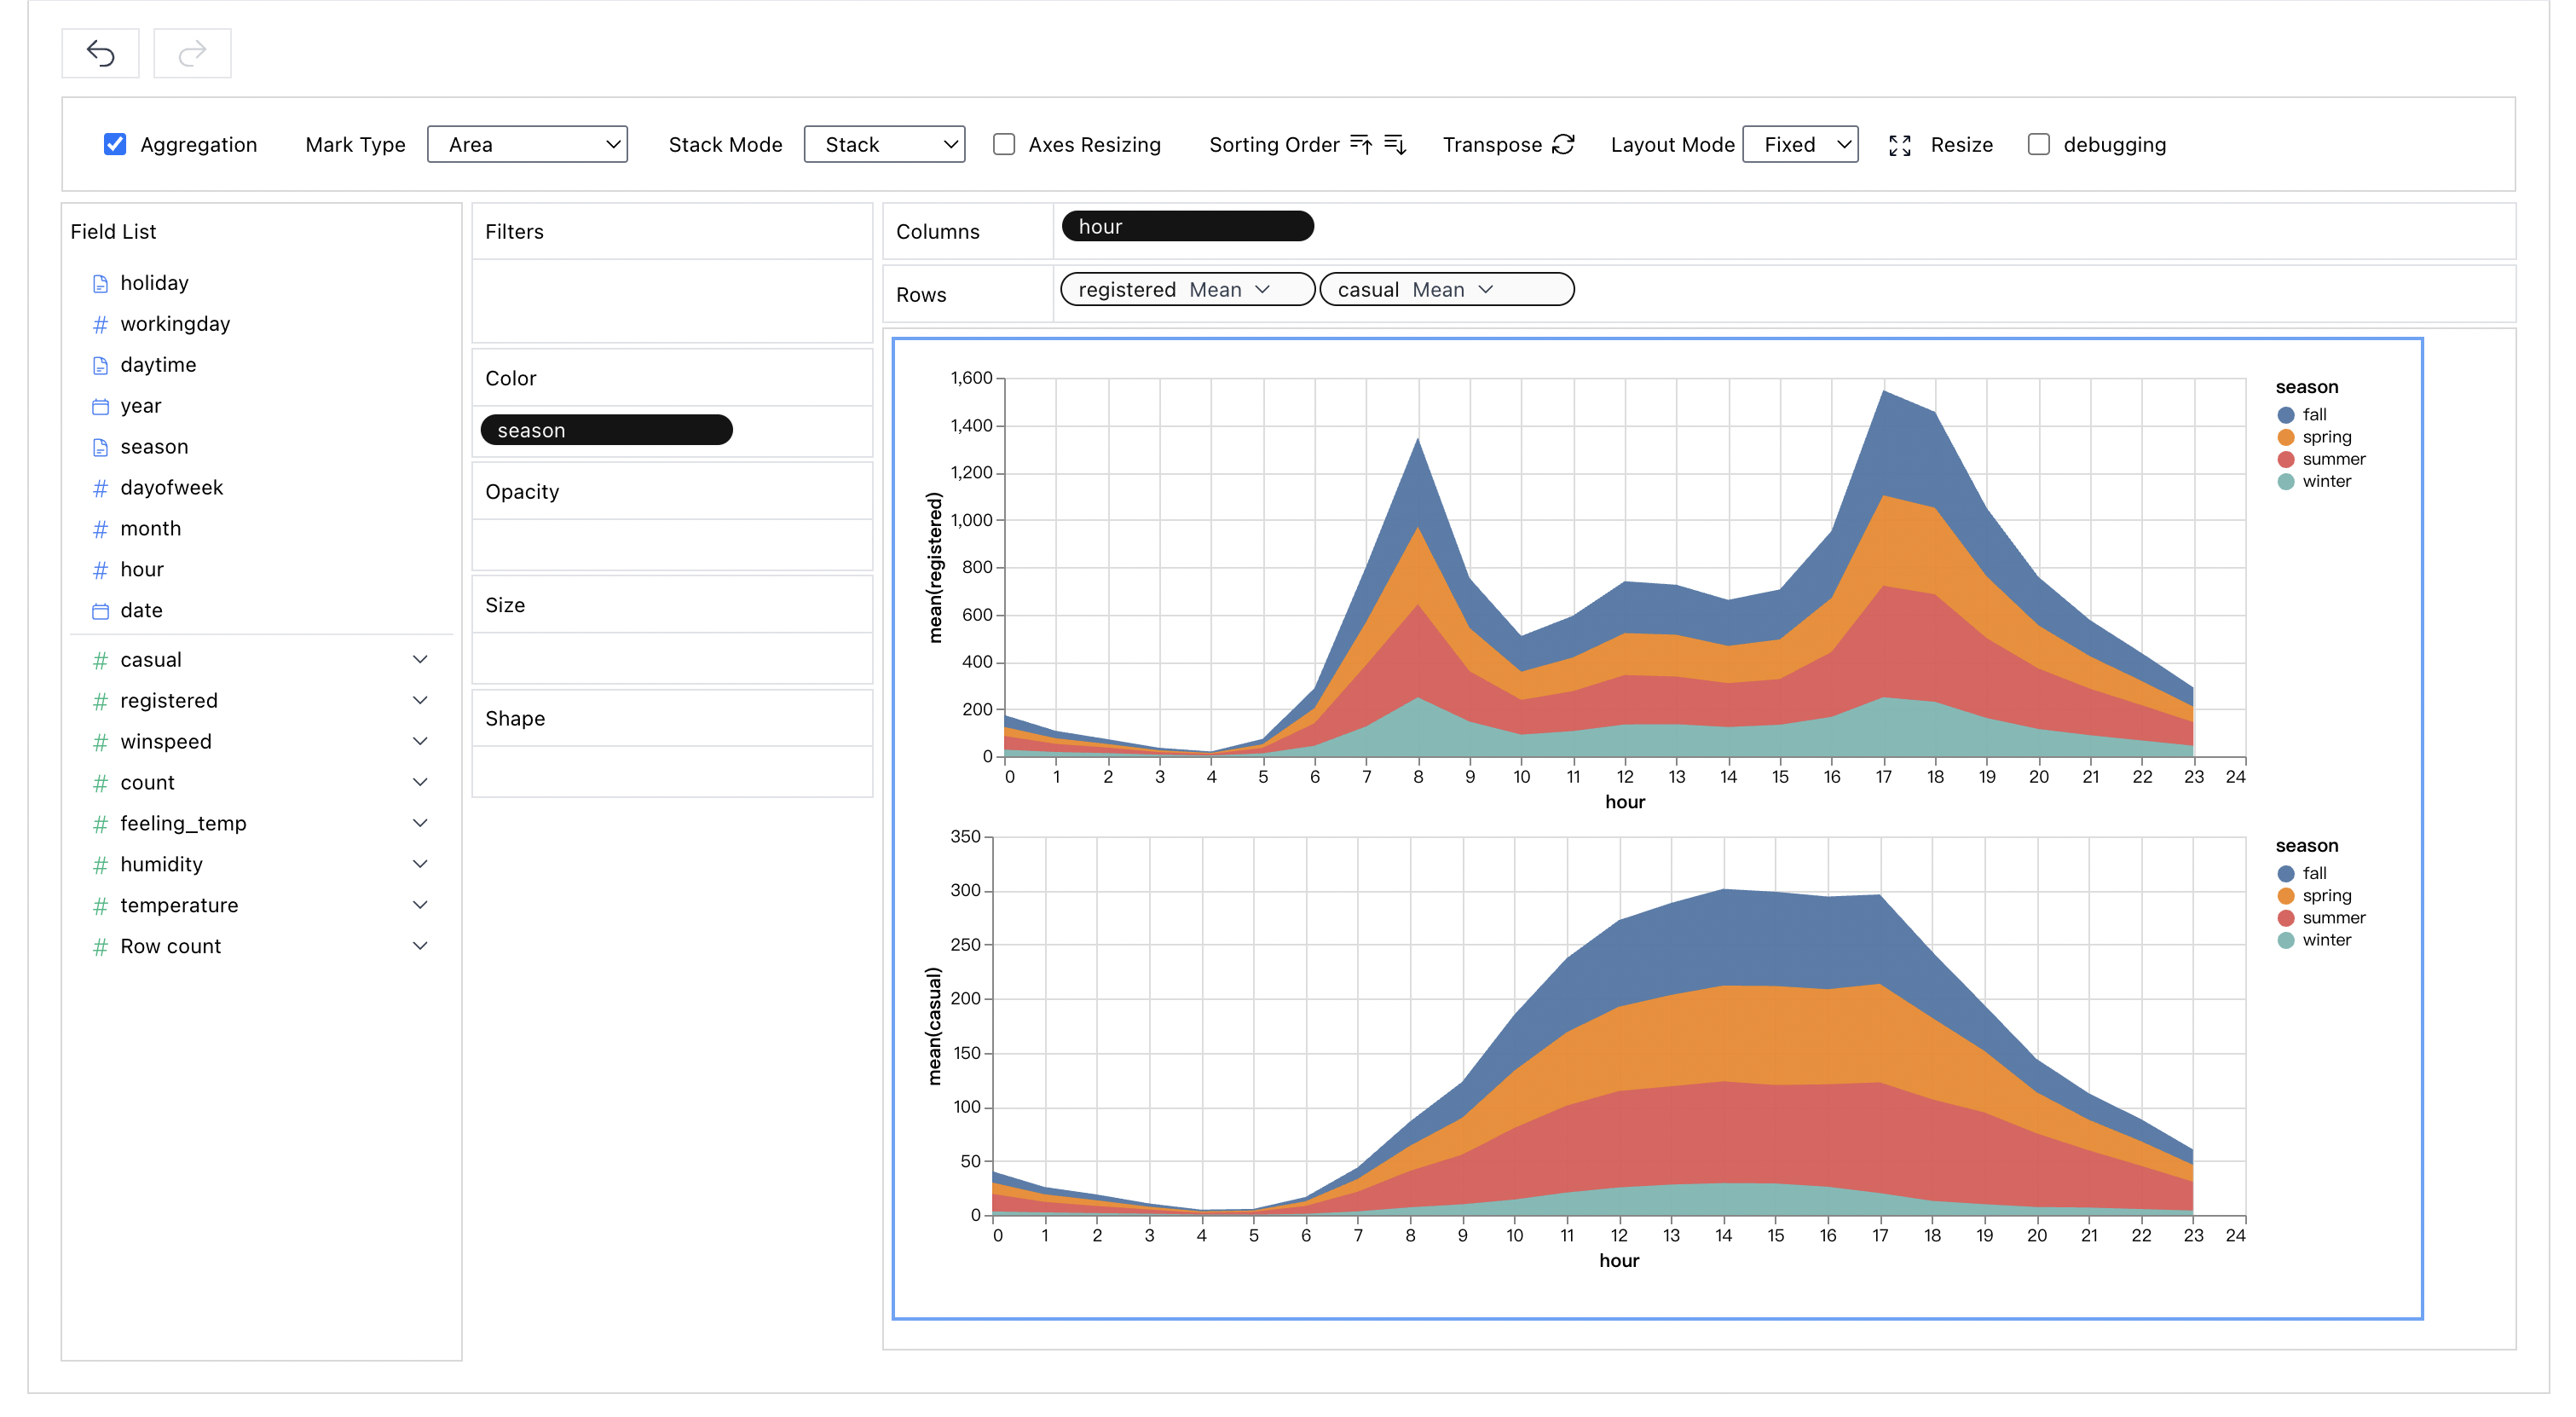
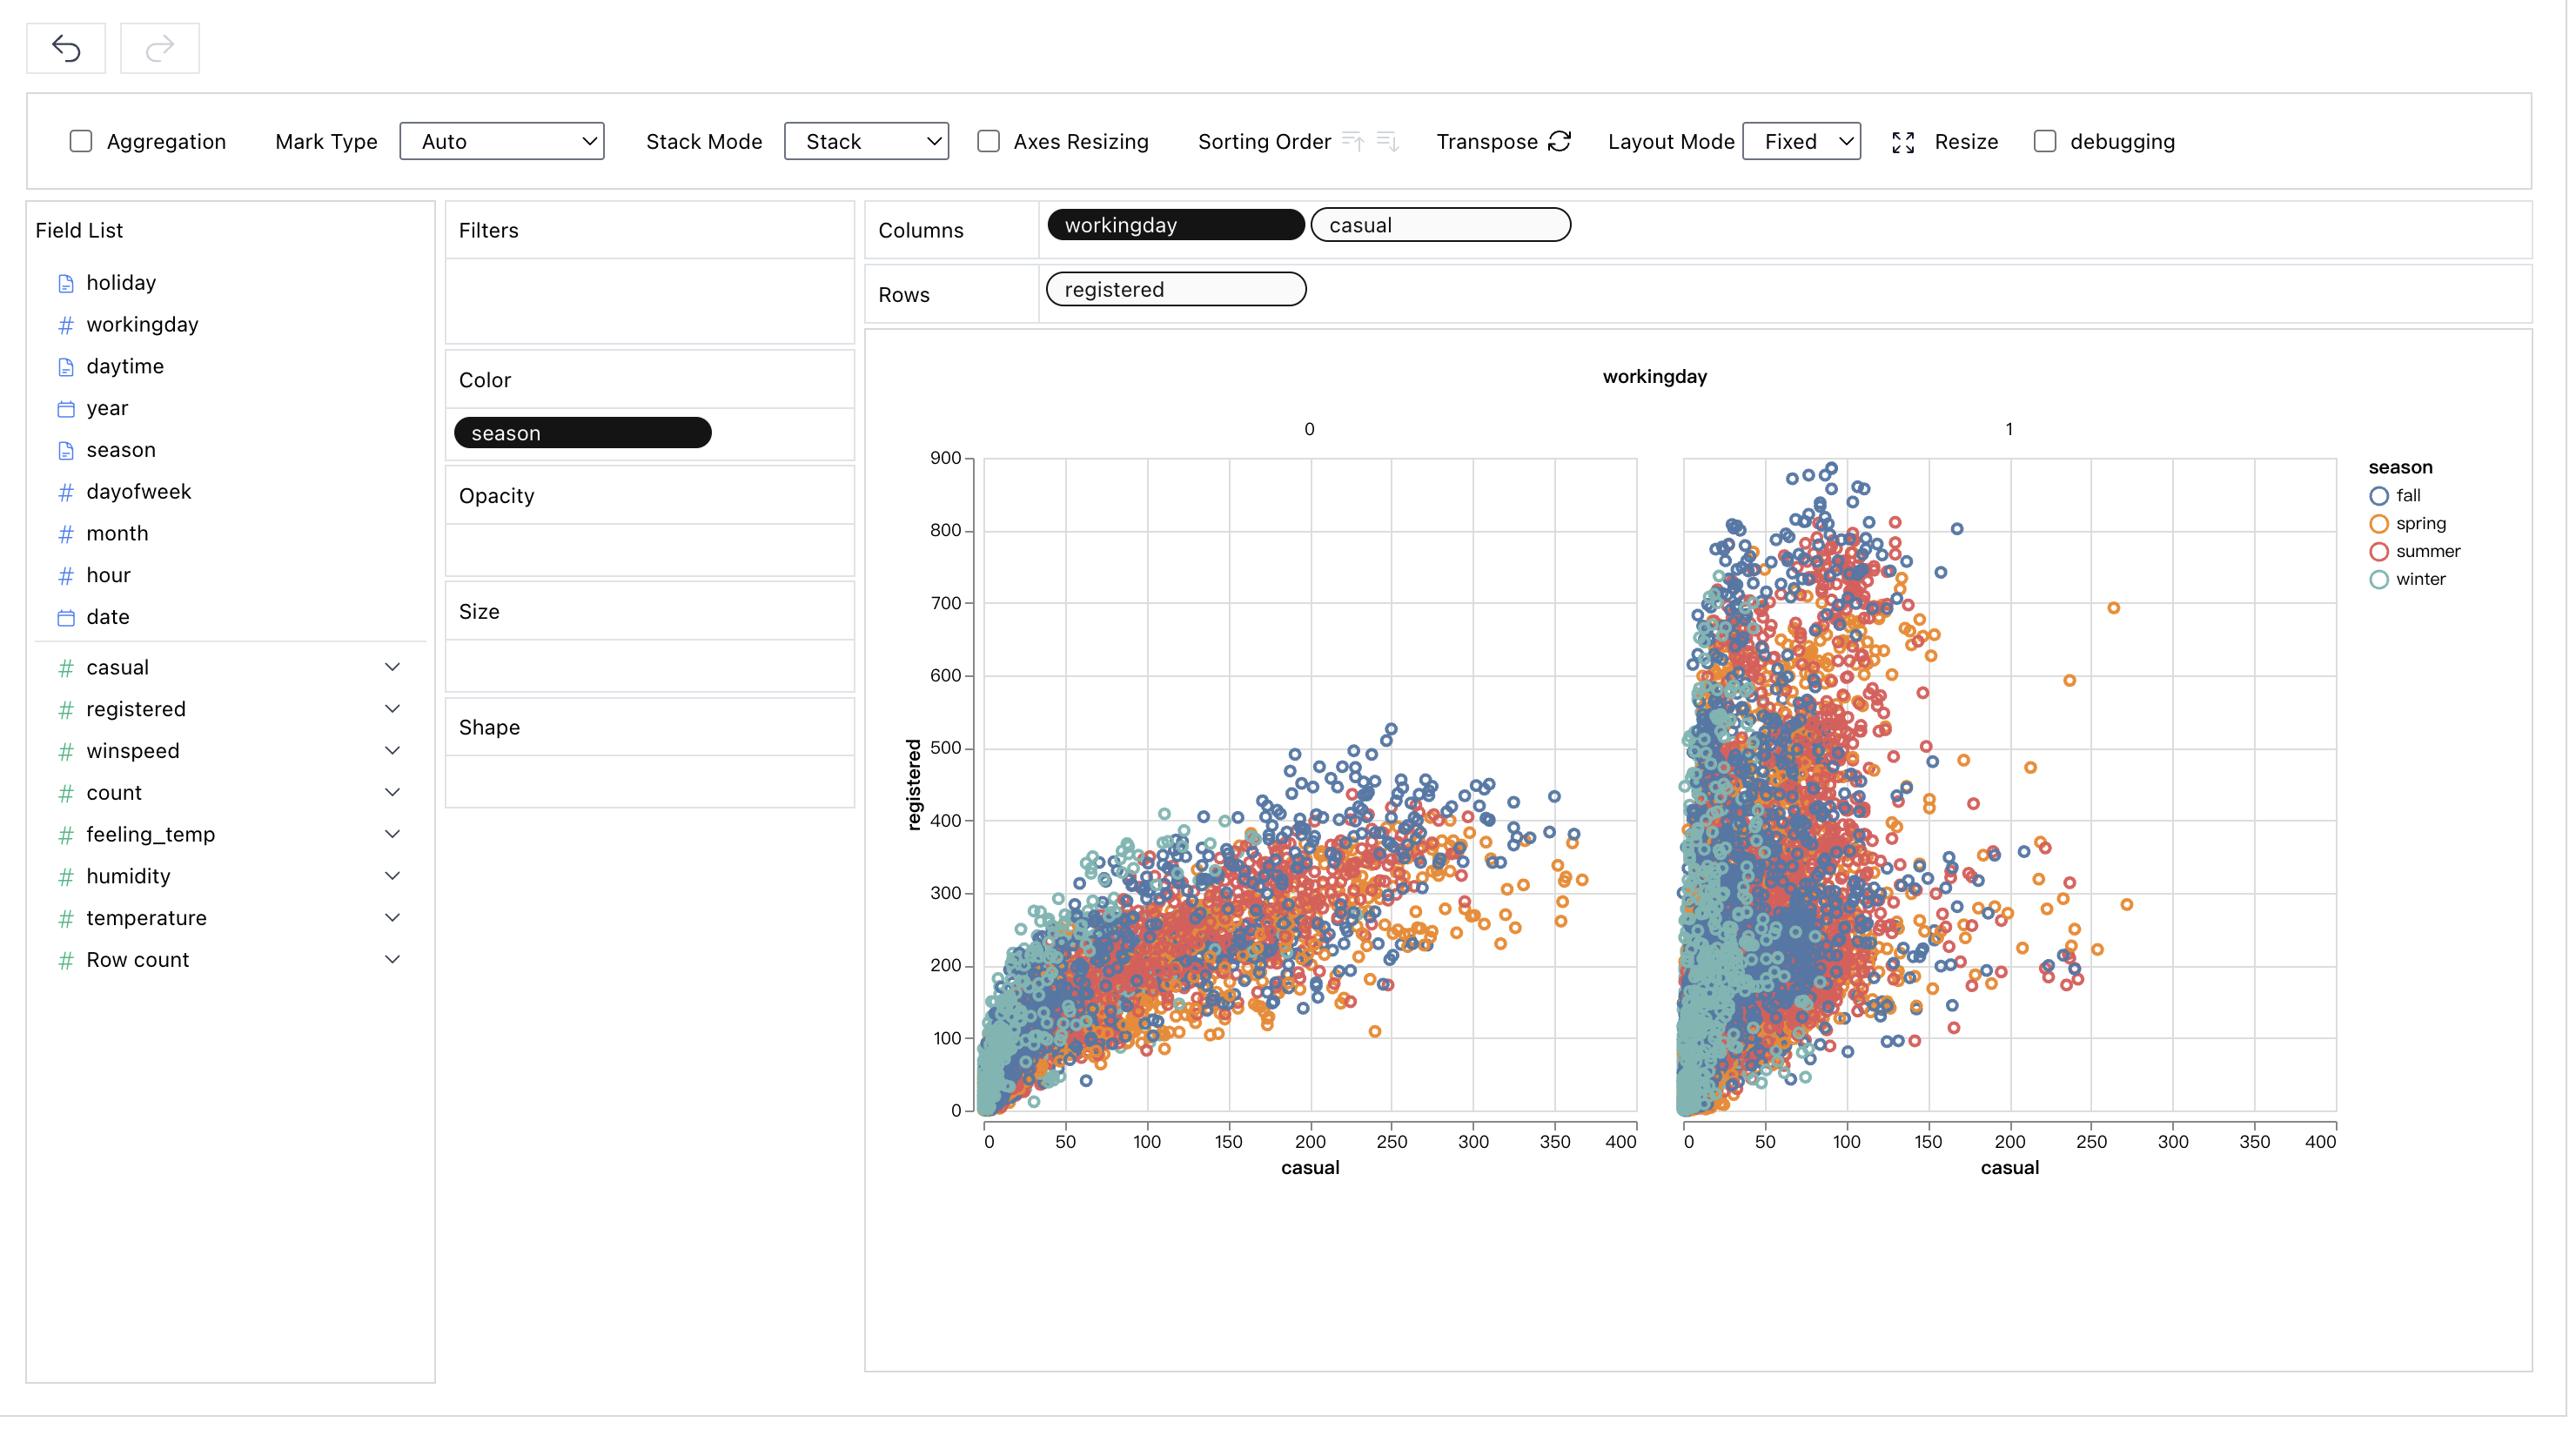
To compare different measures, you can create a concat view by adding more than one measure into rows/columns.
To make a facet view of several subviews divided by the value in dimension. Put dimensions into rows or columns to make a facets view. The rules are similar to tableau.
When you finish exploration, you can save the result into a local file, which can be imported next time.
If you want to use graphic walker as a data exploration tool without thinking about deployment details, you can use our online out-of-box version for you.
Use it here: Graphic Walker Online
yarn install

yarn workspace @kanaries/graphic-walker buildyarn add @kanaries/graphic-walker
# or
npm i --save @kanaries/graphic-walkerIn your app:
import { GraphicWalker } from '@kanaries/graphic-walker';
import 'graphic-walker/dist/style.css'

const YourEmbeddingTableauStyleApp: React.FC = props => {
    const { dataSource, fields } = props;
    return <GraphicWalker
        dataSource={dataSource}
        rawFields={fields}
        spec={graphicWalkerSpec}
        i18nLang={langStore.lang}
    />
}

export default YourEmbeddingTableauStyleApp;# packages/graphic-walker
npm run devGraphicWalker now support English (as "en" or "en-US") and Chinese (as "zh" or "zh-CN") with built-in locale resources. You can simply provide a valid string value (enumerated above) as props.i18nLang to set a language or synchronize your global i18n language with the component like the example given as follow.
const YourApp = props => {
    // ...

    const curLang = /* get your i18n language */;

    return <GraphicWalker
        dataSource={dataSource}
        rawFields={fields}
        i18nLang={curLang}
    />
}If you need i18n support to cover languages not supported currently, or to totally rewrite the content of any built-in resource(s), you can also provide your resource(s) as props.i18nResources to GraphicWalker like this.
const yourResources = {
    'de-DE': {
        'key': 'value',
        ...
    },
    'fr-FR': {
        ...
    },
};

const YourApp = props => {
    // ...

    const curLang = /* get your i18n language */;

    return <GraphicWalker
        dataSource={dataSource}
        rawFields={fields}
        i18nLang={curLang}
        i18nResources={yourResources}
    />
}
GraphicWalker uses react-i18next to support i18n, which is based on i18next, so your translation resources should follow this format. You can simply fork and edit /locales/en-US.json to start your translation.
Graphic Walker is basically manual data exploration software. When facing more complex datasets, manual exploration can cost a lot of time, Rath is software providing a different data analysis experience with automation enhancement.


