Giter VIP home page Giter VIP logo

ramezissac / django-slick-reporting Goto Github PK

View Code? Open in Web Editor NEW
425.0 18.0 37.0 942 KB

Reporting engine for Django, Create dashboards, reports and charts effectively and effortlessly.

Home Page: https://django-slick-reporting.com/

License: BSD 3-Clause "New" or "Revised" License

Python 77.15% HTML 9.92% JavaScript 12.93%
python django charting analysis easy-to-use customisable analytics charts pivot-tables reporting time-series

django-slick-reporting's Introduction

image

image

image

image

image

Django Slick Reporting

A one stop reports engine with batteries included.

Features

  • Effortlessly create Simple, Grouped, Time series and Crosstab reports in a handful of code lines.
  • Create Chart(s) for your reports with a single line of code.
  • Create Custom complex Calculation.
  • Optimized for speed.
  • Easily extendable.

Installation

Use the package manager pip to install django-slick-reporting.

pip install django-slick-reporting

Usage

So we have a model SalesTransaction which contains typical data about a sale. We can extract different kinds of information for that model.

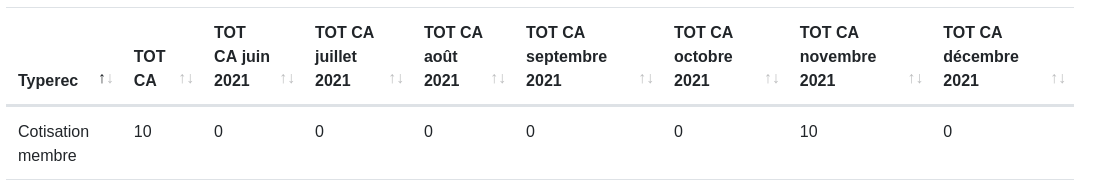
Let's start by a "Group by" report. This will generate a report how much quantity and value was each product sold within a certain time.

# in views.py
from django.db.models import Sum
from slick_reporting.views import ReportView, Chart
from slick_reporting.fields import ComputationField
from .models import MySalesItems


class TotalProductSales(ReportView):
    report_model = SalesTransaction
    date_field = "date"
    group_by = "product"
    columns = [
        "name",
        ComputationField.create(
            Sum, "quantity", verbose_name="Total quantity sold", is_summable=False
        ),
        ComputationField.create(
            Sum, "value", name="sum__value", verbose_name="Total Value sold $"
        ),
    ]

    chart_settings = [
        Chart(
            "Total sold $",
            Chart.BAR,
            data_source=["sum__value"],
            title_source=["name"],
        ),
        Chart(
            "Total sold $ [PIE]",
            Chart.PIE,
            data_source=["sum__value"],
            title_source=["name"],
        ),
    ]


# then, in urls.py
path("total-sales-report", TotalProductSales.as_view())

With this code, you will get something like this:

Shipped in View Page

Time Series

A Time series report is a report that is generated for a periods of time. The period can be daily, weekly, monthly, yearly or custom. Calculations will be performed for each period in the time series.

Example: How much was sold in value for each product monthly within a date period ?

# in views.py
from slick_reporting.views import ReportView
from slick_reporting.fields import ComputationField
from .models import SalesTransaction


class MonthlyProductSales(ReportView):
    report_model = SalesTransaction
    date_field = "date"
    group_by = "product"
    columns = ["name", "sku"]

    time_series_pattern = "monthly"
    # or "yearly" , "weekly" , "daily" , others and custom patterns
    time_series_columns = [
        ComputationField.create(
            Sum, "value", verbose_name=_("Sales Value"), name="value"
        )  # what will be calculated for each month
    ]

    chart_settings = [
        Chart(
            _("Total Sales Monthly"),
            Chart.PIE,
            data_source=["value"],
            title_source=["name"],
            plot_total=True,
        ),
        Chart(
            "Total Sales [Area chart]",
            Chart.AREA,
            data_source=["value"],
            title_source=["name"],
            plot_total=False,
        ),
    ]

Time Series Report

Cross Tab

Use crosstab reports, also known as matrix reports, to show the relationships between three or more query items. Crosstab reports show data in rows and columns with information summarized at the intersection points.

# in views.py
from slick_reporting.views import ReportView
from slick_reporting.fields import ComputationField
from .models import MySalesItems


class MyCrosstabReport(ReportView):

    crosstab_field = "client"
    crosstab_ids = [1, 2, 3]
    crosstab_columns = [
        ComputationField.create(Sum, "value", verbose_name=_("Value for")),
    ]
    crosstab_compute_remainder = True

    columns = [
        "some_optional_field",
        # You can customize where the crosstab columns are displayed in relation to the other columns
        "__crosstab__",
        # This is the same as the Same as the calculation in the crosstab, but this one will be on the whole set. IE total value
        ComputationField.create(Sum, "value", verbose_name=_("Total Value")),
    ]

Homepage

Low level

The view is a wrapper over the ReportGenerator class, which is the core of the reporting engine. You can interact with the ReportGenerator using same syntax as used with the ReportView .

from slick_reporting.generator import ReportGenerator
from .models import MySalesModel


class MyReport(ReportGenerator):
    report_model = MySalesModel
    group_by = "product"
    columns = ["title", "__total__"]


# OR
my_report = ReportGenerator(
    report_model=MySalesModel, group_by="product", columns=["title", "__total__"]
)
my_report.get_report_data()  # -> [{'title':'Product 1', '__total__: 56}, {'title':'Product 2', '__total__: 43}, ]

This is just a scratch of what you can do and customize.

Demo site

Available on Django Slick Reporting

You can also use locally

# clone the repo
git clone https://github.com/ra-systems/django-slick-reporting.git
# create a virtual environment and activate it
python -m venv /path/to/new/virtual/environment
source /path/to/new/virtual/environment/bin/activate

cd django-slick-reporting/demo_proj
pip install -r requirements.txt
python manage.py migrate
python manage.py create_entries
python manage.py runserver

the create_entries command will generate data for the demo app

Documentation

Available on Read The Docs

You can run documentation locally

<activate your virtual environment>
cd docs
pip install -r requirements.txt
sphinx-build -b html source build

Road Ahead

  • Continue on enriching the demo project
  • Add the dashboard capabilities

Running tests

Create a virtual environment (maybe with virtual slick_reports_test), activate it; Then ,

$ git clone [email protected]:ra-systems/django-slick-reporting.git
$ cd tests
$ python -m pip install -e ..

$ python runtests.py
#     Or for Coverage report
$ coverage run --include=../* runtests.py [-k]
$ coverage html

Support & Contributing

Please consider star the project to keep an eye on it. Your PRs, reviews are most welcome and needed.

We honor the well formulated Django's guidelines to serve as contribution guide here too.

Authors

Cross Reference

If you like this package, chances are you may like those packages too!

Django Tabular Permissions Display Django permissions in a HTML table that is translatable and easy customized.

Django ERP Framework A framework to build business solutions with ease.

If you find this project useful or promising , You can support us by a github โญ

django-slick-reporting's People

Contributors

dmytrolitvinov avatar gr4n0t4 avatar ilovetux avatar jrutila avatar mswastik avatar piotriw avatar ramezissac avatar squio avatar srijwalzartek avatar turnrdev avatar wadewilliams avatar zerotask avatar

Stargazers

 avatar  avatar  avatar  avatar  avatar  avatar  avatar  avatar  avatar  avatar  avatar  avatar  avatar  avatar  avatar  avatar  avatar  avatar  avatar  avatar  avatar  avatar  avatar  avatar  avatar  avatar  avatar  avatar  avatar  avatar  avatar  avatar  avatar  avatar  avatar  avatar  avatar  avatar  avatar  avatar  avatar  avatar  avatar  avatar  avatar  avatar  avatar  avatar  avatar  avatar  avatar  avatar  avatar  avatar  avatar  avatar  avatar  avatar  avatar  avatar  avatar  avatar  avatar  avatar  avatar  avatar  avatar  avatar  avatar  avatar  avatar  avatar  avatar  avatar  avatar  avatar  avatar  avatar  avatar  avatar  avatar  avatar  avatar  avatar  avatar  avatar  avatar  avatar  avatar  avatar  avatar  avatar  avatar  avatar  avatar  avatar  avatar  avatar  avatar  avatar

Watchers

 avatar  avatar  avatar  avatar  avatar  avatar  avatar  avatar  avatar  avatar  avatar  avatar  avatar  avatar  avatar  avatar  avatar  avatar

django-slick-reporting's Issues

pip install django_slick_reporting gets outdated commit

I'm using pip install django_slick_reportng==0.6.2 but pip is not bringing the latest commit "Upgrade in is_ajax check" (so I keep having an error from this ajax check). Am I using pip in a wrong way or does pip takes some time (or action) until this latest commit is incorporated?

An observation: I've noticed the commit "Version 0.6.2" was merged before this "Upgrade in is_ajax check" commit. Maybe I'm wrong but it might indicate a need for a new version for this change to take action on pip install

Multiple unrelated report models?

I need to make a dashboard that has some general data just as an overview. Even though we can declare multiple charts, it looks like we aren't able to include more than one model in one single view. We can use cross tab but the models have to be related in that scenario and, while that is a useful thing, it's not something I can do for this use case scenario.

Am I overlooking something or is there really no way to have it make multiple reports for one view?
If this isn't a thing yet, I can try to submit a PR when I have the time to work on it.

Thanks for making the package, it's very useful!

if a group_by is active, then the value of columns are empty

Hi.
If my report settings is:
report = ReportGenerator(report_model=Price,
date_field='date',
group_by='product_id',
columns=[
'product_name',
SlickReportField.create(method=Sum, field='quantity_int', name='quantity'),
],
)
I take result is:
data = report.get_report_data()
[
{
"product_name": "",
"quantity": 200
}
]
But, if:
report = ReportGenerator(report_model=Price,
date_field='date',
# group_by='product_id',
columns=[
'product_name',
SlickReportField.create(method=Sum, field='quantity_int', name='quantity'),
],
)
and result:
[
{
"product_name": "1",
"quantity": ""
}
]
So product_name is empty with group_by

Complete Demo App

It would be helpful to have a complete django project with working examples, like the ones in the demo for download so I could run it through my IDE and understand it completely. Your examples are great, I just like to see how the whole things integrates and ties together.

Can you add a full project to your docs?

Cant use SlickReportField for FloatField

i try use SlickReportView and in
columns = [
SlickReportField.create(method = Sum, field= 'balance', name='sum__balance'),
]

  • field balance is FloatField. They have error :

Exception Type: | KeyError
Exception Value: | 'balance__sum'

Screen Shot 2021-01-14 at 18 28 38

Calculate some value, for an interval of time to determine

Hello,
I have an issue in the calculator of value, for an interval of time.
Capture dโ€™รฉcran de 2021-12-09 22-08-52
Capture dโ€™รฉcran de 2021-12-09 22-17-03

the problem is in the 01 of each month, always it is calculates with the previous month
see photos attached for example 12/01/202, is calculated with the month of November
Thanks

group_by in SampleReportView

Sample report view works if you do noting other than list the model you are reporting on, once you have altered the model by adding the doc_date field. If you try to do any thing useful like grouping on a foreign key as shown in the documentation, it starts falling apart.

So, if I have a two models a and b and b has a foreign key relation to a then if I want to group data in b based on the key in a, all the fields in b can no longer be found and are flagged up as not found. The only way to render the template, is to remove all the fields from b and to replace them with fields from a. At this point you no longer have the report you wanted.

Furthermore, none of the filters at the top of the report actually filter the report. Upon clicking the button nothing happens to the report. The only way to get some filtering is to type something into the search field so that the results can filter what is shown.

I have sent you detailed emails about this.

simple time series chart example?

This looks like a great package, I was trying to create a simple chart, dates (time series) in the X axis and values (counts of different fields) on the Y axis and I don't seem to be able to do that easily?

Surely I am doing something wrong as this is as basic as you can get?

Labelling of bar chart

Greetings!

I am working with a dataset of pilot flight logs. I've used Django Slick Reporting to allow a report to be generated showing how much time one or more pilots have logged over a specified period of time. It works great, but the problem I'm having is illustrated below:
image

The pilot names under the bar chart are being replaced with Series 1, Series 2, ...

Below is the code I used to generate the view:

class TwelveMonthTimes(LoginRequiredMixin, SlickReportView):
    report_model = FlightDetail        
    date_field = 'date_of_flight'
    columns = ['pilot__last_name', 
                SlickReportField.create(
                    method=Sum,
                    field='total_time',
                    name='total_time__sum',
                    verbose_name=('Sum of Total Time'))
                ]
    group_by = 'pilot__last_name'

    chart_settings = [
            {
                'type': 'column',
                'data_source': ['total_time__sum'],
                'title_source': ['total_time'],
                'title': 'Total Time by Pilot',
            }
        ]

What am I missing in my code that will allow the label under the bars to reflect the pilot names?

Thanks!

Errors following through the Quickstart example

Hello folks,

I am following the example provided in the quickstart guide and hit some syntax errors straight away. Has anyone else come across this?

method=Sum, field="value", name="value__sum", verbose_name=_("Total sold $")
NameError: name 'Sum' is not defined. Did you mean: 'sum'?

did I miss anything obvious?
Pycharm is showing me the following suggestions:

image

image

>>> django.VERSION
(4, 1, 6, 'final', 0)
>>> 

edit: corrected hyperlink

format_row() renders charts unusable

I use format_row() in my SlickReportViews to make my tables more readable (ie. adding commas between large numbers with django humanize intcomma and having the groupby fields refer to their name field within their respective models, etc.), but this prevents the chart from displaying the labels correctly (in the case of referring to the groupby fields' names instead of IDs) or picking up the data entirely (when formatting numbers with intcomma). Please advise (code below for reference.

image

Group by custom querysets not working

django-slick-reporting==1.0.1

Following the example in https://django-slick-reporting.readthedocs.io/en/latest/topics/group_by_report.html#group-by-custom-querysets, got the following error:

  File "stats.py", line 275, in <module>
    class VisitSplit(ReportView):
  File "local/lib/python3.8/site-packages/slick_reporting/views.py", line 419, in __init_subclass__
    cls.report_generator_class.check_columns(
  File "local/lib/python3.8/site-packages/slick_reporting/generator.py", line 722, in check_columns
    raise FieldDoesNotExist(
django.core.exceptions.FieldDoesNotExist: Field "__index__" not found either as an attribute to the generator class <class 'slick_reporting.generator.ReportGenerator'>, Container class <class 'clinic.analytics.stats.VisitSplit'>,or a computation field, or a database column for the model "<class 'clinic.models.Visit'>"

I notice that while initializing the subclass in cls.report_generator_class.check_columns no group_by_custom_querysets is passed whereas it is passed in _parse. Thus the check_columns fail for "__index__"

So the __init_subclass__ needs to be suitably modified.

I am suggesting a more elegant alternative to Group by custom querysets. Instead of adding a new construct, allow reports on querysets with annotation and group by columns to include annotation columns. This way the entire power of django querysets and DB will be available to django-slick-reporting, with all the heavy lifting done by DB and django, and formatting, graphing and filtering part to be done by django-slick-reporting.

django tempaltes

you need to add on readme file how to use the package on django tempalte because i now know how to use it but how to get the report on template im stack it on that

default rows to show in report

I've spent some time combing through the docs, but I don't see where I can set the default number of rows to show when creating a DataTable. It always defaults to 10 rows. I saw the limit_rows attribute, but that just limits the number of rows in total, not what I'm looking for.

Just want to show 25 at a time and paginate....

Feature: add download report button csv or pdf file

So am building a report system for a client and he wants to be able to download csv and PDF files for the report model and also want to download it by filtering the dates he wants

I've been trying to override the slick reporting but i don't know how

Calculate cumulative sum

Hey,

I'm using django-slick-reporting to render graphs, particularly the ReportGenerator class so that I can send the graph data as a json and then render a graph on the frontend.

I'm trying to render a graph that shows the cumulative value for a particular field. (The red line graph from the below image)

cumulative_graph

How can we calculate the cumulative value using django-slick-reporting?

Thanks

Datetime to date casting in group_by?

Hi,

I'm trying to build a simple report showing a count of Users grouped by date_joined but at a daily level. I need to cast date_joined from a datetime to a date first, but all the routes I've tried aren't working:

  • date_joined__date errors out in slick reports because it thinks it's a relation instead of a Django function
  • TruncDate I can't get working, because I can't have an empty columns field and referencing it in columns gets the error 'django.core.exceptions.FieldDoesNotExist: Field "date_joined_date" not found either as an attribute to the generator class <class 'slick_reporting.generator.ReportGenerator'>, Container class <class 'analytics.views.NewUsersReportView'>,or a computation field, or a database column for the model "<class 'core.models.models_user.User'>"'
  • Trying to use a SlickReportField as the column for the TruncDate above also fails because it expects a method.

It feels like I'm making this far more complex than it should be, so was hoping for some expert guidance please :)

Two options I've been trying are below. I was hoping the first would work as I prefer the simplicity.

class NewUsersReportView(SlickReportView):
    report_model = User
    group_by = 'date_joined__date'
    date_field = 'date_joined'

    columns = [
        "date_joined__date",
        SlickReportField.create(method=Count, field='id', name='count_users', verbose_name='Users')
    ]

    chart_settings = [{
        'type': 'column',
        'data_source': ['count_users'],
        'title_source': 'date_joined_date',
        'title': 'Date Joined',
    }, ]
class NewUsersReportView(SlickReportView):
    report_model = User
    date_field = 'date_joined'

    columns = [
        "date_joined_date",
        SlickReportField.create(method=Count, field='id', name='count_users', verbose_name='Users')
    ]

    chart_settings = [{
        'type': 'column',
        'data_source': ['count_users'],
        'title_source': 'date_joined_date',
        'title': 'Date Joined',
    }, ]

    def get_data(self):
        queryset = self.get_queryset()
        queryset = queryset.annotate(date_joined_date=TruncDate('date_joined'))
        queryset = queryset.values('date_joined_date').annotate(count=Count('id'))
        queryset = queryset.order_by('date_joined_date')
        return queryset

Clarity on django-erp-framework dependency

Three assets report a 404 error when loading a report view preventing charts from functioning:

/static/erp_framework/js/erp_framework.js
/static/erp_framework/js/erp_framework.report_loader.js
/static/erp_framework/js/erp_framework.datatable.js

Does this library rely on @RamezIssac/django-erp-framework?

In ra.chartsjs.js: calculateTotalOnObjectArray is undefined

Version: 0.4.0 release

Line 85:

  let results = calculateTotalOnObjectArray(response.data, seriesColNames);

Console.log output:

Uncaught ReferenceError: calculateTotalOnObjectArray is not defined
    extractDataFromResponse http://localhost/static/slick_reporting/ra.chartsjs.js:85
    createChartObject http://localhost/static/slick_reporting/ra.chartsjs.js:19
    DisplayChart http://localhost/dashboard/sessions/:241
    <anonymous> http://localhost/dashboard/sessions/:232
    jQuery 7
    <anonymous> http://localhost/dashboard/sessions:235

The result is that there is no graph rendered at all.

How to use SlickReportField.prepare?

Confused by the documentation here.

I want a column that filters on my model by a certain field value:

SlickReportField.prepare('some_model_field=somevalue')

Where do I put this and how do I tell my Sum field to use this prepare method?

Overriding the form

Hello,

The documentation on overriding the form is pretty scarce. Specifically, I'm trying to figure out how to override the form to allow me to choose the filter options. The default behavior of filtering off all the Foreign Keys provides filtering options that don't make sense for my application.

Thank you!

Add checks against in-complete attributes

Example(s):

  1. Not having columns would mess the flow / raise error on report display
  2. Having crosstab_columns without the crosstab_model will also mess the flow / raise error on report display

NameError: name 'SlickReportField' is not defined

I have read the documentation and followed the tutorials. I cannot find my answer.

'slick_reporting' is in installed_apps, I am importing the class correctly, but im still getting the error that it is not defined.

thank you

Issue with simple `group_by` view

Hello, I have the following SlickReportingView which works well :

REPORT_NAME = 'report_sales_order_test'

class EmbeddedSalesOrderReportView(SlickReportView):
    name = f"{REPORT_NAME}_embedded"

    template_name = 'admin/report/slick_reporting/simple_report.html'

    report_model = get_order_model()

    date_field = 'issue_datetime'

    excluded_fields = ['payments']

    columns = [
        'customer__company_name',
        '_total_without_taxes'
    ]

and give me the following results (the _total_without_taxes column is showing values, which is the expected behaviour) :

Screenshot 2022-12-24 at 15 21 05

But, once I add a group_by property like this :

class EmbeddedSalesOrderReportView(SlickReportView):
    name = f"{REPORT_NAME}_embedded"

    template_name = 'admin/report/slick_reporting/simple_report.html'

    report_model = get_order_model()

    date_field = 'issue_datetime'

    group_by = 'customer'  # HERE

    excluded_fields = ['payments']

    columns = [
        'company_name',
        SlickReportField.create(  # AND HERE
            Sum,
            '_total_without_taxes',
            name='total_without_taxes',
            verbose_name=_('Total without taxes')
        )
    ]

The resulting value of the aggregation field _total_without_taxes is always zero (see 2nd screenshot) but it's wrong since, as shown on the 1st screenshot, the model instances stored in the database have values for _total_without_taxes field that are greater than zero.

Screenshot 2022-12-24 at 15 30 22

@RamezIssac Could you help me with that ?

Thanks

i18n

Is it possible to introduce i18n ourselves while using this library? If so, is it possible to have some pointers on how to achieve it? I would gladly update your documentation afterward with an how-to. Thank you

Search will not work for Foreign Key fields with "to_field" attribute set.

I am building a complex app with many Foreign Key fields on a particular model that I'm reporting on. All of the filter/search features work, EXCEPT in one instance, where I have the "to_field" set to make the rest of the system work correctly. It just returns nothing found, no errors, etc...

Is this a known issue? Here is the some code.

class Architect(models.Model): """ A lookup table for CX Enterprise Architects, used mostly for reporting purposes. Associated with Initiatives and Features. """ id = models.AutoField(primary_key=True) name = models.CharField(max_length=60, verbose_name="Lead Architect", null=False, unique=True, blank=False, db_index=True)

class Initiative(models.Model): id = models.AutoField(primary_key=True)
null=True)
cx_pem = models.ForeignKey(ProjectEngineeringManager, on_delete=models.DO_NOTHING,
verbose_name="CX PEM:", null=True,
blank=True
architect = models.ForeignKey(Architect, on_delete=models.DO_NOTHING,
verbose_name="CX Architect:", null=True, blank=True,
to_field="name"

Note that the "architect" field has "to_field" set None of the my other models needed this.

Group by ManyToManyField

I go an error when I put in the view group_by=many_to_many_field as the field is not listed in class.meta.fields, however is listed in class.meta_get_fields()

Django 4.0 compatibility

Django 4.0 beta is released and this release removes a few deprecated features.

  • Utility force_text was removed in favor of force_str
  • Utility ugettext_lazy was removed in favor of gettext_lazy
ImportError raised when trying to load 'slick_reporting.templatetags.slick_reporting_tags': 
  cannot import name 'force_text' from 'django.utils.encoding' (.../django/utils/encoding.py)

TemplateDoesNotExist: slick_reporting/simple_report.html with Pipenv install

๐Ÿ‘‹ Hey all,

Getting the above error when doing a Pipenv install. Looks like I am using version 0.5.0.
I am not sure where the slick_reporting templates are supposed to be in my project, but I do see them in my site_packages folder

$ tree lib/python3.9/site-packages/slick_reporting/templates
lib/python3.9/site-packages/slick_reporting/templates
โ””โ”€โ”€ slick_reporting
    โ”œโ”€โ”€ base.html
    โ”œโ”€โ”€ simple_report.html
    โ””โ”€โ”€ table.html

Would copying the slick_reporting folder into my local templates be a quick workaround?

Model's Meta ordering field added when using group_by

Use case: simple report for model grouped by one to many foreign key related model as in the Group By Report example.

Code example; Groups have many Sessions through a ForeignKey relation in Session.

Session:

class Session(model.Model):

    group = models.ForeignKey(
        'my_app.Group',
        blank=True, null=True,
        on_delete=models.PROTECT)
    start_time = models.FloatField(
        null=True, verbose_name=_('Start time'), db_index=True)
    created_at = models.DateTimeField(
        null=True, verbose_name=_('Created at'))

    # ...
    class Meta:
        db_table = 'myapp_session'
        ordering = ['-start_time']

In my reports configuration:

class TotalSessions(SlickReportView):
    """ Sessions per group """

    report_model = Session
    date_field = 'created_at'
    group_by = 'group'
    columns = [
        'name',
        SlickReportField.create(Sum, 'distance', name='sum__distance'),
        SlickReportField.create(Sum, 'duration', name='sum__duration'),
    ]

Now my reports don't show the correct aggregate data but rather just the values for one group session.

The generated SQL from the debugger shows why: the field start_time from Session._meta['ordering'] is added to the group_by clause:

SELECT `myapp_session`.`group_id`,
       SUM(`myapp_session`.`distance`) AS `distance__sum`
  FROM `myapp_session`
 WHERE (`myapp_session`.`created_at` > '2019-12-31 23:00:00' AND `myapp_session`.`created_at` <= '2020-12-31 23:00:00')
 GROUP BY `myapp_session`.`group_id`,
       `myapp_session`.`start_time`

Removing the field ordering in Session class Meta removes the extra group_by field from the SQL query and gives the correct results.

I'm not sure where to look for this issue, the word 'ordering' does not occur in the django-slick-reporting source anywhere!?

Feature: add download report button csv or pdf file

So am building a report system for a client and he wants to be able to download csv and PDF files for the report model and also want to download it by filtering the dates he wants

I've been trying to override the slick reporting but i don't know how

Printing Report

Hello,

How do you print the report generated by django-slick-reporting? I don't see a print button on the generated report or do I have to improvise?

Best regards.

nested categories

I am using in django the following models.py:

class Expense(models.Model):
    name = models.CharField(max_length=50)
    date = models.DateField(unique=False, blank=False)
    slug = models.SlugField(unique=True, null=True, default='')
    price = models.DecimalField(default=0.0, blank=True, max_digits = 20, decimal_places = 2)
    category    = models.ForeignKey(
        'Category',
        related_name="Expense",
        on_delete=models.CASCADE
    )
    account = models.ForeignKey(Account, on_delete=models.CASCADE, verbose_name=u"Account", help_text=u"account")

def __str__(self):
    return '{},{},{}'.format(self.name, self.date, self.price)

def save(self, *args, **kwargs):
    self.slug = slugify(self.name)
    super(Expense,self).save(*args, **kwargs)

def get_absolute_url(self):
    return self.slug

class Category(MPTTModel):
    name = models.CharField(max_length=200)
    slug = models.SlugField(unique=True, null=True, default='')
    parent = TreeForeignKey(
        'self',
        blank=True,
        null=True,
        related_name='child',
        on_delete=models.CASCADE
    )
class Meta:
    unique_together = ('slug', 'parent',)
    verbose_name_plural = "categories"

def __str__(self):
    full_path = [self.name]
    k = self.parent
    while k is not None:
        full_path.append(k.name)
        k = k.parent

    return ' -> '.join(full_path[::-1])

The TreeForeignKey allows me to define nested categories, such as Home -> Electricity and so on.
I am using the following Slick Report view.py:

class TotalExpenses(SlickReportView):

report_model = Expense
date_field = 'date'
group_by = 'category'
columns = ['name', SlickReportField.create(method=Sum, field='price', name='price__sum', verbose_name=('Total category $'))]

charts_settings = [
 {
    'type': 'bar',
    'data_source': 'price__sum',
    'title_source': 'name',
 },
]

It works but I would like to sum only level 1 categories. Do you know how this might be possible?

New release?

Hi,

any chance of getting a new release with the group by foreign key fields fix (#28) included?

How to get full name on related object in column

Hello,

I'm attempting to pull the full name of a user who created an instance into a column.

For example, in views.py:

columns = ['service_date',
               'created_by',
               'created_by__first_name',
               'created_by__get_full_name'
                ]

In the code above, "created_by" is defined in models.py like this:
created_by = models.ForeignKey(User, on_delete=models.RESTRICT)

If I use the columns listed above...

  • "created_by" column just shows the ID of the user who created the instance, but not the name - unsuccessful
  • "created_by__first_name" column shows the first name - successful
  • "created_by__get_full_name" (or other variations of it) gives the error:

django.core.exceptions.FieldDoesNotExist: Field "created_by__get_full_name" not found either as an attribute to the generator class <class 'slick_reporting.generator.ReportGenerator'>, or a computation field, or a database column for the model "<class 'clients.models.MyModel'>"

So, I'm wondering how to display the full name of a user in the report.

I'm a Django newbie, so I've experimented with several "creative" solutions:

  • tried concatenating first_name and last_name: 'created_by__first_name' + 'created_by__last_name' - unsuccessful
  • tried creating a "dummy" column name and then formatting it later with: def format_row(self, row_obj): - unsuccessful

This all came about because I ultimately wanted to use the django-simple-history module to access the user's name like this:

columns = ['service_date',
               'history.first.history_user.get_full_name'
                ]

But that definitely didn't work. So, I dialed it back to creating a "created_by" field on my MyModel (see above) and trying to access the standard User object, but this doesn't appear to work either.

What am I missing, or is this just not possible with the currently functionality?

Thank you for any feedback!

aggregation, totals etc..

Settling for a simple totals report, i tried using the total_field as shown in the documentation, but this also fails.

Field "total_field" not found as an attribute to the generator class, nor as computation field, nor as a database column for the model "modelname"

is what i get. It would seem that it treats the whole thing as a field rather than a function.

Given the above i have not tried the other functions of slick_reporting, such as crosstab etc.. You have asked me to post the issues here in order to expedite its resolution.

Incorporating report within a django template

Hi,

Thank you for your great work. I had a question.

I am using your report and rendering it with a class-based view as stated in the example in demo website (simple filter). The report looks great.

I already have a website and I am looking to incorporate your report within that website. My website has a header and footer so I want the report to be displayed between the headers and footer. Can I add a django template code like {% extends 'base.html' %} somewhere in SlickReportView class or can I display the report within {% block content %} {% endblock %} or is there a way to render the report inside my already defined Django template?

Example using user last_login

As a proof of concept, I'd like to see a chart for daily users who logged in. I can get a report of users who logged in during a month easily enough, but displaying a chart is illusive based off the docs. The example in the readme doesn't match the example in the documentation. It'd be nice to have an example with something built-in like user last_login since that's universally available for Django users, without having to understand the context of a 3rd party app example with "orders"

Something like

from slick_reporting.views import SlickReportView
from django.contrib.auth import get_user_model

User = get_user_model()


class LogIns(SlickReportView):
    report_model = User
    date_field = 'last_login'

    # The columns you want to display
    columns = ['last_login']  # I'm sure this is wrong?  I want to group by day?

    time_series_pattern = 'daily'
    time_series_columns = ['__total_quantity__']  # not clear if this is a keyword that slick reporting understands or something else

    # Charts
    chart_settings = [{
        'type': 'column',
        'data_source': ['sum__value'],  # definitely wrong but not sure how to fix
        'plot_total': False,
        'title_source': 'last_login',  # seems wrong
        'title': _('Detailed Columns'),  # just an error not sure what this is 

    }, ]

doc_date

I cannot use slick-reporting without adding doc_date to my model that i wish to report on. I dont know if this is a bug or intended. It is not referred to in the documentation and this has been arrived at after hours of trying to troubleshoot why doc_date was required.

Deferred initialization for string based model names

While our app grew more complex it became necessary to break circular imports by specifying models in many to many fields as string, not fully imported model.

During app initialization this leads to the decorator @report_field_register to be called more than once which results in the error:

django.contrib.admin.sites.AlreadyRegistered: 
  The field name __total_distance__ is used before and `override` is False

Hard coding override=True leads to the following error in slick_reporting/generator.py:

line 465, in check_columns
    field = model_to_use._meta.get_field(col)
AttributeError: 'str' object has no attribute '_meta'

Following the stack trace back shows that this error originates at the point where the site's urls.py is initialized and the views classes are loaded.

I got stuck at this point...

Is there any way to initialize the reports at runtime, on demand or at least after all Django models have been initialized?

Recommend Projects

  • React photo React

    A declarative, efficient, and flexible JavaScript library for building user interfaces.

  • Vue.js photo Vue.js

    ๐Ÿ–– Vue.js is a progressive, incrementally-adoptable JavaScript framework for building UI on the web.

  • Typescript photo Typescript

    TypeScript is a superset of JavaScript that compiles to clean JavaScript output.

  • TensorFlow photo TensorFlow

    An Open Source Machine Learning Framework for Everyone

  • Django photo Django

    The Web framework for perfectionists with deadlines.

  • D3 photo D3

    Bring data to life with SVG, Canvas and HTML. ๐Ÿ“Š๐Ÿ“ˆ๐ŸŽ‰

Recommend Topics

  • javascript

    JavaScript (JS) is a lightweight interpreted programming language with first-class functions.

  • web

    Some thing interesting about web. New door for the world.

  • server

    A server is a program made to process requests and deliver data to clients.

  • Machine learning

    Machine learning is a way of modeling and interpreting data that allows a piece of software to respond intelligently.

  • Game

    Some thing interesting about game, make everyone happy.

Recommend Org

  • Facebook photo Facebook

    We are working to build community through open source technology. NB: members must have two-factor auth.

  • Microsoft photo Microsoft

    Open source projects and samples from Microsoft.

  • Google photo Google

    Google โค๏ธ Open Source for everyone.

  • D3 photo D3

    Data-Driven Documents codes.