Client-side visualisation of the barnowl-barnacles-barterer stack using AngularJS, D3js and socket.io. Currently supports four views:
- real-time RSSI chart of a single transmitter on all receivers
- real-time RSSI bar chart of all transmitters on a single receiver
- real-time table of events
- real-time location of a single transmitter on a two-dimensional grid
RSSI: Received Signal Strength Indication
Simply clone the repository and open the index.html file in your favourite web browser. Or forego installation completely and run it from reelyactive.github.io/barstool.
Barstool presents four interfaces:
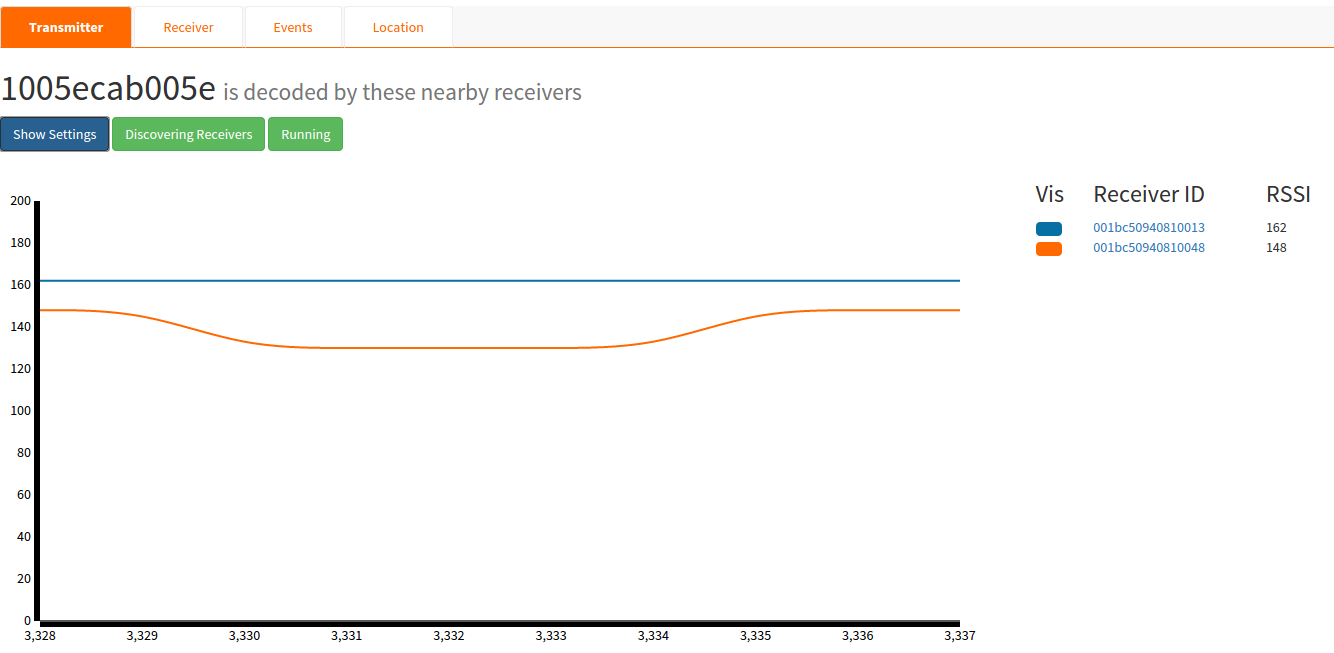
The transmitter interface visualises a single radio transmitter. The real-time RSSI on all receivers in range is displayed as a line chart.
| Setting | Description |
|---|---|
| Transmitter ID | Specifies which transmitter to observe. |
| RSSI range | Specifies the lower and upper range of the graph. |
| Samples | Specifes the number of samples to display. |
| Linear Interpolation | Draws straight line between data points. |
| Basis Interpolation | Smooths out extreme data points. |
| API root | Specifies the barterer API location, ex: http://localhost:3001. |
| Legend option | Description |
|---|---|
| Display receiver | Click the coloured button to hide/show that receiver. |
| Receiver ID | Click the ID to jump to the corresponding Receiver Interface. |
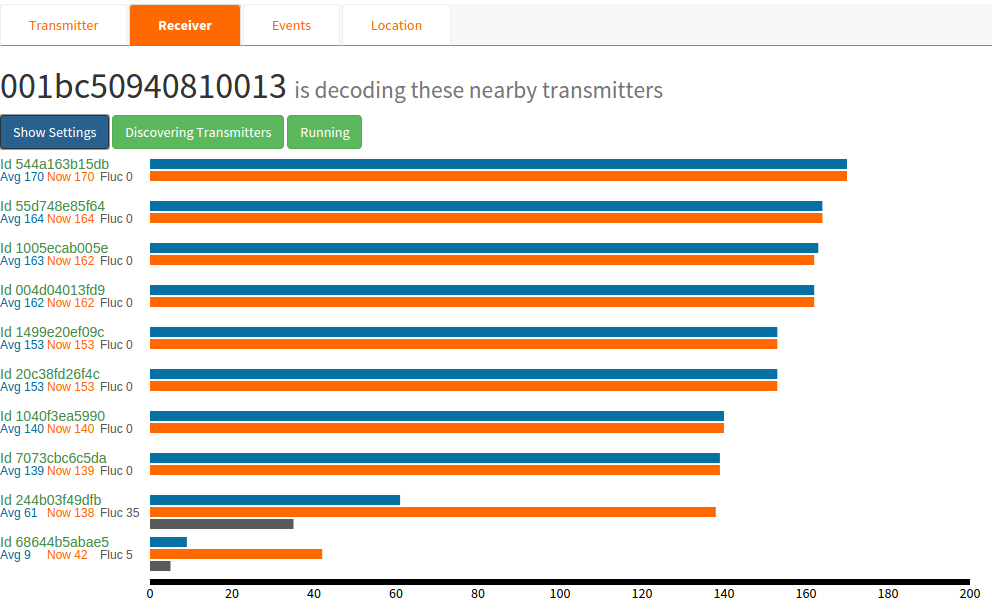
The receiver interface visualises a single radio receiver. The real-time RSSI for each detected transmitter is displayed as a bar chart. This includes the latest (orange), average (blue) and fluctuation (grey) of the RSSI.
| Setting | Description |
|---|---|
| Receiver ID | Specifies which receiver to observe. |
| Samples | Specifes the number of samples over which to average. |
| Max | Maximum number of transmitters to display. |
| API root | Specifies the barterer API location, ex: http://localhost:3001. |
| Legend option | Description |
|---|---|
| Transmitter ID | Click the ID to jump to the corresponding Transmitter Interface. |
Description to come.
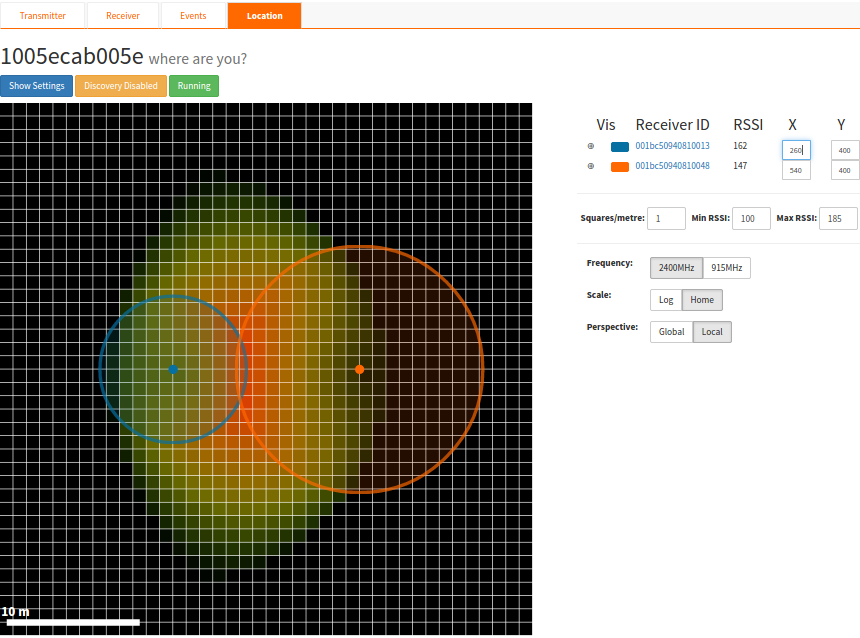
The location interface visualises a single radio transmitter on a two-dimensional grid. All receivers in range are displayed on the grid at user-defined locations. The real-time location of the transmitter is displayed as a heat map based on the corresponding RSSI and location of each receiver:
- the more red a cell is, the more likely the transmitter is located near it
- the more black a cell is, the less likely the transmitter is located near it
Each receiver's location is represented by a colored dot. A halo surrounding the dot represents the most likely locations of the transmitter based on an idealised RSSI-to-range calculation. In a perfect world (which any radio engineer will adamantly argue does not exist), the transmitter would be located at the intersection of all the halos.
The grid is represented as a square 800 pixels on each side. Note that the X and Y coordinates of each receiver are given in pixels while the scale of the grid is given by the Squares/metre parameter. The 10m scale indication at the bottom-left of the grid is helpful for positioning the receivers as per their relative physical locations.
| Setting | Description |
|---|---|
| Transmitter ID | Specifies which transmitter to locate. |
| Cells/Side | Specifies the resolution of the grid. |
| API root | Specifies the barterer API location, ex: http://localhost:3001. |
| Legend option | Description |
|---|---|
| Consider receiver | Click to include/remove receiver data in heat map calculation. |
| Display receiver | Click the coloured button to hide/show that receiver's halo. |
| X position | Enter the receiver's position in pixels from the left edge. |
| Y position | Enter the receiver's position in pixels from the upper edge. |
| Squares/metre | Enter the grid scale as the number of cell edges contained in a meter. |
| minRSSI | Discount RSSI values below this threshold in location calculation. |
| maxRSSI | Enter the RSSI value of the transmitter when it is adjacent to a receiver. |
| Frequency | Select 2400MHz for Bluetooth Smart and 915MHz for reelyActive RFID. Defines the RSSI-to-range conversion equation. |
| Scale | Defines the RSSI-to-range conversion equation. Log scale is ideal, home scale is "reality-inspired". |
| Perspective | Global: the heat map shows as much data as possible. Local : The heat map infers the most likely position. |
- An event interface.
- Displaying blink rates.
- The option to choose the polling rate.
MIT License
Copyright (c) 2015 reelyActive
Permission is hereby granted, free of charge, to any person obtaining a copy of this software and associated documentation files (the "Software"), to deal in the Software without restriction, including without limitation the rights to use, copy, modify, merge, publish, distribute, sublicense, and/or sell copies of the Software, and to permit persons to whom the Software is furnished to do so, subject to the following conditions:
The above copyright notice and this permission notice shall be included in all copies or substantial portions of the Software.
THE SOFTWARE IS PROVIDED "AS IS", WITHOUT WARRANTY OF ANY KIND, EXPRESS OR IMPLIED, INCLUDING BUT NOT LIMITED TO THE WARRANTIES OF MERCHANTABILITY, FITNESS FOR A PARTICULAR PURPOSE AND NONINFRINGEMENT. IN NO EVENT SHALL THE AUTHORS OR COPYRIGHT HOLDERS BE LIABLE FOR ANY CLAIM, DAMAGES OR OTHER LIABILITY, WHETHER IN AN ACTION OF CONTRACT, TORT OR OTHERWISE, ARISING FROM, OUT OF OR IN CONNECTION WITH THE SOFTWARE OR THE USE OR OTHER DEALINGS IN THE SOFTWARE.


