The idea of this tool is to get a report about program compilation so you will know where GHC spends time, and what does it do. This way to can verify your ideas about how to make compilation faster without touching GHC, and leads to better understanding why it where does it spend time and if it reasonable or not. If improved this tool can be used a a guidance to the improving codebase and possibly GHC to get better timings without sacrificing functionality. At least I hope so.
For the author this tool even in it's simplest form allowed to find a way to speedup compilation on 20% by just reorganizing code structure in the project.
NOTE: this tool is in the very early stage, and I work on that in my free time, basically during official holydays only. As a result I target only my usecase, so not all configurations are supported, but I gladly apply any merge requests that will make live of other users easier.
- Download the tool:
hub clone https://github.com/qnikst/ghc-timings-report- Build it:
cabal v2-buildAt this point I don't suggest you to install the tool because at such an early stage it will likely require manual configuration a lot.
- Configure your project in order to generate timing files:
cabal v2-configure --ghc-options=-ddump-timings --ghc-options=-ddump-to-file-ddump-timings tells GHC to generate timings report, -ddump-to-file tells GHC
to store those reports to files.
- Running:
cabal v2-run ghc-timings generate -i /Users/qnikst/workspace/another-project/dist-newstyleIn the tmp folder you'll get all the reports.
(Note this section will likely always be outdated despite all efforts to keep it up to date, sorry for that)
Root of the report files is file:
index.html that contains links to html file files with summary report for each individual
package. There are other files as well:
Report that are generated keeps a ton of -garbage- useful data for each module in all the projects you'll see files:
<host-os>--<ghc-version>--<package-version>--<module>.dump-timings.json
<host-os>--<ghc-version>--<package-version>--<module>.dump-timings.csv
That contains a table for each module with th name of the phase, module, number of allocations, and time spend on that phase.
And report files:
<package-version>.csv
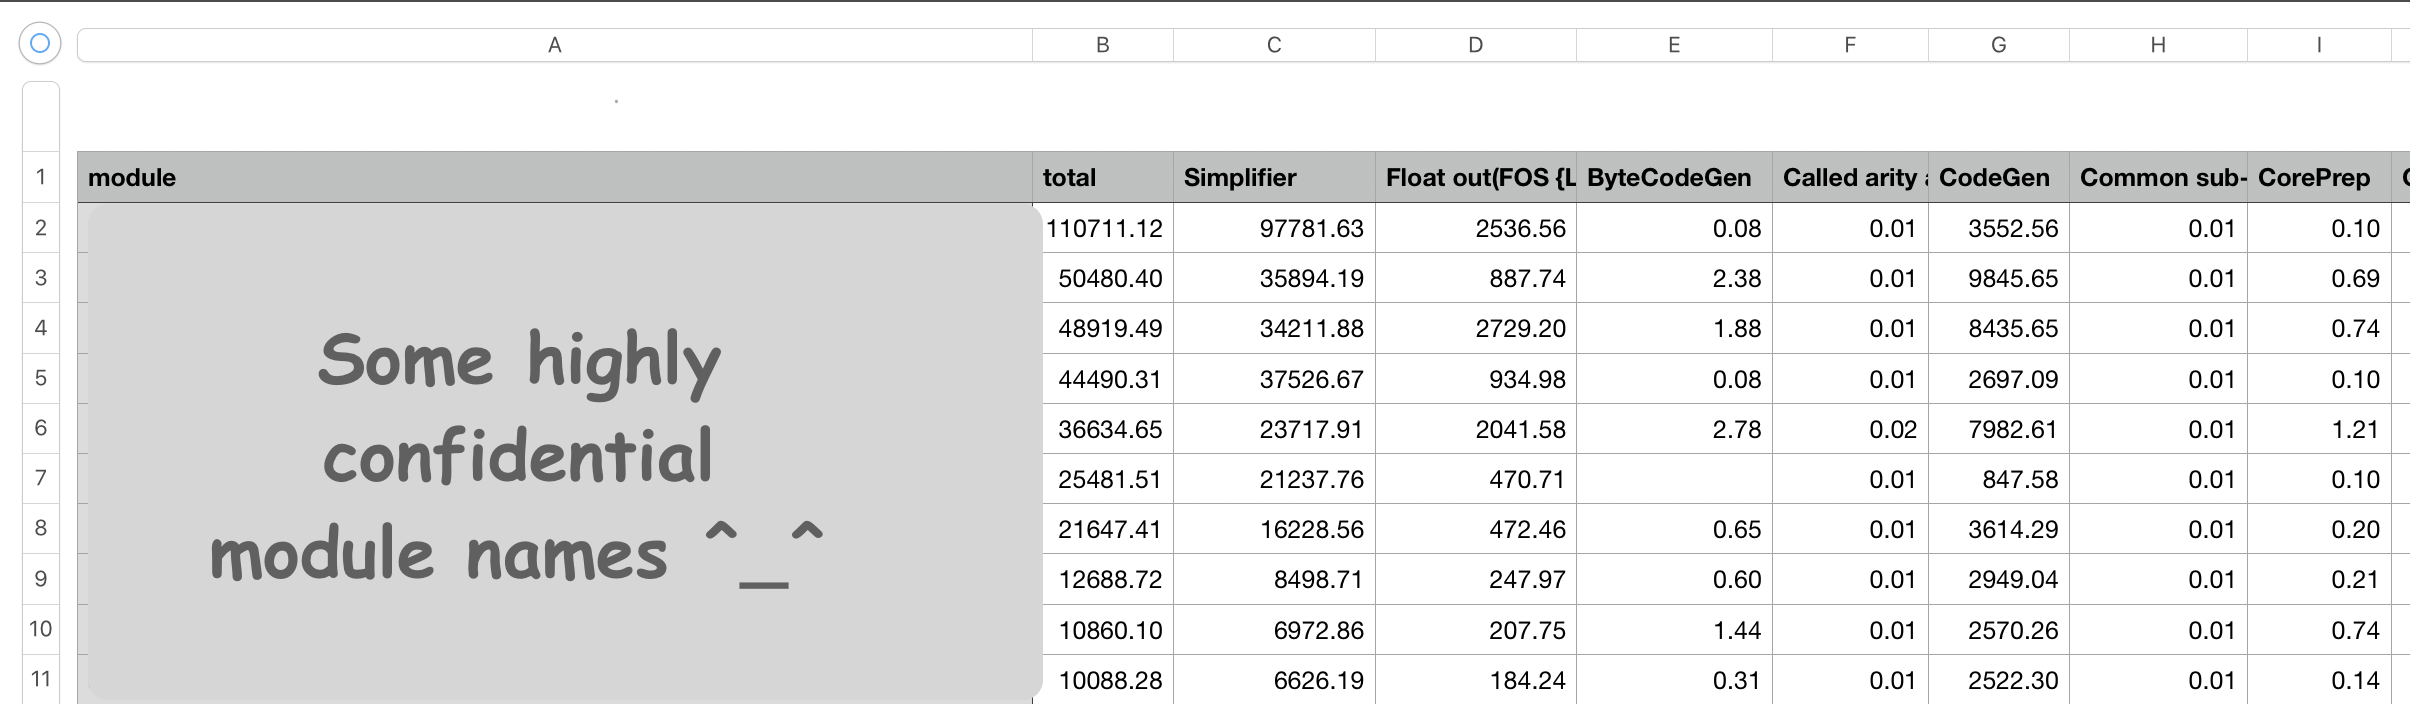
That summarizes information for the package. File keeps list of modules, and total compilation time
for module and total time for each phase. If you import <package-version>.csv file to some
package that works with tables like numbers, you'll see something like this:
Prerequisites: you need to have gnuplot executable on your $PATH to use it.
With following compare command you may actually compare results of two different builds.
cabal v2-run ghc-timings compare -b ./before -a ./after -o output_dirIt will produce a bunch of plots with package/project module names and .svg extension and one more package.svg with a summary.
On the plot you can observe comparison between build times from two build runs per each phase (in <module>.svg) or per each module (in package.svg).
Here I want to share a bits of how I work on this project and it's not usual one for me. I don't know where this project would lead, it has proved to be useful at least for me from the very early development steps. But I don't know how to get good analysis and I don't know that if data will be useful or not. So I use following guidance:
a. Write in a cheap and dirty way so you get your results as fast as possible, it allows me to actually see and verify if I can make any use of the data. It does not worth to spend much time on the design if you'll throw it away because it's not useful at all. But once code is proven to work and useful it worth stabilizing it by proper refactoring. Also this means that I sometime do not use most efficient and nice tricks like foldl package, unless I have a good understanding of it's use, so I don't spend much time learnings that. But I'd like to be pushed into the directions that can improve the package pipeline in a cheap way.
b. Despite of writing dirty way it worth to keep types that describe the problem on each step, to make refactoring simpler.
c. There are many tools that can be used for data visualization and analyses so it worth to store all intermediate data in a machine readable format. This way it's possble to not be tighed to Haskell. (Though I hope)
- It's a pity that we don't have memory residency statistics per module, because allocations tells nothing and it's basically just another "time" report. So for now I avoid working with that in statistics reports.
- I've tried to build a table where I output all the phases, but such a table bacame too big so "Numbers" that I was using for working with data refused to work with it. So I've abadonned that idea unless I'll find a way to represent data in a compact way.
-ddump-jsondoesn't affect-ddump-timingsto it still required to use custom format parser instead of nice json one.


