Giter VIP home page Giter VIP logo

via's Introduction

StaVia - Multi-Omic Single-Cell Cartography for Spatial and Temporal Atlases

StaVia (Via 2.0) is our new single-cell trajectory inference method that explores single-cell atlas-scale data and temporal and spatial studies enabled by. In addition to the full functionality of earlier versions, StaVia now offers (check out our preprint for details)

  1. Integration of metadata (e.g time-series labels, spatial coordinates): Using sequential metadata (temporal labels from longitudinal studies, hierarchical information from phylogenetic trees, spatial distances relevant to spatial omics data) to guide the cartography. Integrating RNA-velocity where applicable.
  2. Higher Order Random Walks: Leveraging higher order random walks with memory to highlight key end-to-end differentiation pathways along the atlas
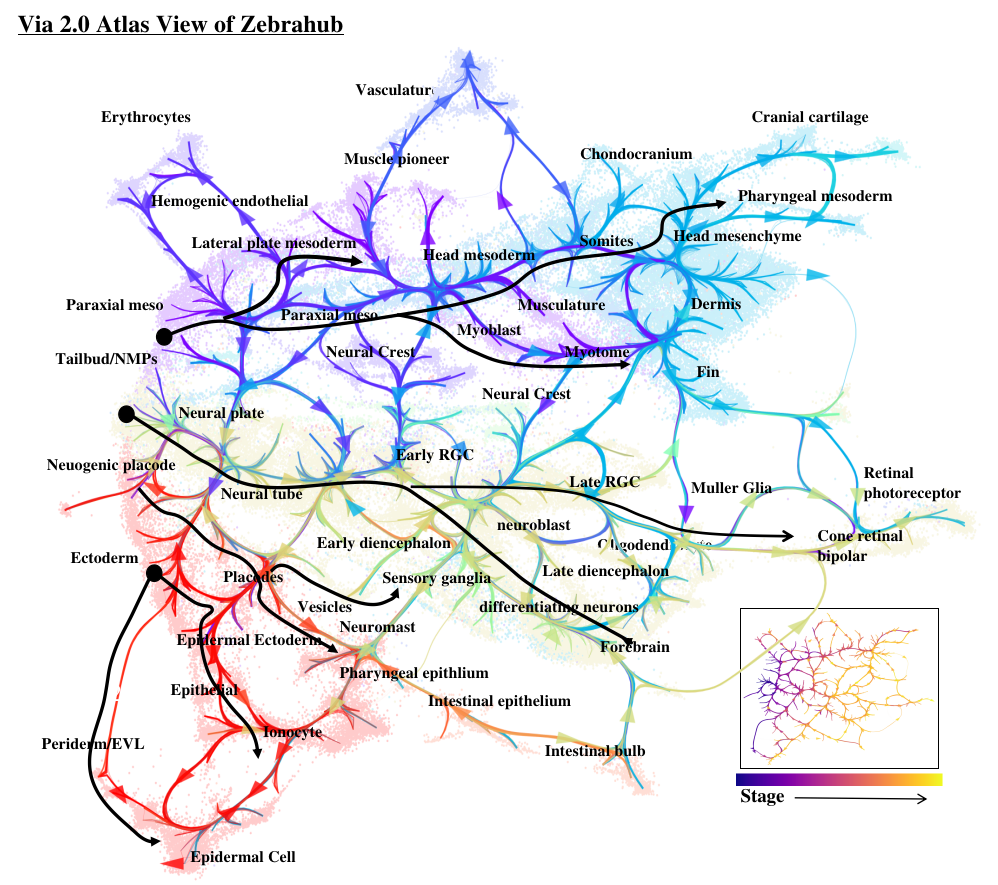
  3. Atlas View: Via 2.0 offers a unique visualization of the predicted trajectory by intuitively merging the cell-cell graph connectivity with the high-resolution of single-cell embeddings. Visit the Gallery to see examples.
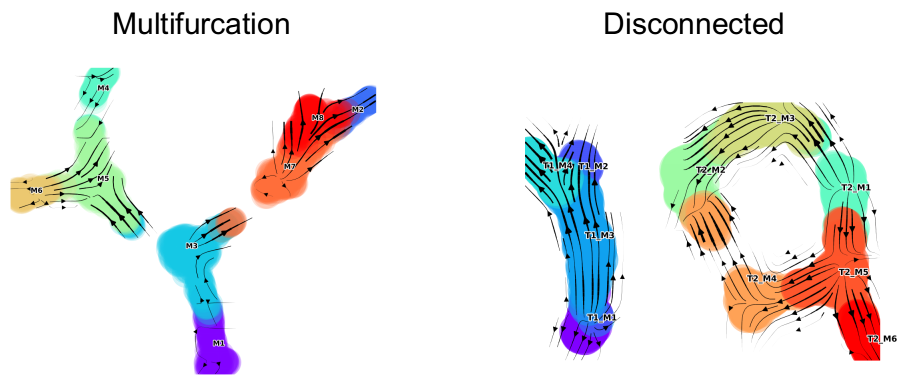
  4. Generalizable and data modality agnostic Via 2.0 still offers all the functionality of Via 1.0 across single-cell data modalities (scRNA-seq, imaging and flow cyometry, scATAC-seq) for types of topologies (disconnected, cyclic, tree) to infer pseudotimes, automated terminal state prediction and automated plotting of temporal gene dynamics along lineages.

StaVia extends the lazy-teleporting walks to higher order random walks with memory to allow better lineage detection, pathway recovery and preservation of global features in terms of computation and visualization. The cartographic approach combining high edge and spatial resolution produces informative and esthetically pleasing visualizations caled the Atlas View.

If you find our work useful, please consider citing our preprint and paper DOI.

Tutorials for Cartographic TI and Visualization using StaVi

Tutorials and videos available on readthedocs with step-by-step code for real and simulated datasets. Tutorials explain how to generate cartographic visualizations for TI, tune parameters, obtain various outputs and also understand the importance of memory. Datasets (anndata h5ad) links are provided below.

✳️Cartography of Zebrafish gastrulation

Trulli

✳️ windmaps of mouse gastrulation

Trulli

✳️ You can start with the The tutorial/Notebook for multifurcating data which shows a step-by-step use case. ✳️

scATAC-seq dataset of Human Hematopoiesis represented by VIA graphs (click image to open interactive graph)

✳️ Fine-grained vector field without using RNA-velocity

Refer to the Jupiter Notebooks to plot these fine-grained vector fields of the sc-trajectories even when there is no RNA-velocity available.

Trulli

Tutorials on readthedocs

Please visit our readthedocs for the latest tutorials and videos on usage and installation

notebook details dataset reference
Multifurcation: Starter Tutorial 4-leaf simulation 4-leaf DynToy
Disconnected disconnected simulation Disconnected DynToy
Zebrafish Gastrulation Time series of 120,000 cells Zebrahub Lange et al. (2023)
Mouse Gastrulation Time series of 90,000 cells Mouse data Sala et al. (2019)
scRNA-seq Hematopoiesis Human hematopoiesis (5780 cells) CD34 scRNA-seq Setty et al. (2019)
FACED image-based 2036 MCF7 cells in cell cycle MCF7 FACED in-house data
scATAC-seq Hematopoiesis Human hematopoiesis scATAC-seq Buenrostro et al. (2018)

Datasets

Dataset are available in the Datasets folder (smaller files) with larger datasets here.


Installation

Linux Ubuntu 16.04 and Windows 10 Installation

We recommend setting up a new conda environment and reccomend python version 3.10. Versions 3.8 and 3.9 should also work. You can use the examples below, the Jupyter notebooks and/or the test script to make sure your installation works as expected.

conda create --name ViaEnv python=3.10 
pip install pyVIA // tested on linux Ubuntu 16.04 and Windows 10

This usually tries to install hnswlib, produces an error and automatically corrects itself by first installing pybind11 followed by hnswlib. To get a smoother installation, consider installing in the following order after creating a new conda environment:

pip install pybind11
pip install hnswlib
pip install pyVIA

Install by cloning repository and running setup.py (ensure dependencies are installed)

git clone https://github.com/ShobiStassen/VIA.git 
python3 setup.py install // cd into the directory of the cloned VIA folder containing setup.py and issue this command

MAC installation

The pie-chart cluster-graph plot does not render correctly for MACs for the time-being. All other outputs are as expected.

conda create --name ViaEnv python=3.10 
pip install pybind11
conda install -c conda-forge hnswlib
pip install pyVIA

Install dependencies separately if needed (linux ubuntu 16.04 and Windows 10)

If the pip install doesn't work, it usually suffices to first install all the requirements (using pip) and subsequently install VIA (also using pip). Note that on Windows if you do not have Visual C++ (required for hnswlib) you can install using this link .

pip install pybind11, hnswlib, igraph, leidenalg>=0.7.0, umap-learn, numpy>=1.17, scipy, pandas>=0.25, sklearn, termcolor, pygam, phate, matplotlib,scanpy
pip install pyVIA

To run on Windows:

All examples and tests have been run on Linux and MAC OS. We find there are somtimes small modifications required to run on a Windows OS (see below). Windows requires minor modifications in calling the code due to the way multiprocessing works in Windows compared to Linux:

#when running from an IDE you need to call the function in the following way to ensure the parallel processing works:
import os
import pyVIA.core as via
f= os.path.join(r'C:\Users\...\Documents'+'\\')
def main():
    via.main_Toy(ncomps=10, knn=30,dataset='Toy3', random_seed=2,foldername= f)    
if __name__ =='__main__':
    main()
    
#when running directly from terminal:
import os
import pyVIA.core as via
f= os.path.join(r'C:\Users\...\Documents'+'\\')
via.main_Toy(ncomps=10, knn=30,dataset='Toy3', random_seed=2,foldername= f)    

Parameters and Attributes

Parameters

Input Parameter for class VIA Description
data (numpy.ndarray) n_samples x n_features. When using via_wrapper(), data is ANNdata object that has a PCA object adata.obsm['X_pca'][:, 0:ncomps] and ncomps is the number of components that will be used.
true_label (list) 'ground truth' annotations or placeholder
memory (float) default =5 higher memory means lineage pathways that deviate less from predecessors
times_series (bool) default=False. whether or not sequential augmentation of the TI graph will be done based on time-series labels
time_series_labels (list) list (length n_cells) of numerical values corresponding to sequential/chronological/hierarchical sequence
knn (optional, default = 30) number of K-Nearest Neighbors for HNSWlib KNN graph
root_user root_user should be provided as a list containing roots corresponding to index (row number in cell matrix) of root cell. For most trajectories this is of the form [53] where 53 is the index of a sensible root cell, for multiple disconnected trajectories an arbitrary list of cells can be provided [1,506,1100], otherwise VIA arbitratily chooses cells. If the root cells of disconnected trajectories are known in advance, then the cells should be annotated with similar syntax to that of Example Dataset in Disconnected Toy Example 1b.
dist_std_local (optional, default = 1) local pruning threshold for PARC clustering stage: the number of standard deviations above the mean minkowski distance between neighbors of a given node. the higher the parameter, the more edges are retained
edgepruning_clustering_resolution (optional, default = 0.15) global level graph pruning for PARC clustering stage. 0.1-1 provide reasonable pruning. higher value means less pruning. e.g. a value of 0.15 means all edges that are above mean(edgeweight)-0.15*std(edge-weights) are retained. We find both 0.15 and 'median' to yield good results resulting in pruning away ~ 50-60% edges
too_big_factor (optional, default = 0.4) if a cluster exceeds this share of the entire cell population, then the PARC will be run on the large cluster
cluster_graph_pruning (optional, default =0.15) To retain more edges/connectivity in the graph underlying the trajectory computations, increase the value
edgebundle_pruning (optional) default value is the same as cluster_grap_pruning. Only impacts the visualized edges, not the underlying edges for computation and TI
x_lazy (optional, default = 0.95) 1-x = probability of staying in same node (lazy). Values between 0.9-0.99 are reasonable
alpha_teleport (optional, default = 0.99) 1-alpha is probability of jumping. Values between 0.95-0.99 are reasonable unless prior knowledge of teleportation
distance (optional, default = 'l2' euclidean) 'ip','cosine'
random_seed (optional, default = 42) The random seed to pass to Leiden
pseudotime_threshold_TS (optional, default = 30) Percentile threshold for potential node to qualify as Terminal State
resolution_parameter (optional, default = 1) Uses ModuliartyVP and RBConfigurationVertexPartition
preserve_disconnected (optional, default = True) If you do not think there should be any disconnected trajectories, set this to False
Attributes Description
labels (list) length n_samples of corresponding cluster labels
single_cell_pt_markov (list) computed pseudotime
embedding 2d array representing a computed embedding
single_cell_bp (array) computed single cell branch probabilities (lineage likelihoods). n_cells x n_terminal states. The columns each correspond to a terminal state, in the same order presented in the'terminal_clusters' attribute
terminal clusters (list) terminal clusters found by VIA
full_neighbor_array full_neighbor_array=v0.full_neighbor_array. KNN graph from first pass of via - neighbor array
full_distance_array full_distance_array=v0.full_distance_array. KNN graph from first pass of via - edge weights
ig_full_graph ig_full_graph=v0.ig_full_graph igraph of the KNN graph from first pass of via
csr_full_graph csr_full_graph. If time_series is true, this is sequentially augmented.
csr_array_locally_pruned csr_array_locally_pruned=v0.csr_array_locally_pruned. CSR matrix of the locally pruned KNN graph

via's People

Contributors

greengilad avatar leoknaw avatar minatokobashi avatar shobistassen avatar

Stargazers

 avatar  avatar  avatar  avatar  avatar  avatar  avatar  avatar  avatar  avatar  avatar  avatar  avatar  avatar  avatar  avatar  avatar  avatar  avatar  avatar  avatar  avatar  avatar  avatar  avatar  avatar  avatar  avatar  avatar  avatar  avatar  avatar  avatar  avatar  avatar  avatar  avatar  avatar  avatar  avatar  avatar  avatar  avatar  avatar  avatar  avatar  avatar  avatar  avatar  avatar  avatar  avatar  avatar  avatar  avatar  avatar  avatar  avatar  avatar  avatar  avatar  avatar  avatar  avatar  avatar  avatar  avatar  avatar  avatar  avatar  avatar  avatar  avatar

Watchers

 avatar  avatar  avatar

via's Issues

terminal states/cell

Hi,
In palantir paper, "the Markov chain is also used to infer terminal states from the data. Palantir identifies terminal states as boundary cells (extrema of diffusion components) that are outliers in the stationary distribution, that is, the states into which the random walks converge (Fig. 1c)". But sometimes we found that cells with lower/early pseudotime can be identified as terminal cells, which is hard to understand.

In VIA, The MCMC-refined graph-edges of the lazy-teleporting random walk enable accurate predictions of terminal cell fates through a consensus vote of various vertex connectivity properties derived from the directed graph (Step 3: Consensus vote on terminal states based on vertex connectivity properties of the directed graph). Could you explain how VIA identify terminal states more detailed ? and is it possible for VIA identifying terminal cells with lower/early pseudotime ?

specific gene trends

Hi,
Are there any ways to plot gene expression along only one or more lineages using via.get_gene_expression?
It's similar to palantir function compute_gene_trends(pr_res, gene_exprs, lineages=None, n_jobs=-1), where lineages: Subset of lineages for which to compute the trends

running main_Toy and get ValueError: Specified a sep and a delimiter; you can only specify one.

Hi,

Thank you for presenting the VIA package.

I tried to run main_Toy via
via.main_Toy(ncomps=10, knn=30,dataset='Toy4', random_seed=2,foldername = "/home/tialan/Downloads/VIA-master/Datasets/")

and get the following error;
ValueError: Specified a sep and a delimiter; you can only specify one.

The whole error message is;
Traceback (most recent call last):
File "", line 1, in
File "/home/tialan/viaenv/lib/python3.7/site-packages/pyVIA/core.py", line 3947, in main_Toy
delimiter=",")
File "/home/tialan/viaenv/lib/python3.7/site-packages/pandas/util/_decorators.py", line 311, in wrapper
return func(*args, **kwargs)
File "/home/tialan/viaenv/lib/python3.7/site-packages/pandas/io/parsers/readers.py", line 582, in read_csv
defaults={"delimiter": ","},
File "/home/tialan/viaenv/lib/python3.7/site-packages/pandas/io/parsers/readers.py", line 1303, in _refine_defaults_read
raise ValueError("Specified a sep and a delimiter; you can only specify one.")
ValueError: Specified a sep and a delimiter; you can only specify one.

Thank you

terminal cells

Hi,
Now we can get terminal clusters from via object, could we get terminal_cells ?

Two many nodes and edges

Hi,
I tested a real single cell dataset, but the plot was full of nodes and edges and the terminal states was too many ! what's the probable reason (data too complex)?. Besides, are there any methods to reduce the cluster numbers and edges and terminal states ?

Data type issues

Hello teacher, can StaVia be used for spatial transcriptome analysis?

The result changes even though the random seed is fixed

Hi,

Even though the random seed is fixed, the result displayed changes each time I run via.
The code used is from the BASIC WORKFLOW:

#define parameters
ncomps, knn, random_seed, dataset, root_user  =30,20, 42,'toy', ['M1']

v0 = via.VIA(adata_counts.obsm['X_pca'][:, 0:ncomps], true_label, jac_std_global=0.15, dist_std_local=1,
             knn=knn, cluster_graph_pruning_std=1, too_big_factor=0.3, root_user=root_user, preserve_disconnected=True, dataset='group',
             random_seed=random_seed, do_compute_embedding=True, embedding_type='via-umap')#, piegraph_arrow_head_width=0.2,             piegraph_edgeweight_scalingfactor=1.0)
v0.run_VIA()

image

I think this wasn't the case in previous versions.
I suspect that a recent update has caused the value of the argument random seed to be ignored.

beginner problems?

super new beginner to python: I got this error after running the test_pyVIA.py, I havent changed anything in the code except for the folder directories:
draw_trajectory_gams(via_coarse=v0, via_fine=v0, embedding = embedding)
TypeError: draw_trajectory_gams() got an unexpected keyword argument 'via_coarse'

and this error after running the basic workflow tutorial:
fig, ax, ax2= draw_piechart_graph(via0=v0, type_data='pt', title='Toy multifurcation', cmap='viridis', ax_text= True, gene_exp='', alpha_edge=0.5, linewidth_edge=1.5, edge_color='green', headwidth_arrow=0.2)
Traceback (most recent call last):
File "", line 1, in
TypeError: draw_piechart_graph() got an unexpected keyword argument 'via0'

Input preprocessing and normalization

Hello,
I have a question regarding the normalization of the input expression matrix. Is there some recommendation on how to preprocess or normalize the data? In the tutorials, I noticed log and sqrt scaling but without any further comment. Then, is it recommended to use scv.pp.normalize_per_cell(adata) or filter the genes with sc.pp.highly_variable_genes(adata) for example? I would appreciate more information on this if possible.

More precisely, I am working with Seurat-integrated data and I use integrated assay as an input. The results seem to make sense so far, however, I noticed differences when I use "raw" integrated data or scaled with sc.pp.scale(adata) as recommended in Seurat integration vignette. It would be also nice to clarify whether it makes sense to use integrated data nad how.

Thank you,
Pavel

Error in v0.run_VIA()

Hi All, I am running the VIA code on scRNA-seq data. When running the line v0.run_VIA() I get the error below. I am having trouble resolving this. Below is my code prior and the error message.
Code

ncomps=80
knn=30
v0_random_seed=4
root_user = [3723] #the index of a cell belonging to the HSC cell type
dataset = ''

'''
#NOTE1, if you decide to choose a cell type as a root, then you need to set the dataset as 'group'
#root_user=['HSC1']
#dataset = 'group'# 'humanCD34'
#NOTE2, if rna-velocity is available, considering using it to compute the root automatically- see RNA velocity tutorial
'''

v0 = via.VIA(data=adata.obsm['X_pca'][:, 0:ncomps], true_label=adata.obs['ident'],
             jac_std_global=0.15, cluster_graph_pruning_std=0.15,
             knn=knn, too_big_factor=0.3, root_user=root_user,
             dataset=dataset, random_seed=v0_random_seed, embedding = embedding)

v0.run_VIA()

Error

2023-05-17 23:11:08.680298	From root 16,  the Terminal state 25 is reached 590 times.
2023-05-17 23:11:08.729189	Terminal clusters corresponding to unique lineages are {33: 'Tumor c3', 7: 'Tumor c2', 14: 'Tumor c5', 17: 'Tumor c5', 21: 'Tumor c2', 22: 'Tumor c2', 24: 'Tumor c2', 25: 'Tumor c2'}
2023-05-17 23:11:08.729276	Begin projection of pseudotime and lineage likelihood
2023-05-17 23:11:09.427198	Graph has 1 connected components before pruning
2023-05-17 23:11:09.431525	Graph has 10 connected components after pruning
2023-05-17 23:11:09.442976	Graph has 1 connected components after reconnecting
2023-05-17 23:11:09.443813	63.1% links trimmed from local pruning relative to start
2023-05-17 23:11:09.443864	72.7% links trimmed from global pruning relative to start
2023-05-17 23:11:09.448086	Start making edgebundle milestone...
2023-05-17 23:11:09.448162	Start finding milestones
---------------------------------------------------------------------------
AttributeError                            Traceback (most recent call last)
Cell In[7], line 19
      7 '''
      8 #NOTE1, if you decide to choose a cell type as a root, then you need to set the dataset as 'group'
      9 #root_user=['HSC1']
     10 #dataset = 'group'# 'humanCD34'
     11 #NOTE2, if rna-velocity is available, considering using it to compute the root automatically- see RNA velocity tutorial
     12 '''
     14 v0 = via.VIA(data=adata.obsm['X_pca'][:, 0:ncomps], true_label=adata.obs['ident'],
     15              jac_std_global=0.15, cluster_graph_pruning_std=0.15,
     16              knn=knn, too_big_factor=0.3, root_user=root_user,
     17              dataset=dataset, random_seed=v0_random_seed, embedding = embedding)
---> 19 v0.run_VIA()

File ~/opt/miniconda3/envs/scanpy_env_A/lib/python3.9/site-packages/pyVIA/core.py:3140, in VIA.run_VIA(self)
   3138 self.knn_struct = _construct_knn(self.data, knn=self.knn, distance=self.distance, num_threads=self.num_threads)
   3139 st = time.time()
-> 3140 self.run_subPARC()
   3141 run_time = time.time() - st
   3142 print(f'{datetime.now()}\tTime elapsed {round(run_time,1)} seconds')

File ~/opt/miniconda3/envs/scanpy_env_A/lib/python3.9/site-packages/pyVIA/core.py:2667, in VIA.run_subPARC(self)
   2665 self.hammerbundle_milestone_dict = None
   2666 if self.embedding is not None:
-> 2667     self.hammerbundle_milestone_dict = make_edgebundle_milestone(embedding=self.embedding,
   2668                                                              sc_graph=self.ig_full_graph,
   2669                                                              n_milestones=n_milestones,
   2670                                                              global_visual_pruning=global_visual_pruning,
   2671                                                              initial_bandwidth=initial_bandwidth, decay=decay,
   2672                                                              weighted=True,
   2673                                                              sc_labels_numeric=self.time_series_labels,
   2674                                                              sc_pt=self.single_cell_pt_markov, terminal_cluster_list=self.terminal_clusters, single_cell_lineage_prob=self.single_cell_bp)
   2676 self.labels = list(self.labels)
   2678 from statistics import mode

File ~/opt/miniconda3/envs/scanpy_env_A/lib/python3.9/site-packages/pyVIA/plotting_via.py:140, in make_edgebundle_milestone(embedding, sc_graph, via_object, sc_pt, initial_bandwidth, decay, n_milestones, milestone_labels, sc_labels_numeric, weighted, global_visual_pruning, terminal_cluster_list, single_cell_lineage_prob, random_state)
    138 print(f'{datetime.now()}\tStart finding milestones')
    139 from sklearn.cluster import KMeans
--> 140 kmeans = KMeans(n_clusters=n_milestones, random_state=random_state).fit(embedding)
    141 milestone_labels = kmeans.labels_.flatten().tolist()
    142 print(f'{datetime.now()}\tEnd milestones')

File ~/opt/miniconda3/envs/scanpy_env_A/lib/python3.9/site-packages/sklearn/cluster/_kmeans.py:1468, in KMeans.fit(self, X, y, sample_weight)
   1465     print("Initialization complete")
   1467 # run a k-means once
-> 1468 labels, inertia, centers, n_iter_ = kmeans_single(
   1469     X,
   1470     sample_weight,
   1471     centers_init,
   1472     max_iter=self.max_iter,
   1473     verbose=self.verbose,
   1474     tol=self._tol,
   1475     n_threads=self._n_threads,
   1476 )
   1478 # determine if these results are the best so far
   1479 # we chose a new run if it has a better inertia and the clustering is
   1480 # different from the best so far (it's possible that the inertia is
   1481 # slightly better even if the clustering is the same with potentially
   1482 # permuted labels, due to rounding errors)
   1483 if best_inertia is None or (
   1484     inertia < best_inertia
   1485     and not _is_same_clustering(labels, best_labels, self.n_clusters)
   1486 ):

File ~/opt/miniconda3/envs/scanpy_env_A/lib/python3.9/site-packages/sklearn/cluster/_kmeans.py:679, in _kmeans_single_lloyd(X, sample_weight, centers_init, max_iter, verbose, tol, n_threads)
    675 strict_convergence = False
    677 # Threadpoolctl context to limit the number of threads in second level of
    678 # nested parallelism (i.e. BLAS) to avoid oversubscription.
--> 679 with threadpool_limits(limits=1, user_api="blas"):
    680     for i in range(max_iter):
    681         lloyd_iter(
    682             X,
    683             sample_weight,
   (...)
    689             n_threads,
    690         )

File ~/opt/miniconda3/envs/scanpy_env_A/lib/python3.9/site-packages/sklearn/utils/fixes.py:151, in threadpool_limits(limits, user_api)
    149     return controller.limit(limits=limits, user_api=user_api)
    150 else:
--> 151     return threadpoolctl.threadpool_limits(limits=limits, user_api=user_api)

File ~/opt/miniconda3/envs/scanpy_env_A/lib/python3.9/site-packages/threadpoolctl.py:171, in threadpool_limits.__init__(self, limits, user_api)
    167 def __init__(self, limits=None, user_api=None):
    168     self._limits, self._user_api, self._prefixes = \
    169         self._check_params(limits, user_api)
--> 171     self._original_info = self._set_threadpool_limits()

File ~/opt/miniconda3/envs/scanpy_env_A/lib/python3.9/site-packages/threadpoolctl.py:268, in threadpool_limits._set_threadpool_limits(self)
    265 if self._limits is None:
    266     return None
--> 268 modules = _ThreadpoolInfo(prefixes=self._prefixes,
    269                           user_api=self._user_api)
    270 for module in modules:
    271     # self._limits is a dict {key: num_threads} where key is either
    272     # a prefix or a user_api. If a module matches both, the limit
    273     # corresponding to the prefix is chosed.
    274     if module.prefix in self._limits:

File ~/opt/miniconda3/envs/scanpy_env_A/lib/python3.9/site-packages/threadpoolctl.py:340, in _ThreadpoolInfo.__init__(self, user_api, prefixes, modules)
    337     self.user_api = [] if user_api is None else user_api
    339     self.modules = []
--> 340     self._load_modules()
    341     self._warn_if_incompatible_openmp()
    342 else:

File ~/opt/miniconda3/envs/scanpy_env_A/lib/python3.9/site-packages/threadpoolctl.py:371, in _ThreadpoolInfo._load_modules(self)
    369 """Loop through loaded libraries and store supported ones"""
    370 if sys.platform == "darwin":
--> 371     self._find_modules_with_dyld()
    372 elif sys.platform == "win32":
    373     self._find_modules_with_enum_process_module_ex()

File ~/opt/miniconda3/envs/scanpy_env_A/lib/python3.9/site-packages/threadpoolctl.py:428, in _ThreadpoolInfo._find_modules_with_dyld(self)
    425 filepath = filepath.decode("utf-8")
    427 # Store the module if it is supported and selected
--> 428 self._make_module_from_path(filepath)

File ~/opt/miniconda3/envs/scanpy_env_A/lib/python3.9/site-packages/threadpoolctl.py:515, in _ThreadpoolInfo._make_module_from_path(self, filepath)
    513 if prefix in self.prefixes or user_api in self.user_api:
    514     module_class = globals()[module_class]
--> 515     module = module_class(filepath, prefix, user_api, internal_api)
    516     self.modules.append(module)

File ~/opt/miniconda3/envs/scanpy_env_A/lib/python3.9/site-packages/threadpoolctl.py:606, in _Module.__init__(self, filepath, prefix, user_api, internal_api)
    604 self.internal_api = internal_api
    605 self._dynlib = ctypes.CDLL(filepath, mode=_RTLD_NOLOAD)
--> 606 self.version = self.get_version()
    607 self.num_threads = self.get_num_threads()
    608 self._get_extra_info()

File ~/opt/miniconda3/envs/scanpy_env_A/lib/python3.9/site-packages/threadpoolctl.py:646, in _OpenBLASModule.get_version(self)
    643 get_config = getattr(self._dynlib, "openblas_get_config",
    644                      lambda: None)
    645 get_config.restype = ctypes.c_char_p
--> 646 config = get_config().split()
    647 if config[0] == b"OpenBLAS":
    648     return config[1].decode("utf-8")

AttributeError: 'NoneType' object has no attribute 'split'

3d plots

Thanks for the nice work and package !
Is there any way to predict 3d edge positions ? Or the only way is to predict for dimension (0,1) and then (0,2) to assemble a guess ?

Error when plotting differentiation.flow

Firstly, thanks for a great package! I'm attempting to run via.plot_differentiation_flow but encountering a few issues that I'm not able to make sense of.

PyVIA version: 0.1.96

From my VIA object:

My VIA object:
There are (23) terminal clusters corresponding to unique lineages {7: 'Memory B', 9: 'CD14 Mono', 10: 'CD14 Mono', 19: 'CD14 Mono', 21: 'Memory B', 23: 'transitional B', 28: 'Memory B', 30: 'CD16 Mono', 31: 'Late Eryth', 36: 'CD14 Mono', 40: 'Late Eryth', 41: 'Memory B', 42: 'Memory B', 43: 'Late Eryth', 44: 'CD14 Mono', 45: 'cDC2', 46: 'pDC', 51: 'cDC2', 52: 'CD16 Mono', 53: 'Memory B', 54: 'Late Eryth', 55: 'CD16 Mono', 56: 'pDC'}

The root index, 382 provided by the user belongs to cluster number 16 and corresponds to cell type HSC

And the plot command:
via.plot_differentiation_flow(via_object=v0, marker_lineages=[9], do_log_flow=True, root_cluster_list=[16])
The error and traceback:

---------------------------------------------------------------------------
ValueError                                Traceback (most recent call last)
File ~/anaconda3/envs/ViaEnv/lib/python3.9/site-packages/pandas/core/indexes/range.py:345, in RangeIndex.get_loc(self, key)
    344 try:
--> 345     return self._range.index(new_key)
    346 except ValueError as err:

ValueError: 0 is not in range

The above exception was the direct cause of the following exception:

KeyError                                  Traceback (most recent call last)
File ~/anaconda3/envs/ViaEnv/lib/python3.9/site-packages/pandas/core/groupby/generic.py:269, in SeriesGroupBy.aggregate(self, func, engine, engine_kwargs, *args, **kwargs)
    268 try:
--> 269     return self._python_agg_general(func, *args, **kwargs)
    270 except KeyError:
    271     # KeyError raised in test_groupby.test_basic is bc the func does
    272     #  a dictionary lookup on group.name, but group name is not
    273     #  pinned in _python_agg_general, only in _aggregate_named

File ~/anaconda3/envs/ViaEnv/lib/python3.9/site-packages/pandas/core/groupby/generic.py:288, in SeriesGroupBy._python_agg_general(self, func, *args, **kwargs)
    287 obj = self._obj_with_exclusions
--> 288 result = self.grouper.agg_series(obj, f)
    289 res = obj._constructor(result, name=obj.name)

File ~/anaconda3/envs/ViaEnv/lib/python3.9/site-packages/pandas/core/groupby/ops.py:994, in BaseGrouper.agg_series(self, obj, func, preserve_dtype)
    992     preserve_dtype = True
--> 994 result = self._aggregate_series_pure_python(obj, func)
    996 npvalues = lib.maybe_convert_objects(result, try_float=False)

File ~/anaconda3/envs/ViaEnv/lib/python3.9/site-packages/pandas/core/groupby/ops.py:1015, in BaseGrouper._aggregate_series_pure_python(self, obj, func)
   1014 for i, group in enumerate(splitter):
-> 1015     res = func(group)
   1016     res = libreduction.extract_result(res)

File ~/anaconda3/envs/ViaEnv/lib/python3.9/site-packages/pandas/core/groupby/generic.py:285, in SeriesGroupBy._python_agg_general.<locals>.<lambda>(x)
    284 func = com.is_builtin_func(func)
--> 285 f = lambda x: func(x, *args, **kwargs)
    287 obj = self._obj_with_exclusions

File ~/anaconda3/envs/ViaEnv/lib/python3.9/site-packages/pyVIA/plotting_via.py:829, in plot_differentiation_flow.<locals>.<lambda>(x)
    827 else: df_mode['celltype'] = via_object.true_label
    828 majority_cluster_population_dict = df_mode.groupby(['cluster'])['celltype'].agg(
--> 829     lambda x: pd.Series.mode(x)[0])  # agg(pd.Series.mode would give all modes) #series
    830 majority_cluster_population_dict = majority_cluster_population_dict.to_dict()

File ~/anaconda3/envs/ViaEnv/lib/python3.9/site-packages/pandas/core/series.py:1007, in Series.__getitem__(self, key)
   1006 elif key_is_scalar:
-> 1007     return self._get_value(key)
   1009 if is_hashable(key):
   1010     # Otherwise index.get_value will raise InvalidIndexError

File ~/anaconda3/envs/ViaEnv/lib/python3.9/site-packages/pandas/core/series.py:1116, in Series._get_value(self, label, takeable)
   1115 # Similar to Index.get_value, but we do not fall back to positional
-> 1116 loc = self.index.get_loc(label)
   1118 if is_integer(loc):

File ~/anaconda3/envs/ViaEnv/lib/python3.9/site-packages/pandas/core/indexes/range.py:347, in RangeIndex.get_loc(self, key)
    346     except ValueError as err:
--> 347         raise KeyError(key) from err
    348 if isinstance(key, Hashable):

KeyError: 0

During handling of the above exception, another exception occurred:

ValueError                                Traceback (most recent call last)
File ~/anaconda3/envs/ViaEnv/lib/python3.9/site-packages/pandas/core/indexes/range.py:345, in RangeIndex.get_loc(self, key)
    344 try:
--> 345     return self._range.index(new_key)
    346 except ValueError as err:

ValueError: 0 is not in range

The above exception was the direct cause of the following exception:

KeyError                                  Traceback (most recent call last)
Cell In[120], line 1
----> 1 via.plot_differentiation_flow(via_object=v0, marker_lineages=[9], do_log_flow=True, root_cluster_list=[16])

File ~/anaconda3/envs/ViaEnv/lib/python3.9/site-packages/pyVIA/plotting_via.py:828, in plot_differentiation_flow(via_object, idx, dpi, marker_lineages, label_node, do_log_flow, fontsize, alpha_factor, majority_cluster_population_dict, cmap_sankey, title_str, root_cluster_list)
    826 if len(label_node)>0: df_mode['celltype'] = label_node# v0.true_label
    827 else: df_mode['celltype'] = via_object.true_label
--> 828 majority_cluster_population_dict = df_mode.groupby(['cluster'])['celltype'].agg(
    829     lambda x: pd.Series.mode(x)[0])  # agg(pd.Series.mode would give all modes) #series
    830 majority_cluster_population_dict = majority_cluster_population_dict.to_dict()
    831 print(f'{datetime.now()}\tEnd dictionary modes')

File ~/anaconda3/envs/ViaEnv/lib/python3.9/site-packages/pandas/core/groupby/generic.py:274, in SeriesGroupBy.aggregate(self, func, engine, engine_kwargs, *args, **kwargs)
    269     return self._python_agg_general(func, *args, **kwargs)
    270 except KeyError:
    271     # KeyError raised in test_groupby.test_basic is bc the func does
    272     #  a dictionary lookup on group.name, but group name is not
    273     #  pinned in _python_agg_general, only in _aggregate_named
--> 274     result = self._aggregate_named(func, *args, **kwargs)
    276     # result is a dict whose keys are the elements of result_index
    277     result = Series(result, index=self.grouper.result_index)

File ~/anaconda3/envs/ViaEnv/lib/python3.9/site-packages/pandas/core/groupby/generic.py:412, in SeriesGroupBy._aggregate_named(self, func, *args, **kwargs)
    409 for name, group in self:
    410     object.__setattr__(group, "name", name)
--> 412     output = func(group, *args, **kwargs)
    413     output = libreduction.extract_result(output)
    414     if not initialized:
    415         # We only do this validation on the first iteration

File ~/anaconda3/envs/ViaEnv/lib/python3.9/site-packages/pyVIA/plotting_via.py:829, in plot_differentiation_flow.<locals>.<lambda>(x)
    826 if len(label_node)>0: df_mode['celltype'] = label_node# v0.true_label
    827 else: df_mode['celltype'] = via_object.true_label
    828 majority_cluster_population_dict = df_mode.groupby(['cluster'])['celltype'].agg(
--> 829     lambda x: pd.Series.mode(x)[0])  # agg(pd.Series.mode would give all modes) #series
    830 majority_cluster_population_dict = majority_cluster_population_dict.to_dict()
    831 print(f'{datetime.now()}\tEnd dictionary modes')

File ~/anaconda3/envs/ViaEnv/lib/python3.9/site-packages/pandas/core/series.py:1007, in Series.__getitem__(self, key)
   1004     return self._values[key]
   1006 elif key_is_scalar:
-> 1007     return self._get_value(key)
   1009 if is_hashable(key):
   1010     # Otherwise index.get_value will raise InvalidIndexError
   1011     try:
   1012         # For labels that don't resolve as scalars like tuples and frozensets

File ~/anaconda3/envs/ViaEnv/lib/python3.9/site-packages/pandas/core/series.py:1116, in Series._get_value(self, label, takeable)
   1113     return self._values[label]
   1115 # Similar to Index.get_value, but we do not fall back to positional
-> 1116 loc = self.index.get_loc(label)
   1118 if is_integer(loc):
   1119     return self._values[loc]

File ~/anaconda3/envs/ViaEnv/lib/python3.9/site-packages/pandas/core/indexes/range.py:347, in RangeIndex.get_loc(self, key)
    345         return self._range.index(new_key)
    346     except ValueError as err:
--> 347         raise KeyError(key) from err
    348 if isinstance(key, Hashable):
    349     raise KeyError(key)

KeyError: 0

Any idea what is causing this?

run_VIA() error index 125 is out of bounds for axis 0 with size 2

Hi,

The run_VIA() function returns the IndexError: index 125 is out of bounds for axis 0 with size 2. I do twice run_VIA() according to the instruction. The first time is fine but the second time such error is reported. The code is run for the second time is;

tsi_list = via.get_loc_terminal_states(v_1, adata.obsm['X_pca'][:, 0:2])
v_2 = via.VIA(adata.obsm['X_pca'][:, 0:2], true_label_1, jac_std_global=0.15, dist_std_local=1, knn=5,
too_big_factor=0.05, super_cluster_labels=v_1.labels, super_node_degree_list=v_1.node_degree_list,
super_terminal_cells=tsi_list, root_user=root, is_coarse=False, full_neighbor_array=v_1.full_neighbor_array,
full_distance_array=v_1.full_distance_array, ig_full_graph=v_1.ig_full_graph,
csr_array_locally_pruned=v_1.csr_array_locally_pruned,
x_lazy=0.95, alpha_teleport=0.99, preserve_disconnected=True,
super_terminal_clusters=v_1.terminal_clusters, random_seed=1, name='v_2')

v_2.run_VIA()

The output including the error is;
input data has shape 1000 (samples) x 2 (features)
time is Sun Nov 7 14:06:54 2021
commencing global pruning
Share of edges kept after Global Pruning 48.47 %
commencing community detection
time is Sun Nov 7 14:06:54 2021
397 clusters before handling small/big
There are 0 clusters that are too big
humanCD34 : global cluster graph pruning level 0.15
number of components before pruning 2
number of connected componnents after reconnecting 2
percentage links trimmed from local pruning relative to start 0.0
percentage links trimmed from global pruning relative to start 48.7
there are 2 components in the graph
root user [0]
start computing lazy-teleporting Expected Hitting Times
ended all multiprocesses, will retrieve and reshape
super_terminal_clusters [129, 130, 3, 5, 6, 134, 8, 10, 11, 136, 13, 14, 139, 16, 17, 18, 20, 21, 24, 28, 31, 32, 161, 35, 38, 40, 42, 43, 45, 54, 56, 58, 60, 62, 64, 68, 69, 71, 72, 73, 76, 78, 84, 88, 90, 93, 99, 102, 104, 106, 109, 110, 115, 117, 118, 119, 120, 126]
terminal clus in this component [128, 129, 3, 5, 6, 133, 8, 10, 11, 135, 13, 14, 138, 16, 17, 18, 20, 21, 24, 28, 31, 32, 160, 35, 38, 40, 42, 43, 45, 54, 56, 58, 59, 61, 63, 67, 68, 70, 71, 72, 75, 77, 83, 87, 89, 92, 98, 101, 103, 105, 108, 109, 114, 116, 117, 118, 119, 125]
final terminal clus [129, 130, 3, 5, 6, 134, 8, 10, 11, 136, 13, 14, 139, 16, 17, 18, 20, 21, 24, 28, 31, 32, 161, 35, 38, 40, 42, 43, 45, 54, 56, 58, 60, 62, 64, 68, 69, 71, 72, 73, 76, 78, 84, 88, 90, 93, 99, 102, 104, 106, 109, 110, 115, 117, 118, 119, 120, 126]
From root 26 to Terminal state 128 is found 207 times.
From root 26 to Terminal state 129 is found 5 times.
From root 26 to Terminal state 3 is found 5 times.
From root 26 to Terminal state 5 is found 5 times.
From root 26 to Terminal state 6 is found 5 times.
From root 26 to Terminal state 133 is found 5 times.
From root 26 to Terminal state 8 is found 5 times.
From root 26 to Terminal state 10 is found 5 times.
From root 26 to Terminal state 11 is found 5 times.
From root 26 to Terminal state 135 is found 5 times.
From root 26 to Terminal state 13 is found 5 times.
From root 26 to Terminal state 14 is found 5 times.
From root 26 to Terminal state 138 is found 5 times.
From root 26 to Terminal state 16 is found 5 times.
From root 26 to Terminal state 17 is found 5 times.
From root 26 to Terminal state 18 is found 5 times.
From root 26 to Terminal state 20 is found 5 times.
From root 26 to Terminal state 21 is found 5 times.
From root 26 to Terminal state 24 is found 5 times.
From root 26 to Terminal state 28 is found 5 times.
From root 26 to Terminal state 31 is found 5 times.
From root 26 to Terminal state 32 is found 19 times.
From root 26 to Terminal state 160 is found 5 times.
From root 26 to Terminal state 35 is found 5 times.
From root 26 to Terminal state 38 is found 5 times.
From root 26 to Terminal state 40 is found 5 times.
From root 26 to Terminal state 42 is found 5 times.
From root 26 to Terminal state 43 is found 5 times.
From root 26 to Terminal state 45 is found 5 times.
From root 26 to Terminal state 54 is found 5 times.
From root 26 to Terminal state 56 is found 5 times.
From root 26 to Terminal state 58 is found 5 times.
From root 26 to Terminal state 59 is found 5 times.
From root 26 to Terminal state 61 is found 5 times.
From root 26 to Terminal state 63 is found 5 times.
From root 26 to Terminal state 67 is found 5 times.
From root 26 to Terminal state 68 is found 5 times.
From root 26 to Terminal state 70 is found 5 times.
From root 26 to Terminal state 71 is found 5 times.
From root 26 to Terminal state 72 is found 5 times.
From root 26 to Terminal state 75 is found 5 times.
From root 26 to Terminal state 77 is found 5 times.
From root 26 to Terminal state 83 is found 5 times.
From root 26 to Terminal state 87 is found 5 times.
From root 26 to Terminal state 89 is found 205 times.
From root 26 to Terminal state 92 is found 5 times.
From root 26 to Terminal state 98 is found 5 times.
From root 26 to Terminal state 101 is found 5 times.
From root 26 to Terminal state 103 is found 5 times.
From root 26 to Terminal state 105 is found 5 times.
From root 26 to Terminal state 108 is found 77 times.
From root 26 to Terminal state 109 is found 5 times.
From root 26 to Terminal state 114 is found 9 times.
From root 26 to Terminal state 116 is found 5 times.
From root 26 to Terminal state 117 is found 5 times.
From root 26 to Terminal state 118 is found 5 times.
From root 26 to Terminal state 119 is found 5 times.
From root 26 to Terminal state 125 is found 5 times.
start computing lazy-teleporting Expected Hitting Times
ended all multiprocesses, will retrieve and reshape
super_terminal_clusters [129, 130, 3, 5, 6, 134, 8, 10, 11, 136, 13, 14, 139, 16, 17, 18, 20, 21, 24, 28, 31, 32, 161, 35, 38, 40, 42, 43, 45, 54, 56, 58, 60, 62, 64, 68, 69, 71, 72, 73, 76, 78, 84, 88, 90, 93, 99, 102, 104, 106, 109, 110, 115, 117, 118, 119, 120, 126]
no sub cluster has majority made of super-cluster 129

IndexError Traceback (most recent call last)
/tmp/ipykernel_60176/2984432610.py in
8 super_terminal_clusters=v_1.terminal_clusters, random_seed=1, name='v_2')
9
---> 10 v_2.run_VIA()

~/viaenv/lib/python3.7/site-packages/pyVIA/core.py in run_VIA(self)
3389 # Query dataset, k - number of closest elements (returns 2 numpy arrays)
3390
-> 3391 self.run_subPARC()
3392 run_time = time.time() - time_start_total
3393 print('time elapsed {:.1f} seconds'.format(run_time))

~/viaenv/lib/python3.7/site-packages/pyVIA/core.py in run_subPARC(self)
2854 sub_terminal_clus_temp_.append(most_likely_sub_terminal)
2855
-> 2856 if (markov_hitting_times_ai[loc_j_in_sub_ai] > np.percentile(
2857 np.asarray(markov_hitting_times_ai), self.pseudotime_threshold_TS)): # 30
2858

IndexError: index 125 is out of bounds for axis 0 with size 2

Thanks in advance
Tian

TypeError: __init__() got an unexpected keyword argument 'dist_std_local'

A good job! The result and plot is interseting!
When I run the tutorial(https://pyvia.readthedocs.io/en/latest/ViaJupyter_Toy_Multifurcating.html) with Jupyter Notebook, I meet some troubles.

#define parameters
ncomps, knn, random_seed, dataset, root_user  =30,20, 42,'toy', ['M1']
[](url)
v0 = VIA(adata_counts.obsm['X_pca'][:, 0:ncomps], true_label, jac_std_global=0.15, dist_std_local=1,
             knn=knn, cluster_graph_pruning_std=1, too_big_factor=0.3, root_user=root_user, preserve_disconnected=True, dataset='group',
             random_seed=random_seed)#, piegraph_arrow_head_width=0.2,             piegraph_edgeweight_scalingfactor=1.0)  
v0.run_VIA()

I got the following error

---------------------------------------------------------------------------
TypeError                                 Traceback (most recent call last)
/home/huang/PyCode/scRNA/VIA/VIA-master/Jupyter Notebooks/Basic tutorial.ipynb 单元格 11 line 4
      [1](vscode-notebook-cell://ssh-remote%2B192.168.1.2/home/huang/PyCode/scRNA/VIA/VIA-master/Jupyter%20Notebooks/Basic%20tutorial.ipynb#X10sdnNjb2RlLXJlbW90ZQ%3D%3D?line=0) #define parameters
      [2](vscode-notebook-cell://ssh-remote%2B192.168.1.2/home/huang/PyCode/scRNA/VIA/VIA-master/Jupyter%20Notebooks/Basic%20tutorial.ipynb#X10sdnNjb2RlLXJlbW90ZQ%3D%3D?line=1) ncomps, knn, random_seed, dataset, root_user  =30,20, 42,'toy', ['M1']
----> [4](vscode-notebook-cell://ssh-remote%2B192.168.1.2/home/huang/PyCode/scRNA/VIA/VIA-master/Jupyter%20Notebooks/Basic%20tutorial.ipynb#X10sdnNjb2RlLXJlbW90ZQ%3D%3D?line=3) v0 = VIA(adata_counts.obsm['X_pca'][:, 0:ncomps], true_label, dist_std_local=1,
      [5](vscode-notebook-cell://ssh-remote%2B192.168.1.2/home/huang/PyCode/scRNA/VIA/VIA-master/Jupyter%20Notebooks/Basic%20tutorial.ipynb#X10sdnNjb2RlLXJlbW90ZQ%3D%3D?line=4)              knn=knn, cluster_graph_pruning_std=1, too_big_factor=0.3, root_user=root_user, preserve_disconnected=True, dataset='group',
      [6](vscode-notebook-cell://ssh-remote%2B192.168.1.2/home/huang/PyCode/scRNA/VIA/VIA-master/Jupyter%20Notebooks/Basic%20tutorial.ipynb#X10sdnNjb2RlLXJlbW90ZQ%3D%3D?line=5)              random_seed=random_seed)#, piegraph_arrow_head_width=0.2,             piegraph_edgeweight_scalingfactor=1.0)  
      [7](vscode-notebook-cell://ssh-remote%2B192.168.1.2/home/huang/PyCode/scRNA/VIA/VIA-master/Jupyter%20Notebooks/Basic%20tutorial.ipynb#X10sdnNjb2RlLXJlbW90ZQ%3D%3D?line=6) v0.run_VIA()

TypeError: __init__() got an unexpected keyword argument 'dist_std_local'

My python is 3.8.18 and pyVIA version is 0.1.94. The pyVIA version is the latest version following by pypi(https://pypi.org/project/pyVIA/) and github repository setup.py. May be version 2 is not upload?

(via) huang@yu:~/PyCode/scRNA/VIA/VIA-master/Jupyter Notebooks$ pip list | grep pyVIA
pyVIA                     0.1.94
(via) huang@yu:~/PyCode/scRNA/VIA/VIA-master/Jupyter Notebooks$ python
Python 3.8.18 | packaged by conda-forge | (default, Oct 10 2023, 15:44:36)

I enter into the core.py VIA.init(...) where no parameter jac_std_global and cluster_graph_pruning_std appear.May be wrong source code version is uploaded? I will be pleasure to get your response.

About running and extract the result

Hi again,

I followed the jupyter example and found that there are different versions of function to run the VIA; via_wrapper, via.draw_trajectory_gams, or via.VIA etc. I have datasets and want to infer the trajectory using VIA just being doubt about which one suits the most?

Additionally, after running the via_wrapper there are several plots being generated. Is the one named pseudotime the main result that inferred from VIA? And how to save one of diagram(i.e. the pseudotime plot)?

Thank you in advance!

TypeError: 'NoneType' object is not subscriptable

Thank you for this amazing tool!
I was testing Basic tutorial in docs and met this error:

f,ax = plot_edge_bundle(via_object=v0, n_milestones=50, linewidth_bundle=1.5, alpha_bundle_factor=2,
cmap='plasma', facecolor='white', size_scatter=15, alpha_scatter=0.2, scale_scatter_size_pop=True,
extra_title_text='', headwidth_bundle=0.5, lineage_pathway = [4,7,8], text_labels=False, sc_labels=true_label)
f.set_size_inches(15,4)

2023-09-14 15:20:35.211221 Computing Edges
2023-09-14 15:20:35.211722 WARNING: VIA will now autocompute an embedding. It would be better to precompute an embedding using embedding = via_umap() or via_mds() and setting this as the embedding attribute via_object = embedding.
2023-09-14 15:20:35.211722 Commencing Via-MDS
2023-09-14 15:20:35.211722 Resetting n_milestones to 1000 as n_samples > original n_milestones
2023-09-14 15:20:35.472721 Start computing with diffusion power:1
2023-09-14 15:20:35.490731 Starting MDS on milestone
2023-09-14 15:20:35.949219 End computing mds with diffusion power:1
2023-09-14 15:20:35.951221 Start finding milestones
2023-09-14 15:20:36.107220 End milestones with 50
2023-09-14 15:20:36.109223 Recompute weights
2023-09-14 15:20:36.111220 pruning milestone graph based on recomputed weights
2023-09-14 15:20:36.112220 Graph has 1 connected components before pruning
2023-09-14 15:20:36.112721 Graph has 1 connected components after pruning
2023-09-14 15:20:36.112721 Graph has 1 connected components after reconnecting
2023-09-14 15:20:36.113721 regenerate igraph on pruned edges
2023-09-14 15:20:36.121721 Setting numeric label as time_series_labels or other sequential metadata for coloring edges
2023-09-14 15:20:36.128221 Making smooth edges
location of 4 is at [0] and 0

TypeError Traceback (most recent call last)
~\AppData\Local\Temp\ipykernel_24624\1755887396.py in
1 f,ax = plot_edge_bundle(via_object=v0, n_milestones=50, linewidth_bundle=1.5, alpha_bundle_factor=2,
2 cmap='plasma', facecolor='white', size_scatter=15, alpha_scatter=0.2, scale_scatter_size_pop=True,
----> 3 extra_title_text='', headwidth_bundle=0.5, lineage_pathway = [4,7,8], text_labels=False, sc_labels=true_label)
4 f.set_size_inches(15,4)

~\AppData\Roaming\Python\Python37\site-packages\pyVIA\plotting_via.py in plot_edge_bundle(hammerbundle_dict, via_object, alpha_bundle_factor, linewidth_bundle, facecolor, cmap, extra_title_text, size_scatter, alpha_scatter, headwidth_bundle, headwidth_alpha, arrow_frequency, show_arrow, sc_labels_sequential, sc_labels_expression, initial_bandwidth, decay, n_milestones, scale_scatter_size_pop, show_milestones, sc_labels, text_labels, lineage_pathway, dpi, fontsize_title, fontsize_labels, global_visual_pruning, use_sc_labels_sequential_for_direction, sc_scatter_size, sc_scatter_alpha)
1136 from matplotlib.patches import Rectangle
1137 sc_embedding = via_object.embedding
-> 1138 max_r = np.max(via_object.embedding[:, 0]) + 1
1139 max_l = np.min(via_object.embedding[:, 0]) - 1
1140

TypeError: 'NoneType' object is not subscriptable

Where is the mESC_7000perDay_noscaling_meso.csv file for Time Series Mesoderm Tutorial?

Hi,
I was not able to find the file, mESC_7000perDay_noscaling_meso.csv, for the Time Series Mesoderm Tutorial anywhere in the VIA respository.
I did go back to the paper and noticed that the raw data came from reference 36. Maybe because I am not familiar with CyTOF, so I was also having difficulty finding the file there. I intend to use VIA to analyze a time series single cell RNAseq Data and want to work though the Time Series Tutorial.
Would you be able to upload mESC_7000perDay_noscaling_meso.csv that you used for the tutorial? or provide me link or direct me to the exact location to download the file.

Thanks for all the help

FileNotFoundError in VIA(embedding_type='via-umap')

Hi,

I am running Basic workflow and encountering the following error.

image

Looking at the source code, the following line seems to be causing the error

VIA/VIA/core.py

Line 1942 in 7e69c84

r2w_input = pd.read_csv('/home/shobi/Trajectory/Datasets/WagnerZebrafish/RW2/knn100_pc30_kseq50RW2_sparse_matrix5820.csv')

I can't imagine what is going on around this line. Why is it necessary to load the zebrafish dataset when running UMAP?

Note that changing embedding_type="via-mds" worked fine.

Arrow size meaning

Hello,

I have found VIA to be useful for my analysis since I am currently working on python(scanpy). I have used it in one of my datasets, but the size of the arrows is too big. Is there a way to control for that? Or maybe I am doing something totally wrong.

Here is what it looks like for the Pseudotime graph
image

Thank you for your help!

new release and beautify

Hi,

I am very interested in your excellent work!

I notice that there are only one release of VIA. Is VIA still under maintenance ? And, the plots in the jupytor tutorials are not beautiful, hope you to improve the visualization capacity of VIA. I am a scanpy user and usually process single cell data using python code. I think VIA maybe an suitable tools for trajectory inference.

sum of lineage probability

Hi,
The sum of branch probability given Palantir equals 1. It's accord with the principle of statistics. while I find the sum of branch probability given by VIA don't eqaul 1, how to interpret this probability ?
image

Importing VIA issue

Hello,
I successfully installed via using

pip install pybind11
pip install hnswlib
pip install pyVIA

However, when I am importing it, import pyVIA.core , it gives me following error:
ModuleNotFoundError: No module named 'utils_via'

Can I please know the possible issue?
Thanks in advance.

subPARC graph weight calculation

Hi again,

I am going through the code of run_subPARC and notice that:

  • When calling the make_csrmatrix_noselfloop function, the edge weights are calculated using 1. / distances + 0.01
  • Later in the run_subPARC, in case is_course == True you create a full (unpruned) graph but calculate the weights using 1./distances + 0.05.

Is there a specific reason why we would want these values to be different? (It changes the weight values quiet a bit)

root_user = None

Hey guys,
i'm using your tool for plotting the trajectory of single cell atac seq data. The visualisation is awesome, but i have a problem when i want to set the root_user = None. In the 'Basic usage tutorial' you explained it to set it None if the Group label of root is unknown. Tried it many times but always get this TypeError:

if (comp_i > len(self.root_user) - 1): root_user_ = 0

TypeError: object of type 'NoneType' has no len()

Hope you can help me with this problem. Or maybe you can give me a hint, how to get the root?

pseudotime reproducibility

Hi,
pyVIA version 0.1.58 introduce some new bugs. Now the pseudotime still cannot be reproduced (knn=100, cluster_graph_pruning=0.5, random_seed=42). Does random_seed function internally ? Besides, I cannot plot figures in my ipython. The background became black and x and y axis disappeared. it showed that:
In [1]: import pyVIA.core as via
/home/wangjw/programs/miniconda3/envs/py37/lib/python3.7/site-packages/phate/init.py

In [2]: plt.plot([1,2,3,],[1,2,3])
Out[2]: [<matplotlib.lines.Line2D at 0x7ff1f507f890>]

image

passing your own cluster labels: VIA performance with different clustering methods.

Hi Shobi,

Excellent work here!! I have a question, rather than an issue. I want to pass cluster labels from a separate clustering, how do I do that. This is also referenced in the article supplementary material - Supplementary Note 6: VIA performance with different clustering methods.

I am using for exploratory purposes with entirely new kind of cell types, so I do not know much about the population. I would like to understand that first and then pass it on to VIA. Do you have it referenced anywhere or maybe an example?

Thank you
Adi

Install instructions

Hi there,
Just wanted to note that in order to get the package to install, you currently need to mv VIA directory to pyVIA
Keep up the great work!
Matthew

Problems installing package

Hi there,

I have been trying to install the package on both windows (11) computer and a mac computer. In both cases once the library is installed it fails to import because palantir is not installed (which itself fails in installation on MulticoreTSNE).

Why is palantir required for VIA?

>>> import pyVIA.core as via
Traceback (most recent call last):
  File "<stdin>", line 1, in <module>
  File ".....................ViaEnv\lib\site-packages\pyVIA\__init__.py", line 1, in <module>
    from . import core
  File "................\ViaEnv\lib\site-packages\pyVIA\core.py", line 27, in <module>
    import palantir # /home/shobi/anaconda3/envs/ViaEnv/lib/python3.7/site-packages/palantir
ModuleNotFoundError: No module named 'palantir'

The pseudotime value is NAN

Hi,
Thank you so much for your great and helpful tool!
I'd like to use pyVIA to do trajectory analysis and my raw data is 95*5893(obs * features).
After PCA, I use top 20 PCs for trajectory analysis. And my code is:
ncomps=20
knn=6
v0_random_seed=4
root_user = ['M1']
true_label = adata.obs['lesion']
v0 = via.VIA(adata.obsm['X_pca'][:, 0:ncomps], true_label, jac_std_global=1.5, cluster_graph_pruning_std=0.15, dist_std_local=1, knn=knn, too_big_factor=0.3, root_user=root_user, preserve_disconnected=True, do_impute_bool=True, dataset='toy', is_coarse=True,pseudotime_threshold_TS=20, neighboring_terminal_states_threshold=1, piegraph_edgeweight_scalingfactor=1.0, piegraph_arrow_head_width=0.1, max_visual_outgoing_edges=1)

However, when I set knn=6, I got the error message:
image

you may notice the strange blue circle in the figure labeled node label and the trajectory score is nan:

image

But the strange thing is, when I change the parameter knn, at some values it didn't raise the error.
I have no idea about the problem, maybe the rowsum of my mat has zero value? I try to confirm the guess, but it's not:
image

Any advice is helpful! And your early reply is much appreciated!
Sorry for any inconvenience caused!

Best regards
Arial

Using cell idents as root instead of index

Hello,

Thank you so much for writing an alternative to the current Pseudotime packages already available, so fair I am finding VIA very friendly and helpful. I have already applied VIA to a single-celldataset that I have and I was wondering if it could be possible to set the root_user with cell idents instead of Indexes? Or is there a specific reason we want o use indexes?

I tried:
root_user =['cell type_X']

But I get:
list indices must be integers or slices, not str

Thank you for your help!

Color scheme in via_streamplot

Hi,

I am trying to set a specific color palette for the via_streamplot(), but I haven't found out how to do it. The thing is in the via.plot_scatter() there is an argument named color_dict where you can input a dict with the existing labels and a color code for that label, but there's not the same option in via_streamplot().

Any idea?

Error running VIA on generic disconnected datasets

Hi,

I am trying to run VIA on a generic disconnected dataset using the following code as outlined in the README file:

v0 = via.VIA(
    preprocessed_data.obsm['X_pca'],
    preprocessed_data.obs['gt_clusters'],
    jac_std_global=0.15,
    dist_std_local=1,
    knn=30,
    too_big_factor=0.3,
    root_user=start_ids,
    dataset='',
    random_seed=0,
    resolution_parameter=resolution,
    preserve_disconnected=True
)
v0.run_VIA()

However I am getting the following stacktrace:

input data has shape 1966 (samples) x 10 (features)
time is Sun Nov  7 07:49:15 2021
commencing global pruning
Share of edges kept after Global Pruning 50.81 %
number of components in the original full graph 2
for downstream visualization purposes we are also constructing a low knn-graph 
size neighbor array in low-KNN in pca-space for visualization (1966, 4)
commencing community detection
time is Sun Nov  7 07:49:16 2021
12  clusters before handling small/big
There are 0 clusters that are too big
 : global cluster graph pruning level 0.15
number of components before pruning 2
number of connected componnents after reconnecting  2
percentage links trimmed from local pruning relative to start 0.0
percentage links trimmed from global pruning relative to start 37.5
there are  2 components in the graph
root user [877, 1717]
start computing lazy-teleporting Expected Hitting Times
/usr/local/lib/python3.7/dist-packages/scipy/sparse/_index.py:82: SparseEfficiencyWarning: Changing the sparsity structure of a csr_matrix is expensive. lil_matrix is more efficient.
  self._set_intXint(row, col, x.flat[0])
ended all multiprocesses, will retrieve and reshape
closeness  shortlist [0, 4, 6]
betweeness shortlist [0, 4]
out degree shortlist [0, 3, 5, 6]
terminal clus in this component [0, 6]
final terminal clus [0, 9]
From root 4  to Terminal state 0 is found 500  times.
From root 4  to Terminal state 6 is found 500  times.
/usr/local/lib/python3.7/dist-packages/pyVIA/core.py:2901: RuntimeWarning: invalid value encountered in true_divide
  bp_array = bp_array / bp_array.sum(axis=1)[:, None]
---------------------------------------------------------------------------
IndexError                                Traceback (most recent call last)
<ipython-input-175-01a58e604d64> in <module>()
      1 v0 = via.VIA(preprocessed_data.obsm['X_pca'], preprocessed_data.obs['gt_clusters'], jac_std_global=0.15, dist_std_local=1, knn=30,
      2              too_big_factor=0.3, root_user=start_ids, dataset='', random_seed=0, resolution_parameter=resolution)  # *.4 root=1,
----> 3 v0.run_VIA()

2 frames
/usr/local/lib/python3.7/dist-packages/pyVIA/core.py in run_VIA(self)
   3362         # Query dataset, k - number of closest elements (returns 2 numpy arrays)
   3363 
-> 3364         self.run_subPARC()
   3365         run_time = time.time() - time_start_total
   3366         print('time elapsed {:.1f} seconds'.format(run_time))

/usr/local/lib/python3.7/dist-packages/pyVIA/core.py in run_subPARC(self)
   2707                                                                                                         sc_labels_subi,
   2708                                                                                                         root_generic,
-> 2709                                                                                                         sc_truelabels_subi)
   2710 
   2711             self.root.append(root_i)

/usr/local/lib/python3.7/dist-packages/pyVIA/core.py in find_root_bcell(self, graph_dense, PARC_labels_leiden, root_user, true_labels)
   1987 
   1988             graph_node_label.append(str(majority_truth) + 'c' + str(cluster_i))
-> 1989         root = PARC_labels_leiden[root_user]
   1990         return graph_node_label, majority_truth_labels, deg_list, root
   1991 

IndexError: list index out of range

FWIW, the same code works fine for multifurcating datasets so I'm not sure if I'm missing something. Anyhelp would be appreciated!

ATAC tutorial

Congratulations on the wonderful-looking update on VIA.

This is my first time trying to use VIA (or StaVia), and it seems like the tutorial for [scATAC-seq Hematopoiesis] link is not working correctly yet. Will it be available soon? I am mostly interested in scATAC-based trajectory analysis and also wonder whether typically preprocessed scATAC data using Signac or ArchR would be applicable.

Thanks!

VIA function

Hello, do you need to de-batch the merged data and then use the VIA function?

plot_scatter() function problem

Hi,

When calling the plot_scatter function that is supposed to be in the plotting_via module, it does not exist. The code:

import pyVIA.plotting_via
plotting_via.plot_scatter(embedding = embedding, labels = v0.true_label)
This last line reports: module 'pyVIA.plotting_via' has no attribute 'plot_scatter'

I thought it was a version problem, but I have installed the latest one. Another option is copying the definition of this function in plotting_via.py, but I would like to know why there's this problem.

Thanks!

timeseries/timelabel aided analysis

Hey, first thank you for an interesting package!

I am aiming to perform a timelabel aided analysis building up on:
https://pyvia.readthedocs.io/en/latest/notebooks/mESC_timeseries.html

Could you provide or point towards the csv file used in this example, so I can follow the data structure and confirm everything runs well.

Additionally, is there also an example workflow for a timelabel based trajectory computation based on scRNAseq data?

Thank you for your time and all the best
Timm

Zero-size array to reduction operation

Hi again,

I'm trying to use VIA to find trajectories in a small 2D (PHATE) embedding. The data itself is not single cell but is derived from a single cell dataset. Based on the analysis I suspect several connected trajectories as well as a couple of disconnected ones. Since I do not have any real true_label to give these data points I am passing [0,.....,0].

X = np.loadtxt("input_data.csv", skiprows=1, delimiter=",")
v0 = via.VIA(X, [0]*X.shape[0], knn=5, root_user=[1], is_coarse=True, preserve_disconnected=False) 
v0.run_VIA()

The above code outputs the following logs:

input data has shape 400 (samples) x 2 (features)
class <class 'numpy.ndarray'>
time is Mon Jan 17 11:04:47 2022
commencing global pruning
Share of edges kept after Global Pruning 46.58 %
number of components in the original full graph 5
for downstream visualization purposes we are also constructing a low knn-graph
size neighbor array in low-KNN in pca-space for visualization (400, 5)
commencing community detection
time is Mon Jan 17 11:04:47 2022
163 clusters before handling small/big
There are 0 clusters that are too big
humanCD34 : global cluster graph pruning level 0.15
number of components before pruning 5

And then fails with the error

ValueError Traceback (most recent call last)
~\AppData\Local\Temp/ipykernel_19348/1204227179.py in
2
3 v0 = via.VIA(X, [0]*X.shape[0], knn=5, root_user=[1], is_coarse=True, preserve_disconnected=False)
----> 4 v0.run_VIA()
5
6 # tsi_list = via.get_loc_terminal_states(v0, X_in)
~\anaconda3\envs\ViaEnv\lib\site-packages\pyVIA\core.py in run_VIA(self)
3508 # Query dataset, k - number of closest elements (returns 2 numpy arrays)
3509
-> 3510 self.run_subPARC()
3511 run_time = time.time() - time_start_total
3512 print('time elapsed {:.1f} seconds'.format(run_time))
~\anaconda3\envs\ViaEnv\lib\site-packages\pyVIA\core.py in run_subPARC(self)
2681 global_pruning_std=global_pruning_std,
2682 preserve_disconnected=self.preserve_disconnected,
-> 2683 preserve_disconnected_after_pruning=self.preserve_disconnected_after_pruning)
2684 self.connected_comp_labels = comp_labels
2685
~\anaconda3\envs\ViaEnv\lib\site-packages\pyVIA\core.py in pruning_clustergraph(adjacency_matrix, global_pruning_std, max_outgoing, preserve_disconnected, preserve_disconnected_after_pruning)
1064
1065 if (n_components > 1) & (preserve_disconnected == False):
-> 1066 cluster_graph_csr = connect_all_components(Tcsr, cluster_graph_csr, adjacency_matrix)
1067 n_components, comp_labels = connected_components(csgraph=cluster_graph_csr, directed=False, return_labels=True)
1068
~\anaconda3\envs\ViaEnv\lib\site-packages\pyVIA\core.py in connect_all_components(MSTcsr, cluster_graph_csr, adjacency_matrix)
960 sub_td = MSTcsr[comp_labels == 0, :][:, comp_labels != 0]
961 # print('minimum value of link connecting components', np.min(sub_td.data))
--> 962 locxy = scipy.sparse.find(MSTcsr == np.min(sub_td.data))
963 for i in range(len(locxy[0])):
964 if (comp_labels[locxy[0][i]] == 0) & (comp_labels[locxy[1][i]] != 0):
<array_function internals> in amin(*args, **kwargs)
~\anaconda3\envs\ViaEnv\lib\site-packages\numpy\core\fromnumeric.py in amin(a, axis, out, keepdims, initial, where)
2857 """
2858 return _wrapreduction(a, np.minimum, 'min', axis, None, out,
-> 2859 keepdims=keepdims, initial=initial, where=where)
2860
2861
~\anaconda3\envs\ViaEnv\lib\site-packages\numpy\core\fromnumeric.py in _wrapreduction(obj, ufunc, method, axis, dtype, out, **kwargs)
85 return reduction(axis=axis, out=out, **passkwargs)
86
---> 87 return ufunc.reduce(obj, axis, dtype, out, **passkwargs)
88
89
ValueError: zero-size array to reduction operation minimum which has no identity

I am not able to figure out what is causing this error and how to fix it.

In addition, along the way I found two minor bugs:

  • If a dataset name is not passed the log prints "humanCD34" instead of not printing a name.
  • The sc_ATAX-seq_HumanHematopoesis notebook passes a do_magic_bool argument to via.VIA which does not exissts.

streamplot error

Hi,
When I ran streamplot on my own data, an error occured:
IndexError: boolean index did not match indexed array along dimension 0; dimension is 18166 but corresponding boolean dimension is 29. But streamplot worked well on toydataset. Can you help ? Does it relate to cell barcode (it's like ATGCAAAAATGC-1 in my data, not integer)?
In [5]: via.via_streamplot(v0, embedding)
/home/wangjw/programs/miniconda3/envs/py37/lib/python3.7/site-packages/scipy/sparse/_index.py:125: SparseEfficiencyWarning: Changing the sparsity structure of a csr_matrix is expensive. lil_matrix is more efficient.
self._set_arrayXarray(i, j, x)
/home/wangjw/programs/miniconda3/envs/py37/lib/python3.7/site-packages/pyVIA/core.py:1030: RuntimeWarning: divide by zero encountered in true_divide
T = T.multiply(csr_matrix(1.0 / np.abs(T).sum(1))) # rows sum to one
/home/wangjw/programs/miniconda3/envs/py37/lib/python3.7/site-packages/pyVIA/core.py:1056: ImplicitModificationWarning: Trying to modify attribute .obsm of view, initializing view as actual.
dX[np.isnan(dX)] = 0 # zero diff in a steady-state

IndexError Traceback (most recent call last)
in
----> 1 via.via_streamplot(v0, embedding)

~/programs/miniconda3/envs/py37/lib/python3.7/site-packages/pyVIA/plotting_via.py in via_streamplot(via_coarse, embedding, density_grid, arrow_size, arrow_color, arrow_style, max_length, linewidth, min_mass, cutoff_perc, scatter_size, scatter_alpha, marker_edgewidth, density_stream, smooth_transition, smooth_grid, color_scheme, add_outline_clusters, cluster_outline_edgewidth, gp_color, bg_color, dpi, title, b_bias, n_neighbors_velocity_grid, other_labels, use_sequentially_augmented, cmap_str)
1432 if embedding is None: embedding = via_coarse.embedding
1433
-> 1434 V_emb = via_coarse._velocity_embedding(embedding, smooth_transition,b=b_bias, use_sequentially_augmented=use_sequentially_augmented)
1435
1436 V_emb *=20 #5

~/programs/miniconda3/envs/py37/lib/python3.7/site-packages/pyVIA/core.py in _velocity_embedding(self, X_emb, smooth_transition, b, use_sequentially_augmented)
1054
1055 #dX /= np.sqrt(dX.multiply(dX).sum(axis=1).A1)[:, None]
-> 1056 dX[np.isnan(dX)] = 0 # zero diff in a steady-state
1057 #neighbor edge weights are used to weight the overall dX or velocity from cell i.
1058 probs = T[i].data

~/programs/miniconda3/envs/py37/lib/python3.7/site-packages/anndata/_core/views.py in setitem(self, idx, value)
33 )
34 with self._update() as container:
---> 35 container[idx] = value
36
37 @contextmanager

IndexError: boolean index did not match indexed array along dimension 0; dimension is 18166 but corresponding boolean dimension is 29

clustering resolution

Hi,
We can set resolution in leiden clustering to control the number of clusters. Does VIA has a similar parameters ? I find that PARC identify a lot more clusters than leiden by default.

Documentation

I find it difficult to understand how the package works, how to set the different parameters and which attribute is set in which operation. Is it possible to add function documentation and type hinting to the main functions?

Tutorial for high dimensional cytometry data

Hi,

I'd like to use pyVIA with flow cytometry data, could you add a tutorial for this kind of data?

Do you have some suggestion about parameters to set?

Thanks you in advance.

Simone

Arrow, directionality, line, smoothness

Hi,
Could you explain the meaning of the arrow direction and the line ? Besides, some lines are smoothly, but some are very sharp, how do you draw the line ?

Are they (lines) similar to paga and monocle3 ? Lines overlap well with the main path of the graph, while sometimes the lines of VIA deviate from the centroid of the scatter points, is there a way to make it beautiful ?
image

Recommend Projects

  • React photo React

    A declarative, efficient, and flexible JavaScript library for building user interfaces.

  • Vue.js photo Vue.js

    🖖 Vue.js is a progressive, incrementally-adoptable JavaScript framework for building UI on the web.

  • Typescript photo Typescript

    TypeScript is a superset of JavaScript that compiles to clean JavaScript output.

  • TensorFlow photo TensorFlow

    An Open Source Machine Learning Framework for Everyone

  • Django photo Django

    The Web framework for perfectionists with deadlines.

  • D3 photo D3

    Bring data to life with SVG, Canvas and HTML. 📊📈🎉

Recommend Topics

  • javascript

    JavaScript (JS) is a lightweight interpreted programming language with first-class functions.

  • web

    Some thing interesting about web. New door for the world.

  • server

    A server is a program made to process requests and deliver data to clients.

  • Machine learning

    Machine learning is a way of modeling and interpreting data that allows a piece of software to respond intelligently.

  • Game

    Some thing interesting about game, make everyone happy.

Recommend Org

  • Facebook photo Facebook

    We are working to build community through open source technology. NB: members must have two-factor auth.

  • Microsoft photo Microsoft

    Open source projects and samples from Microsoft.

  • Google photo Google

    Google ❤️ Open Source for everyone.

  • D3 photo D3

    Data-Driven Documents codes.