Giter VIP home page Giter VIP logo

spey's Introduction

Spey: smooth inference for reinterpretation studies

arxiv DOI DOI doc

Spey logo

github PyPI - Version tests workflow Documentation Status GitHub License

Outline

Installation

Spey can be found in PyPi library and can be downloaded using

pip install spey

If you like to use a specific branch, you can either use make install or pip install -e . after cloning the repository or use the following command:

python -m pip install --upgrade "git+https://github.com/SpeysideHEP/spey"

Note that main branch may not be the stable version.

What is Spey?

Spey is a plug-in-based statistics tool that aims to collect all likelihood prescriptions under one roof. This provides users with the workspace to freely combine different statistical models and study them through a single interface. In order to achieve a module that can be used both with statistical model prescriptions, which has been proposed in the past and will be used in the future, Spey uses a so-called plug-in system where developers can propose their statistical model prescriptions and allow Spey to use them.

What a plugin provides

A quick intro on the terminology of spey plugins in this section:

  • A plugin is an external Python package that provides additional statistical model prescriptions to spey.
  • Each plugin may provide one (or more) statistical model prescriptions that are accessible directly through Spey.
  • Depending on the scope of the plugin, you may wish to provide additional (custom) operations and differentiability through various autodif packages such as autograd or jax. As long as they are implemented through a set of predefined function names spey can automatically detect and use them within the interface.

Finally, the name "Spey" originally comes from the Spey River, a river in the mid-Highlands of Scotland. The area "Speyside" is famous for its smooth whiskey.

Currently available plug-ins

Accessor Description
"default_pdf.uncorrelated_background" Constructs uncorrelated multi-bin statistical model.
"default_pdf.correlated_background" Constructs correlated multi-bin statistical model with Gaussian nuisances.
"default_pdf.third_moment_expansion" Implements the skewness of the likelihood by using third moments.
"default_pdf.effective_sigma" Implements the skewness of the likelihood by using asymmetric uncertainties.
"default_pdf.poisson" Implements simple Poisson-based likelihood without uncertainties.
"default_pdf.normal" Implements Normal distribution.
"default_pdf.multivariate_normal" Implements Multivariate normal distribution.
"pyhf.uncorrelated_background" Uses uncorrelated background functionality of pyhf (see spey-phyf plugin).
"pyhf" Uses generic likelihood structure of pyhf (see spey-phyf plugin)

For details on all the backends, see the Plug-ins section of the documentation.

Quick Start

First one needs to choose which backend to work with. By default, spey is shipped with various types of likelihood prescriptions which can be checked via AvailableBackends function

import spey
print(spey.AvailableBackends())
# ['default_pdf.correlated_background',
#  'default_pdf.effective_sigma',
#  'default_pdf.third_moment_expansion',
#  'default_pdf.uncorrelated_background']

Using 'default_pdf.uncorrelated_background' one can simply create single or multi-bin statistical models:

pdf_wrapper = spey.get_backend('default_pdf.uncorrelated_background')

data = [1]
signal_yields = [0.5]
background_yields = [2.0]
background_unc = [1.1]

stat_model = pdf_wrapper(
    signal_yields=signal_yields,
    background_yields=background_yields,
    data=data,
    absolute_uncertainties=background_unc,
    analysis="single_bin",
    xsection=0.123,
)

where data indicates the observed events, signal_yields and background_yields represents yields for signal and background samples and background_unc shows the absolute uncertainties on the background events i.e. :math:2.0\pm1.1 in this particular case. Note that we also introduced analysis and xsection information which are optional where the analysis indicates a unique identifier for the statistical model, and xsection is the cross-section value of the signal, which is only used for the computation of the excluded cross-section value.

During the computation of any probability distribution, Spey relies on the so-called "expectation type". This can be set via spey.ExpectationType which includes three different expectation modes.

  • spey.ExpectationType.observed: Indicates that the computation of the log-probability will be achieved by fitting the statistical model on the experimental data. For the exclusion limit computation, this will tell the package to compute observed :math:1-CL_s values. spey.ExpectationType.observed has been set as default throughout the package.

  • spey.ExpectationType.aposteriori: This command will result in the same log-probability computation as spey.ExpectationType.observed. However, the expected exclusion limit will be computed by centralizing the statistical model on the background and checking :math:\pm1\sigma and :math:\pm2\sigma fluctuations.

  • spey.ExpectationType.apriori: Indicates that the observation has never taken place and the theoretical SM computation is the absolute truth. Thus, it replaces observed values in the statistical model with the background values and computes the log probability accordingly. Similar to spey.ExpectationType.aposteriori exclusion limit computation will return expected limits.

To compute the observed exclusion limit for the above example, one can type

for expectation in spey.ExpectationType:
    print(f"1-CLs ({expectation}): {stat_model.exclusion_confidence_level(expected=expectation)}")
# 1-CLs (apriori): [0.49026742260475775, 0.3571003642744075, 0.21302512037071475, 0.1756147641077802, 0.1756147641077802]
# 1-CLs (aposteriori): [0.6959976874809755, 0.5466491036450178, 0.3556261845401908, 0.2623335168616665, 0.2623335168616665]
# 1-CLs (observed): [0.40145846656558726]

Note that spey.ExpectationType.apriori and spey.ExpectationType.aposteriori expectation types resulted in a list of 5 elements which indicates $-2\sigma,\ -1\sigma,\ 0,\ +1\sigma,\ +2\sigma$ standard deviations from the background hypothesis. spey.ExpectationType.observed on the other hand resulted in single value which is the observed exclusion limit. Notice that the bounds on spey.ExpectationType.aposteriori are slightly stronger than spey.ExpectationType.apriori this is due to the data value has been replaced with background yields, which are larger than the observations. spey.ExpectationType.apriori is mostly used in theory collaborations to estimate the difference from the Standard Model rather than the experimental observations.

One can play the same game using the same backend for multi-bin histograms as follows;

pdf_wrapper = spey.get_backend('default_pdf.uncorrelated_background')

data = [36, 33]
signal = [12.0, 15.0]
background = [50.0,48.0]
background_unc = [12.0,16.0]

stat_model = pdf_wrapper(
    signal_yields=signal_yields,
    background_yields=background_yields,
    data=data,
    absolute_uncertainties=background_unc,
    analysis="multi_bin",
    xsection=0.123,
)

Note that our statistical model still represents individual bins of the histograms independently however it sums up the log-likelihood of each bin. Hence all bins are completely uncorrelated from each other. Computing the exclusion limits for each spey.ExpectationType will yield.

for expectation in spey.ExpectationType:
    print(f"1-CLs ({expectation}): {stat_model.exclusion_confidence_level(expected=expectation)}")
# 1-CLs (apriori): [0.971099302028661, 0.9151646569018123, 0.7747509673901924, 0.5058089246145081, 0.4365406649302913]
# 1-CLs (aposteriori): [0.9989818194986659, 0.9933308419577298, 0.9618669253593897, 0.8317680908087413, 0.5183060229282643]
# 1-CLs (observed): [0.9701795436411219]

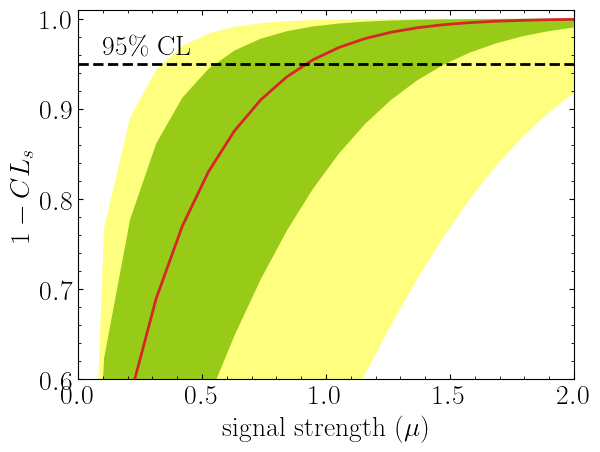
It is also possible to compute $1-CL_s$ value with respect to the parameter of interest, $\mu$. This can be achieved by including a value for poi_test argument.

Brazilian plot

import matplotlib.pyplot as plt
import numpy as np

poi = np.linspace(0,10,20)
poiUL = np.array([stat_model.exclusion_confidence_level(poi_test=p, expected=spey.ExpectationType.aposteriori) for p in poi])
plt.plot(poi, poiUL[:,2], color="tab:red")
plt.fill_between(poi, poiUL[:,1], poiUL[:,3], alpha=0.8, color="green", lw=0)
plt.fill_between(poi, poiUL[:,0], poiUL[:,4], alpha=0.5, color="yellow", lw=0)
plt.plot([0,10], [.95,.95], color="k", ls="dashed")
plt.xlabel(r"${\rm signal\ strength}\ (\mu)$")
plt.ylabel("$1-CL_s$")
plt.xlim([0,10])
plt.ylim([0.6,1.01])
plt.text(0.5,0.96, r"$95\%\ {\rm CL}$")
plt.show()

Here in the first line, we extract $1-CL_s$ values per POI for spey.ExpectationType.aposteriori expectation type, and we plot specific standard deviations, which provide the following plot:

The excluded value of POI can also be retrieved by spey.StatisticalModel.poi_upper_limitfunction, which is the exact point where the red-curve and black dashed line meet. The upper limit for the $\pm1\sigma$ or $\pm2\sigma$ bands can be extracted by settingexpected_pvalueto"1sigma"or"2sigma"`` respectively, e.g.

stat_model.poi_upper_limit(expected=spey.ExpectationType.aposteriori, expected_pvalue="1sigma")
# [0.5507713378348318, 0.9195052042538805, 1.4812721449679866]

At a lower level, one can extract the likelihood information for the statistical model by calling spey.StatisticalModel.likelihood and spey.StatisticalModel.maximize_likelihood functions. By default, these will return negative log-likelihood values, but this can be changed via return_nll=False argument.

muhat_obs, maxllhd_obs = stat_model.maximize_likelihood(return_nll=False, )
muhat_apri, maxllhd_apri = stat_model.maximize_likelihood(return_nll=False, expected=spey.ExpectationType.apriori)

poi = np.linspace(-3,4,60)

llhd_obs = np.array([stat_model.likelihood(p, return_nll=False) for p in poi])
llhd_apri = np.array([stat_model.likelihood(p, expected=spey.ExpectationType.apriori, return_nll=False) for p in poi])

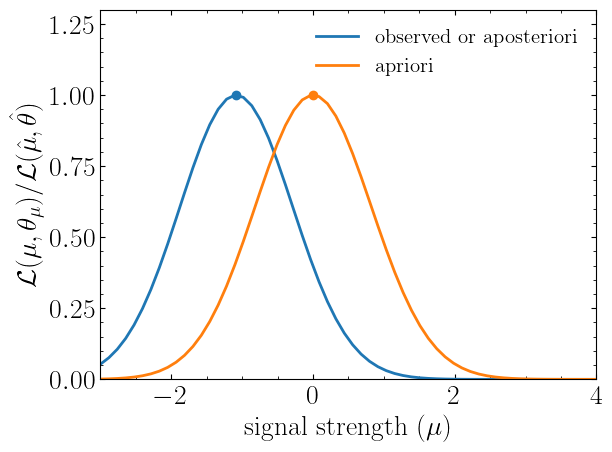
Here, in the first two lines, we extracted the maximum likelihood and the POI value that maximizes the likelihood for two different expectation types. In the following, we computed likelihood distribution for various POI values, which then can be plotted as follows

Brazilian plot

plt.plot(poi, llhd_obs/maxllhd_obs, label=r"${\rm observed\ or\ aposteriori}$")
plt.plot(poi, llhd_apri/maxllhd_apri, label=r"${\rm apriori}$")
plt.scatter(muhat_obs, 1)
plt.scatter(muhat_apri, 1)
plt.legend(loc="upper right")
plt.ylabel(r"$\mathcal{L}(\mu,\theta_\mu)/\mathcal{L}(\hat\mu,\hat\theta)$")
plt.xlabel(r"${\rm signal\ strength}\ (\mu)$")
plt.ylim([0,1.3])
plt.xlim([-3,4])
plt.show()

Notice the slight difference between likelihood distributions; this is because of the use of different expectation types. The dots on the likelihood distribution represent the point where the likelihood is maximized. Since for a spey.ExpectationType.apriori likelihood distribution observed and background values are the same, the likelihood should peak at $\mu=0$.

spey's People

Contributors

jackaraz avatar

Stargazers

 avatar  avatar  avatar  avatar  avatar  avatar

Watchers

 avatar  avatar

Forkers

apn-pucky

spey's Issues

Enable computation of p-values from chi-square CDF

Feature details

One can compute the exclusion limits using $\chi^2$ values by computing its CDF with respect to the DOF of the statistical model. This will allow users to compute p-values without the asymptotic formulae or generating toy models. This is especially useful if the model description does not allow for generating data.

Implementation

Extend exclusion limit computer with $\chi^2$ method using the following example

>>> from scipy.stats import chisqprob, chi2
>>> chisqprob(3.84,1)
... 0.050043521248705189
>>> 1 - chi2.cdf(3.84,1)
... 0.050043521248705147

How important would you say this feature is?

2: Somewhat important.

Additional information

No response

Error in ```UnCorrStatisticsCombiner```

System Settings

All systems

Describe the bug

After the latest updates, UnCorrStatisticsCombiner has become an abstract method since it doesn't have the is_chi_square_calculator_available attribute.

To Reproduce

Execute the class.

Expected behaviour

No response

Additional information

No response

maxiter

System Settings

In hypotest_base.py poi_upper_limit (line 742), maxiter is an argument separate from kwargs, which means
it gets taken out of kwargs and thus not passed on to the estimate of muhat, in _prepare_for_hypotest. maybe
you always leave maxiter in kwargs, so it gets passed on also to the maximization?
[ oh and just an internal naming convention but i would not call upper limits computations hypothesis tests. ]

Describe the bug

No response

To Reproduce

No response

Expected behaviour

No response

Additional information

No response

Differences between SModelS and MadStats upper limit on mu with pyhf backend

System Settings

Fedora Linux 35
Python 3.9.12

Describe the bug

SModelS ulcomputer.getUpperLimitOnMu() and MadStats stat_model.computeUpperLimitOnMu() functions do not give exactly the same results.
So far the maximum difference I found between the two outputs was around 3%, but it is possible that for other models it becomes larger.
(The CLs seem to always be the same on the other hand.)

To Reproduce

import json, jsonpatch, pyhf, madstats, copy
from smodels.tools.srCombinations import _getPyhfComputer
from smodels.experiment.databaseObj import Database
from smodels.experiment.datasetObj import CombinedDataSet


### SModelS

db = Database('./smodels-database')
expResult = db.getExpResults(analysisIDs=['ATLAS-SUSY-2019-08'],dataTypes=['efficiencyMap'])[0]
combinedDataset = CombinedDataSet(expResult)
nsig = [0.64171013584248, 0.20151994828896, 0.36729875457036, 2.12157276118776, 2.4906940927291803, 2.2180703508504, 1.0707552361033201, 2.1970845124999197, 3.5842286295059407]
ulcomputer = _getPyhfComputer(combinedDataset, nsig)

patch = [{'op': 'add', 'path': '/channels/5/samples/0', 'value': {'data': [0.04308822678442124, 0.013531245259294129, 0.02466261813643536], 'modifiers': [{'data': None, 'type': 'normfactor', 'name': 'mu_SIG'}, {'data': None, 'type': 'lumi', 'name': 'lumi'}], 'name': 'bsm'}}, {'op': 'add', 'path': '/channels/6/samples/0', 'value': {'data': [0.14245498577592744, 0.16723998254638267, 0.14893440661610954], 'modifiers': [{'data': None, 'type': 'normfactor', 'name': 'mu_SIG'}, {'data': None, 'type': 'lumi', 'name': 'lumi'}], 'name': 'bsm'}}, {'op': 'add', 'path': '/channels/7/samples/0', 'value': {'data': [0.0718968610075867, 0.1475252928876509, 0.24066638098619197], 'modifiers': [{'data': None, 'type': 'normfactor', 'name': 'mu_SIG'}, {'data': None, 'type': 'lumi', 'name': 'lumi'}], 'name': 'bsm'}}]

with open("smodels/tim_db/13TeV/ATLAS/ATLAS-SUSY-2019-08-eff/BkgOnly.json","r") as f:
    jsonFile = copy.deepcopy(json.load(f))
f.close()

wsDict = jsonpatch.apply_patch(jsonFile, patch)
workspace = pyhf.Workspace(wsDict)

msettings = {
    "normsys": {"interpcode": "code4"},
    "histosys": {"interpcode": "code4p"},
}

model = workspace.model(modifier_settings=msettings)

args = {"test_stat":"qtilde"}

muUL_pyhfOnly = ulcomputer.getUpperLimitOnMu()

print("Pyhf only, muUL:",muUL_pyhfOnly)


### MadStats

signal = patch
background = jsonFile

xsec = 7.19E-03 #fb

stat_model = madstats.get_multi_region_statistical_model(
    analysis="atlas_susy_2019_08",
    signal=signal,
    background=background,
    xsection=xsec*0.001
)

MS_muUL = stat_model.computeUpperLimitOnMu()
print(f"Upper limit on POI : {MS_muUL}")

print("Difference on muUL:",(muUL_pyhfOnly-MS_muUL)*100/muUL_pyhfOnly,"%")

Expected behaviour

Same results from the two outputs.

Additional information

The patch and the signal yields were computed with SModelS (using the TChiWH_350_180_350_180.slha file) and I cannot attach it due to its file type.
Same for the background only statistical model of the analysis (ATLAS-SUSY-2019-08).

How to improve the exclusion limit calculation?

Question

Hi Jack,
I am trying to recast the exclusion limit on cross-section calculated in the ATLAS analysis for diphoton resonance search: https://arxiv.org/pdf/2102.13405.pdf
I am unable to match my result with the official ATLAS result. For instance, the ATLAS result is 1.1 fb for mass 400 GeV, and I am getting 1.65 fb. I am using the backend 'default_pdf.uncorrelated_background', and no uncertainty on the background. I'm getting a relaxed limit (2.32 fb) using statistical uncertainty. If I use other uncertainty, my result will deviate more from the ATLAS result.
Please suggest some way to improve my result or to check what is wrong in my calculation. If you need more details, I will share the code and data that I'm using.
Usually, how much mismatch is acceptable in such a calculation?

Thanks for your reply!

Error when computing likelihood from uncorrelated model with an absurdly high number of observed yields.

System Settings

Fedora Linux 35
python v.3.9.12
spey commit 872edff

Describe the bug

When I try to compute the likelihood with a 1 SR model with absurdly high number of observed yields I get the following error:

File "/home/pascal/SModelS/spey/src/spey/interface/statistical_model.py", line 109, in likelihood
    twice_nll, _ = fit(
  File "/home/pascal/SModelS/spey/src/spey/optimizer/core.py", line 31, in fit
    return minimize(
  File "/home/pascal/SModelS/spey/src/spey/optimizer/scipy_tools.py", line 72, in minimize
    bounds[bdx] = (bounds[bdx][0] * 10.0, bounds[bdx][1] * 10.0)
TypeError: list indices must be integers or slices, not tuple

I did not really dig up the reason of the error and if it can actually happen in a realistic case, but in doubt I share it with you.
I also tried to reasonably change the bounds of the model (i.e. order of magnitude 100) but it didn't work.

The error shows up for both simplified_likelihoods and pyhf backends.

To Reproduce

import spey

statModel = spey.get_uncorrelated_region_statistical_model(observations=1e20,
                                                           backgrounds=2.2,
                                                           background_uncertainty=1.1,
                                                           signal_yields=2.,
                                                           xsection=None,
                                                           analysis="Test",
                                                           backend="simplified_likelihoods" # or "pyhf"
                                                           )

llhd = statModel.likelihood(poi_test=1.,return_nll=False)

Expected behaviour

A likelihood of 0.

Additional information

No response

Wrong poi_upper_limit computation with pyhf backend

System Settings

Fedora Linux 35
Python 3.9.12
spey 0.0.1

Describe the bug

The value of the poi upper limitreturned by poi_upper_limit() is not the one that gives a CLs of 0.05 when using the pyhf backend.
This happens when get_multi_region_statistical_model() is called with a single SR.

To Reproduce

import spey, pyhf, jsonpatch, scipy

### Model definition
patch = [dict(
            op='add',
            path='/channels/0/samples/0',
            value=dict(
                name='sig',
                data=[0.4],
                modifiers=[
                    dict(
                        name='lumi',
                        type='lumi',
                        data=None
                    ),
                    dict(
                        name='mu_SIG',
                        type='normfactor',
                        data=None
                    )
                ]
            )
        )]

bkg = {
  "channels": [
    {
      "name": "SR1",
      "samples": [
        {
          "name": "bkg",
          "data": [
            0.8
          ],
          "modifiers": [
            {
              "data": None,
              "type": "lumi",
              "name": "lumi"
            }
          ]
        }
      ]
    }
  ],
  "measurements": [
    {
      "name": "BasicMeasurement",
      "config": {
        "poi": "mu_SIG",
        "parameters": [
          {
            "auxdata": [
              1
            ],
            "bounds": [
              [
                0.915,
                1.085
              ]
            ],
            "inits": [
              1
            ],
            "sigmas": [
              0.017
            ],
            "name": "lumi"
          }
        ]
      }
    }
  ],
  "observations": [
    {
      "name": "SR1",
      "data": [
        10
      ]
    }
  ],
  "version": "1.0.0"
}

### Getting the poi upper limit with spey
statModel = spey.get_multi_region_statistical_model("test",patch,bkg)
mu_ul_spey = statModel.poi_upper_limit(expected=spey.ExpectationType.observed,allow_negative_signal=True)
print(mu_ul_spey)

### Creation of the model
wsDict = jsonpatch.apply_patch(bkg, patch)
workspace = pyhf.Workspace(wsDict)
msettings = {'normsys': {'interpcode': 'code4'}, 'histosys': {'interpcode': 'code4p'}}
model = workspace.model(modifier_settings=msettings)

args={}
bounds = model.config.suggested_bounds()
bounds[model.config.poi_index] = [0,100]
args["par_bounds"] = bounds
args["return_expected"] = False
pver = float ( pyhf.__version__[:3] )
args["test_stat"] = "qtilde"

### Check if the upper limit on mu returned by spey is the correct one, i.e. is the one that gives a CLs of 0.05
CLs_spey = pyhf.infer.hypotest(mu_ul_spey, workspace.data(model), model, **args )
### It gives not 0.05 but 0.5
print(CLs_spey)

### Check if the problem really comes from poi_upper_limit
### Compute the poi upper limit via a simple script

### Define the function that must be 0 when the poi reaches its upper limit
def CLs_root_pyhf(mu, data, model, args):
    return 0.05 - float(pyhf.infer.hypotest(mu, data, model, **args))

data = workspace.data(model)
low = 0.1
high = 1.
while True:
    CLs_low = CLs_root_pyhf(low, data, model, args)
    CLs_high = CLs_root_pyhf(high, data, model, args)
    if CLs_low < 0 and CLs_high > 0:
        break
    elif CLs_low < 0 and CLs_high < 0:
        high *= 2.
    elif CLs_low > 0 and CLs_high > 0:
        low *= 1/2.
### Lower bound found for starting the Brent 's bracketing
print(CLs_low)
### Upper bound found for starting the Brent 's bracketing
print(CLs_high)
mu_ul_pyhf = scipy.optimize.brentq(lambda mu: CLs_root_pyhf(mu, data, model, args), low, high, rtol=1e-3, xtol=1e-3)
print(mu_ul_pyhf)

### Check if the upper limit on mu returned by pyhf backend only is the correct one, i.e. is the one that gives a CLs of 0.05
CLs_spey = pyhf.infer.hypotest(mu_ul_pyhf, workspace.data(model), model, **args )
### It gives 0.05 indeed
print(CLs_spey)

Expected behaviour

The poi upper limit computed by spey should be the one that gives a CLs of 0.05.

Additional information

The bounds for the Brent's bracketing are not the issue. The ones returned by spey (1.0, 64.0) are more or less the same as the ones found by the pyhf only script (0.1, 64.0). Replacing the former by the latter does not change the outcome.

Inconsistent results with signal uncertainties

System Settings

Name: spey
Version: 0.1.7
Summary: Smooth inference for reinterpretation studies
Home-page: https://github.com/SpeysideHEP/spey
Author: Jack Y. Araz
Author-email: [email protected]
License: MIT
Requires: autograd, numpy, requests, scipy, semantic_version, tqdm
Required-by: spey-pyhf

Platform info:            macOS-14.2.1-arm64-arm-64bit
Python version:           3.9.18
Numpy version:            1.23.5
Scipy version:            1.10.0
Autograd version:         1.5
tqdm version:             4.65.0
semantic_version version: 2.10.0

Installed backend plug-ins:

- pyhf (spey-pyhf-0.1.4)
Name: spey-pyhf
Version: 0.1.4
Summary: pyhf plugin for spey interface
Home-page: https://github.com/SpeysideHEP/spey-pyhf
Author: Jack Y. Araz
Author-email: [email protected]
License: MIT
Requires: pyhf, spey
Required-by: 

- pyhf.simplify (spey-pyhf-0.1.4)
- pyhf.uncorrelated_background (spey-pyhf-0.1.4)
- default_pdf.correlated_background (spey-0.1.7)
- default_pdf.effective_sigma (spey-0.1.7)
- default_pdf.poisson (spey-0.1.7)
- default_pdf.third_moment_expansion (spey-0.1.7)
- default_pdf.uncorrelated_background (spey-0.1.7)

Describe the bug

Exclusion limits with signal uncertainties should be looser, but they are higher.

Thanks to @sabinekraml for pointing this issue out.

Source code

pdf_wrapper = spey.get_backend("default_pdf.uncorrelated_background")
statistical_model = pdf_wrapper(
    signal_yields=[12.0, 15.0],
    background_yields=[50.0,48.0],
    data=[36, 33],
    absolute_uncertainties=[12.0,16.0],
    signal_uncertainty_configuration={"absolute_uncertainties":[3,4]},
    analysis="example",
    xsection=0.123,
)

print(f"1 - CLs: {statistical_model.exclusion_confidence_level()[0]:.5f}")
print(f"POI upper limit: {statistical_model.poi_upper_limit():.5f}")

# 1 - CLs: 0.99563
# POI upper limit: 0.51504

pdf_wrapper = spey.get_backend("default_pdf.uncorrelated_background")
statistical_model = pdf_wrapper(
    signal_yields=[12.0, 15.0],
    background_yields=[50.0,48.0],
    data=[36, 33],
    absolute_uncertainties=[12.0,16.0],
    #signal_uncertainty_configuration={"absolute_uncertainties":[3,4]},
    analysis="example",
    xsection=0.123,
)
print(f"1 - CLs: {statistical_model.exclusion_confidence_level()[0]:.5f}")
print(f"POI upper limit: {statistical_model.poi_upper_limit():.5f}")

# 1 - CLs: 0.97018
# POI upper limit: 0.85633

Tracebacks

No response

Expected behaviour

When signal uncertainties are added, the $\chi^2$ distribution should get wider, but it's getting narrower instead. This might be due to the scaling of the constraint term.

Additional information

No response

Existing GitHub issues

  • I have searched existing GitHub issues to make sure the issue does not already exist.

The minima of the Asimov negloglikelihood is not centralised at `poi_test = 0`

System Settings

  • macOS 13.1
  • Python 3.9.10
  • main branch with latest commit ID 682cdcd

Describe the bug

In the simplified likelihood backend, the minima of the $-\log\mathcal{L}$ distribution is not centralised at $\hat\mu=0$.

To Reproduce

import madstats, json

with open("cms_sus_19_006_T6_MQ3_1400.0_M2_600.0.txt", "r") as f:
    data = json.load(f)

current_sl_model = madstats.get_multi_region_statistical_model(
        signal= data["signal"], observed=data["observed"], nb=data["background"], covariance=data["cov_matrix"],delta_sys=0., xsection=0.000386175999, analysis="cms_sus_19_006"
)

muhatA_sl, minnllA_sl = current_sl_model.maximize_likelihood(return_nll=True, allow_negative_signal=True, isAsimov=True)
muhat_sl, minnll_sl = current_sl_model.maximize_likelihood(return_nll=True, allow_negative_signal=True, isAsimov=False)
print(muhatA_sl) # 0.3740630890807138

poi_test = np.linspace(current_sl_model.backend.model.minimum_poi_test, 5, 10)
nllA_sl = [current_sl_model.likelihood(poi_test=m, return_nll=True, isAsimov=True) for m in poi_test]
nll_sl = [current_sl_model.likelihood(poi_test=m, return_nll=True) for m in poi_test]

Screenshot 2023-01-29 at 10 03 46 am

cms_sus_19_006_T6_MQ3_1400.0_M2_600.0.txt

Expected behaviour

I was expecting $\hat\mu_A \simeq 0$.

Additional information

@APMDSLHC could you confirm this on your side as well? Thanks!

SL issue

System Settings

Describe the bug

Here is a weird case, something is wrong. I observe 40,000 events, I expected 40,000. My background uncertainty is 1000. I expected a 95% poi_upper limit of about 1.96 * sqrt ( 40000 + 1000**2 ) = 2000.
Instead I get 384, which seems to be approximately 1.96 * sqrt ( 40000 ). The background uncertainty doesnt even
seem to enter.

To Reproduce

from spey import get_uncorrelated_nbin_statistical_model, ExpectationType
statModel = get_uncorrelated_nbin_statistical_model(
data = [ 40000. ],
backgrounds = [ 40000. ],
background_uncertainty = [ 1000. ],
signal_yields = [1],
xsection = 1,
analysis = "x",
backend = 'simplified_likelihoods'
)

muhat = statModel.poi_upper_limit ( expected = ExpectationType.observed )
print ( "muhat", muhat )

Expected behaviour

No response

Additional information

No response

Strong machine dependence of spey results (simplified likelihoods)

System Settings

In [2]: spey.about()
DEPRECATION: Loading egg at /home/walten/.venvs/311/lib/python3.11/site-packages/ml_likelihoods-0.0.0-py3.11.egg is deprecated. pip 24.3 will enforce this behaviour change. A possible replacement is to use pip for package installation.. Discussion can be found at https://github.com/pypa/pip/issues/12330
Name: spey
Version: 0.1.3
Summary: Smooth inference for reinterpretation studies
Home-page: https://github.com/SpeysideHEP/spey
Author: Jack Y. Araz
Author-email: [email protected]
License: MIT
Location: /home/walten/.venvs/311/lib/python3.11/site-packages
Requires: autograd, numpy, scipy, semantic-version, tqdm
Required-by: spey-pyhf

Platform info:            Linux-6.6.1-060601-generic-x86_64-with-glibc2.38
Python version:           3.11.6
Numpy version:            1.26.2
Scipy version:            1.10.0
DEPRECATION: Loading egg at /home/walten/.venvs/311/lib/python3.11/site-packages/ml_likelihoods-0.0.0-py3.11.egg is deprecated. pip 24.3 will enforce this behaviour change. A possible replacement is to use pip for package installation.. Discussion can be found at https://github.com/pypa/pip/issues/12330
Autograd version:         1.5
tqdm version:             4.66.1
semantic_version version: 2.10.0

Installed backend plug-ins:

- default_pdf.correlated_background (spey-0.1.3)
- default_pdf.effective_sigma (spey-0.1.3)
- default_pdf.poisson (spey-0.1.3)
- default_pdf.third_moment_expansion (spey-0.1.3)
- default_pdf.uncorrelated_background (spey-0.1.3)
- pyhf (spey-pyhf-0.1.1)
DEPRECATION: Loading egg at /home/walten/.venvs/311/lib/python3.11/site-packages/ml_likelihoods-0.0.0-py3.11.egg is deprecated. pip 24.3 will enforce this behaviour change. A possible replacement is to use pip for package installation.. Discussion can be found at https://github.com/pypa/pip/issues/12330
Name: spey-pyhf
Version: 0.1.1
Summary: pyhf plugin for spey interface
Home-page: https://github.com/SpeysideHEP/spey-pyhf
Author: Jack Y. Araz
Author-email: [email protected]
License: MIT
Location: /home/walten/.venvs/311/lib/python3.11/site-packages
Requires: pyhf, spey
Required-by: 

- pyhf.simplify (spey-pyhf-0.1.1)
- pyhf.uncorrelated_background (spey-pyhf-0.1.1)
- ml.likelihoods (ml-likelihoods-0.0.0)
DEPRECATION: Loading egg at /home/walten/.venvs/311/lib/python3.11/site-packages/ml_likelihoods-0.0.0-py3.11.egg is deprecated. pip 24.3 will enforce this behaviour change. A possible replacement is to use pip for package installation.. Discussion can be found at https://github.com/pypa/pip/issues/12330
Name: ml-likelihoods
Version: 0.0.0
Summary: 
Home-page: 
Author: 
Author-email: 
License: 
Location: /home/walten/.venvs/311/lib/python3.11/site-packages/ml_likelihoods-0.0.0-py3.11.egg
Requires: 
Required-by:

Describe the bug

The simplified likelihoods in spey show some strong machine dependence. E.g. the code snippet below sometimes produce the correct:

spey oUL(mu)=0.2842

on other machines -- same versions of spey, autograd, scipy, numpy -- it produces e.g.:

spey oUL(mu)=0.0000

I traced back the problem, it is imho due to hypotest_base.py around line 892:

sigma_mu = self.sigma_mu(muhat, expected=expected) if muhat != 0.0 else 1.0

on the machines with the right result muhat = 0.0, therefore sigma_mu becomes 1.0
on the problematic machines muhat = 4e-24 != 0.0, sigma_mu becomes 1.4e-21 and the low_init, hi_init bracket becomes super small, the ul is not found.
I think, muhat != 0.0 has to be replaced with a floating-point-correct (in-)equality comparison operation.

Source code

#!/usr/bin/env python3

obsN=[138.0, 91.0, 14.0, 3.0, 54.0, 38.0, 4.0, 0.0, 8.0, 2.0, 4.0, 0.0, 1.0, 3.0, 1.0, 1.0, 42.0, 6.0, 1.0, 4.0, 0.0, 0.0]
bg=[160.57, 90.439, 11.512, 2.7508, 53.529, 28.319, 2.5856, 2.6029, 5.0628, 2.1711, 0.063528, 0.88532, 2.6812, 1.2599, 0.41911, 0.67201, 33.567, 7.3285, 1.6546, 4.0289, 0.88189, 0.19966]
cov=[[174.5, 6.601, 0.2403, 0.163, 19.64, 6.506, 0.5148, 0.519, 1.754, 0.6346, 0.007154, 0.422, 1.397, 0.6174, 0.171, 0.286, -0.5543, -0.1305, 0.02306, -0.05027, -0.006686, 0.0109], [6.601, 89.09, 0.5931, -0.04077, 7.188, 7.695, 0.3474, 0.3852, 1.01, 0.4502, 0.009081, 0.2456, 0.8593, 0.4282, 0.1174, 0.235, -0.2041, -0.04318, 0.03952, -0.1545, -0.01002, 0.01648], [0.2403, 0.5931, 9.672, -0.01319, 0.5717, 0.4039, 0.4499, 0.03413, 0.08148, 0.03547, 0.001684, 0.07249, 0.07084, 0.04303, 0.01724, 0.02002, 0.03696, 0.0385, 0.02107, -0.01743, 0.001832, 0.003709], [0.163, -0.04077, -0.01319, 3.709, 0.2659, 0.1292, -0.001839, 0.5376, 0.03348, 0.00997, 0.001397, 0.05909, 0.01182, 0.005355, 0.006677, 0.03921, 0.01953, -0.01931, 0.02678, 0.01732, -0.002887, 0.004678], [19.64, 7.188, 0.5717, 0.2659, 69.77, 6.934, 0.5394, 0.8391, 1.98, 0.7593, 0.01766, 0.3011, 1.661, 0.7474, 0.216, 0.224, -0.2935, -0.01572, 0.04757, -0.001996, 0.01541, 0.01112], [6.506, 7.695, 0.4039, 0.1292, 6.934, 27.89, 0.3204, 0.3368, 1.036, 0.4105, 0.008852, 0.1561, 0.8648, 0.3931, 0.1036, 0.1509, -0.2699, -0.02976, 0.006113, -0.06488, 0.01266, 0.01277], [0.5148, 0.3474, 0.4499, -0.001839, 0.5394, 0.3204, 1.699, 0.01839, 0.08511, 0.02799, 0.0003195, 0.001698, 0.06698, 0.02765, 0.01019, 0.004009, -0.06498, -0.01117, 0.01824, 0.01453, 0.002514, 0.002796], [0.519, 0.3852, 0.03413, 0.5376, 0.8391, 0.3368, 0.01839, 5.76, 0.09795, 0.05031, 0.002012, 0.04714, 0.078, 0.03875, 0.01596, 0.02729, 0.0001083, -0.01461, 0.01978, 0.02572, 0.004099, 0.0067], [1.754, 1.01, 0.08148, 0.03348, 1.98, 1.036, 0.08511, 0.09795, 2.108, 0.1177, 0.002927, 0.03125, 0.5298, 0.1115, 0.02586, 0.03543, 0.03278, -0.006467, 0.005036, 0.002551, -0.002566, 0.0006324], [0.6346, 0.4502, 0.03547, 0.00997, 0.7593, 0.4105, 0.02799, 0.05031, 0.1177, 0.5019, 0.001326, 0.0148, 0.09351, 0.1455, 0.01469, 0.01873, 0.02184, 0.002662, 0.00445, -0.004747, 0.0002134, 0.0007696], [0.007154, 0.009081, 0.001684, 0.001397, 0.01766, 0.008852, 0.0003195, 0.002012, 0.002927, 0.001326, 0.0121, 0.0001844, 0.001437, 0.001037, 0.01401, 0.0009814, -0.0007443, -8.312e-05, 0.0009001, 0.0009795, 0.0001779, 0.0002314], [0.422, 0.2456, 0.07249, 0.05909, 0.3011, 0.1561, 0.001698, 0.04714, 0.03125, 0.0148, 0.0001844, 4.761, 0.03474, 0.01384, 0.007457, 1.983, 0.07728, 0.0002071, 0.009179, 0.07125, 0.007518, 0.004858], [1.397, 0.8593, 0.07084, 0.01182, 1.661, 0.8648, 0.06698, 0.078, 0.5298, 0.09351, 0.001437, 0.03474, 0.8703, 0.0914, 0.02294, 0.02833, 0.009643, -0.001688, 0.003651, -0.005076, -0.0001599, 0.001133], [0.6174, 0.4282, 0.04303, 0.005355, 0.7474, 0.3931, 0.02765, 0.03875, 0.1115, 0.1455, 0.001037, 0.01384, 0.0914, 0.2891, 0.01253, 0.01471, 0.00162, 0.002663, 0.00349, -0.002747, -0.001798, -0.0003085], [0.171, 0.1174, 0.01724, 0.006677, 0.216, 0.1036, 0.01019, 0.01596, 0.02586, 0.01469, 0.01401, 0.007457, 0.02294, 0.01253, 0.3721, 0.005811, 0.006178, 0.004303, 0.001909, 0.002492, 0.0006547, 0.0008085], [0.286, 0.235, 0.02002, 0.03921, 0.224, 0.1509, 0.004009, 0.02729, 0.03543, 0.01873, 0.0009814, 1.983, 0.02833, 0.01471, 0.005811, 1.776, 0.06913, 0.008452, 0.01022, 0.03104, 0.007245, 0.005361], [-0.5543, -0.2041, 0.03696, 0.01953, -0.2935, -0.2699, -0.06498, 0.0001083, 0.03278, 0.02184, -0.0007443, 0.07728, 0.009643, 0.00162, 0.006178, 0.06913, 33.32, 5.406, 1.608, 1.192, 0.0703, 0.07672], [-0.1305, -0.04318, 0.0385, -0.01931, -0.01572, -0.02976, -0.01117, -0.01461, -0.006467, 0.002662, -8.312e-05, 0.0002071, -0.001688, 0.002663, 0.004303, 0.008452, 5.406, 3.271, 0.5664, 0.07033, 0.262, 0.03766], [0.02306, 0.03952, 0.02107, 0.02678, 0.04757, 0.006113, 0.01824, 0.01978, 0.005036, 0.00445, 0.0009001, 0.009179, 0.003651, 0.00349, 0.001909, 0.01022, 1.608, 0.5664, 0.8431, 0.07743, 0.03581, 0.1028], [-0.05027, -0.1545, -0.01743, 0.01732, -0.001996, -0.06488, 0.01453, 0.02572, 0.002551, -0.004747, 0.0009795, 0.07125, -0.005076, -0.002747, 0.002492, 0.03104, 1.192, 0.07033, 0.07743, 1.903, 0.203, 0.01753], [-0.006686, -0.01002, 0.001832, -0.002887, 0.01541, 0.01266, 0.002514, 0.004099, -0.002566, 0.0002134, 0.0001779, 0.007518, -0.0001599, -0.001798, 0.0006547, 0.007245, 0.0703, 0.262, 0.03581, 0.203, 0.13, 0.04504], [0.0109, 0.01648, 0.003709, 0.004678, 0.01112, 0.01277, 0.002796, 0.0067, 0.0006324, 0.0007696, 0.0002314, 0.004858, 0.001133, -0.0003085, 0.0008085, 0.005361, 0.07672, 0.03766, 0.1028, 0.01753, 0.04504, 0.04159]]
nsig=[0.0, 0.0002892207, 0.0004011771, 0.005287607475, 0.000170267025, 0.000746376, 0.0007673678249999999, 0.0069832804500000005, 0.0007930245, 0.00267295905, 0.001835618475, 0.031107552225, 0.0008769918, 0.005873046149999999, 0.007456762725000001, 0.085919539725, 0.59161307046, 0.7652938326899998, 5.264143279499999, 0.5127043338, 0.63509786919, 4.421279522100001]
analysis='CMS-SUS-20-004'
lumi=137.0

import spey

                                                                               
stat_wrapper = spey.get_backend("default_pdf.correlated_background")           
speyModel = stat_wrapper( data = obsN, background_yields = bg,
    covariance_matrix = cov, signal_yields = nsig,
    xsection = [ x / lumi for x in nsig ], analysis = analysis )

print ( f"spey oUL(mu)={speyModel.poi_upper_limit( ):.4f}" ) 
print ( f"spey eUL(mu)={speyModel.poi_upper_limit( expected = spey.ExpectationType.aposteriori ):.4f}" ) 
# the upper limits

Tracebacks

No response

Expected behaviour

spey oUL(mu)=0.2842
spey eUL(mu)=0.3516

which is the result obtained on those machines that just happen to compute muhat to be == 0.0.

Additional information

This is for sure not the only part of spey that is machine dependent. However, one step at a time. Expect more
such trouble tickets in the future.

Existing GitHub issues

  • I have searched existing GitHub issues to make sure the issue does not already exist.

third_momenta

System Settings

No response

Describe the bug

in simplifiedlikelihood_backend.init.py: 77

it says

third_moment=np.array(third_moment, dtype=np.float64) if third_moment else None

in line 69 you see that you expect third_moment to be an np.array.
However:

In []: third_moment = np.array ( [ 3., 6, ] )

In []: bool(third_moment)

ValueError Traceback (most recent call last)
Cell In[], line 1
----> 1 bool(third_moment)

ValueError: The truth value of an array with more than one element is ambiguous. Use a.any() or a.all()

To Reproduce

No response

Expected behaviour

No response

Additional information

No response

Loss in numeric stability

System Settings

  • OS: Linux
  • Python 3.10.9
  • SciPy 1.10.0, numpy 1.23.5
  • main branch commit f0d039a
  • spey-pyhf commit id 257db13

Describe the bug

When $q_\mu$ and/pr $q_{\mu,A}$ are below $10^{-6}$ program becomes unstable and values become negative. This originates due to the ratio between $\mathcal{L}(\mu, \theta_{\mu})$ and $\mathcal{L}(\hat\mu, \theta_{\hat\mu})$ where sometimes $\mathcal{L}(\mu, \theta_{\mu}) &lt; \mathcal{L}(\hat\mu, \theta_{\hat\mu})$ which should not happen.

To Reproduce

qmu=-3.055520068073747e-07, qmuA=-3.055520068073747e-07: poi=6.9806260135461145, muhat=0.9903130067730574, min_nll=46.82248569018225, muhatA=0.9903130067730574, min_nllA=46.82248569018225, logpdf(mu)=-46.822485537406244, logpdfA(mu)=-46.822485537406244

Expected behaviour

No response

Additional information

No response

Numpy version dependency

System Settings

Fedora Linux 35
Python 3.9.12

Describe the bug

numpy warnings library is not available anymore in numpy version 1.24.1 ?

In order to load a statistical model, Madstats needs to import PyhfInterface from madstats.backends.pyhf_backend.interface, which needs to import warnings from numpy.

---------------------------------------------------------------------------
ImportError                               Traceback (most recent call last)
Input In [1], in <cell line: 13>()
     10 with open("./madstats/test/background_test.json", "r") as f:
     11     background = json.load(f)
---> 13 stat_model = madstats.get_multi_region_statistical_model(
     14     analysis="atlas_susy_2018_31",
     15     signal=signal,
     16     background=background,
     17     xsection=0.000207244,
     18 )
     19 print(stat_model)
     20 # Out: StatisticalModel(analysis='atlas_susy_2018_31', xsection=2.072e-04 [pb], backend=pyhf)

File ~/SModelS/madstats/src/madstats/__init__.py:105, in get_multi_region_statistical_model(analysis, signal, background, covariance, nb, third_moment, delta_sys, xsection)
    102 assert len(signal) > 1, "Incorrect input shape."
    104 if isinstance(signal, list) and isinstance(signal[0], dict) and isinstance(background, dict):
--> 105     from madstats.backends.pyhf_backend.interface import PyhfInterface
    106     from madstats.backends.pyhf_backend.data import Data
    108     model = Data(signal=signal, background=background)

File ~/SModelS/madstats/src/madstats/backends/pyhf_backend/interface.py:3, in <module>
      1 import logging, scipy
      2 from typing import Dict, Union, Optional, Tuple
----> 3 from numpy import warnings, isnan
      4 import numpy as np
      6 import pyhf

ImportError: cannot import name 'warnings' from 'numpy' (/home/pascal/anaconda3/lib/python3.9/site-packages/numpy/__init__.py)

To Reproduce

import madstats, json
import numpy as np

with open("./madstats/test/signal_test.json", "r") as f:
    signal = json.load(f)

with open("./madstats/test/background_test.json", "r") as f:
    background = json.load(f)

stat_model = madstats.get_multi_region_statistical_model(
    analysis="atlas_susy_2018_31",
    signal=signal,
    background=background,
    xsection=0.000207244,
)

Expected behaviour

The code should load the warning library of numpy.

Additional information

The bug appears with numpy version 1.24.1 but not with version 1.21.6.
It may or may not work for in-between versions.

optimiser argument ntrial > 1 crashes

System Settings

In [2]: spey.about()
Name: spey
Version: 0.1.3
Summary: Smooth inference for reinterpretation studies
Home-page: https://github.com/SpeysideHEP/spey
Author: Jack Y. Araz
Author-email: [email protected]
License: MIT
Location: /home/walten/.venvs/311/lib/python3.11/site-packages
Requires: autograd, numpy, scipy, semantic-version, tqdm
Required-by: spey-pyhf

Platform info:            Linux-6.6.1-060601-generic-x86_64-with-glibc2.38
Python version:           3.11.6
Numpy version:            1.26.2
Scipy version:            1.10.0
Autograd version:         1.5
tqdm version:             4.66.1
semantic_version version: 2.10.0

Installed backend plug-ins:

- default_pdf.correlated_background (spey-0.1.3)
- default_pdf.effective_sigma (spey-0.1.3)
- default_pdf.poisson (spey-0.1.3)
- default_pdf.third_moment_expansion (spey-0.1.3)
- default_pdf.uncorrelated_background (spey-0.1.3)
- pyhf (spey-pyhf-0.1.1)
Name: spey-pyhf
Version: 0.1.1
Summary: pyhf plugin for spey interface
Home-page: https://github.com/SpeysideHEP/spey-pyhf
Author: Jack Y. Araz
Author-email: [email protected]
License: MIT
Location: /home/walten/.venvs/311/lib/python3.11/site-packages
Requires: pyhf, spey
Required-by: 

- pyhf.simplify (spey-pyhf-0.1.1)
- pyhf.uncorrelated_background (spey-pyhf-0.1.1)

Describe the bug

if i want to call the optimiser with ntrial > 1, spey crashes

Source code

#!/usr/bin/env python3

obsN=[138.0, 91.0, 14.0, 3.0, 54.0, 38.0, 4.0, 0.0, 8.0, 2.0, 4.0, 0.0, 1.0, 3.0, 1.0, 1.0, 42.0, 6.0, 1.0, 4.0, 0.0, 0.0]
bg=[160.57, 90.439, 11.512, 2.7508, 53.529, 28.319, 2.5856, 2.6029, 5.0628, 2.1711, 0.063528, 0.88532, 2.6812, 1.2599, 0.41911, 0.67201, 33.567, 7.3285, 1.6546, 4.0289, 0.88189, 0.19966]
cov=[[174.5, 6.601, 0.2403, 0.163, 19.64, 6.506, 0.5148, 0.519, 1.754, 0.6346, 0.007154, 0.422, 1.397, 0.6174, 0.171, 0.286, -0.5543, -0.1305, 0.02306, -0.05027, -0.006686, 0.0109], [6.601, 89.09, 0.5931, -0.04077, 7.188, 7.695, 0.3474, 0.3852, 1.01, 0.4502, 0.009081, 0.2456, 0.8593, 0.4282, 0.1174, 0.235, -0.2041, -0.04318, 0.03952, -0.1545, -0.01002, 0.01648], [0.2403, 0.5931, 9.672, -0.01319, 0.5717, 0.4039, 0.4499, 0.03413, 0.08148, 0.03547, 0.001684, 0.07249, 0.07084, 0.04303, 0.01724, 0.02002, 0.03696, 0.0385, 0.02107, -0.01743, 0.001832, 0.003709], [0.163, -0.04077, -0.01319, 3.709, 0.2659, 0.1292, -0.001839, 0.5376, 0.03348, 0.00997, 0.001397, 0.05909, 0.01182, 0.005355, 0.006677, 0.03921, 0.01953, -0.01931, 0.02678, 0.01732, -0.002887, 0.004678], [19.64, 7.188, 0.5717, 0.2659, 69.77, 6.934, 0.5394, 0.8391, 1.98, 0.7593, 0.01766, 0.3011, 1.661, 0.7474, 0.216, 0.224, -0.2935, -0.01572, 0.04757, -0.001996, 0.01541, 0.01112], [6.506, 7.695, 0.4039, 0.1292, 6.934, 27.89, 0.3204, 0.3368, 1.036, 0.4105, 0.008852, 0.1561, 0.8648, 0.3931, 0.1036, 0.1509, -0.2699, -0.02976, 0.006113, -0.06488, 0.01266, 0.01277], [0.5148, 0.3474, 0.4499, -0.001839, 0.5394, 0.3204, 1.699, 0.01839, 0.08511, 0.02799, 0.0003195, 0.001698, 0.06698, 0.02765, 0.01019, 0.004009, -0.06498, -0.01117, 0.01824, 0.01453, 0.002514, 0.002796], [0.519, 0.3852, 0.03413, 0.5376, 0.8391, 0.3368, 0.01839, 5.76, 0.09795, 0.05031, 0.002012, 0.04714, 0.078, 0.03875, 0.01596, 0.02729, 0.0001083, -0.01461, 0.01978, 0.02572, 0.004099, 0.0067], [1.754, 1.01, 0.08148, 0.03348, 1.98, 1.036, 0.08511, 0.09795, 2.108, 0.1177, 0.002927, 0.03125, 0.5298, 0.1115, 0.02586, 0.03543, 0.03278, -0.006467, 0.005036, 0.002551, -0.002566, 0.0006324], [0.6346, 0.4502, 0.03547, 0.00997, 0.7593, 0.4105, 0.02799, 0.05031, 0.1177, 0.5019, 0.001326, 0.0148, 0.09351, 0.1455, 0.01469, 0.01873, 0.02184, 0.002662, 0.00445, -0.004747, 0.0002134, 0.0007696], [0.007154, 0.009081, 0.001684, 0.001397, 0.01766, 0.008852, 0.0003195, 0.002012, 0.002927, 0.001326, 0.0121, 0.0001844, 0.001437, 0.001037, 0.01401, 0.0009814, -0.0007443, -8.312e-05, 0.0009001, 0.0009795, 0.0001779, 0.0002314], [0.422, 0.2456, 0.07249, 0.05909, 0.3011, 0.1561, 0.001698, 0.04714, 0.03125, 0.0148, 0.0001844, 4.761, 0.03474, 0.01384, 0.007457, 1.983, 0.07728, 0.0002071, 0.009179, 0.07125, 0.007518, 0.004858], [1.397, 0.8593, 0.07084, 0.01182, 1.661, 0.8648, 0.06698, 0.078, 0.5298, 0.09351, 0.001437, 0.03474, 0.8703, 0.0914, 0.02294, 0.02833, 0.009643, -0.001688, 0.003651, -0.005076, -0.0001599, 0.001133], [0.6174, 0.4282, 0.04303, 0.005355, 0.7474, 0.3931, 0.02765, 0.03875, 0.1115, 0.1455, 0.001037, 0.01384, 0.0914, 0.2891, 0.01253, 0.01471, 0.00162, 0.002663, 0.00349, -0.002747, -0.001798, -0.0003085], [0.171, 0.1174, 0.01724, 0.006677, 0.216, 0.1036, 0.01019, 0.01596, 0.02586, 0.01469, 0.01401, 0.007457, 0.02294, 0.01253, 0.3721, 0.005811, 0.006178, 0.004303, 0.001909, 0.002492, 0.0006547, 0.0008085], [0.286, 0.235, 0.02002, 0.03921, 0.224, 0.1509, 0.004009, 0.02729, 0.03543, 0.01873, 0.0009814, 1.983, 0.02833, 0.01471, 0.005811, 1.776, 0.06913, 0.008452, 0.01022, 0.03104, 0.007245, 0.005361], [-0.5543, -0.2041, 0.03696, 0.01953, -0.2935, -0.2699, -0.06498, 0.0001083, 0.03278, 0.02184, -0.0007443, 0.07728, 0.009643, 0.00162, 0.006178, 0.06913, 33.32, 5.406, 1.608, 1.192, 0.0703, 0.07672], [-0.1305, -0.04318, 0.0385, -0.01931, -0.01572, -0.02976, -0.01117, -0.01461, -0.006467, 0.002662, -8.312e-05, 0.0002071, -0.001688, 0.002663, 0.004303, 0.008452, 5.406, 3.271, 0.5664, 0.07033, 0.262, 0.03766], [0.02306, 0.03952, 0.02107, 0.02678, 0.04757, 0.006113, 0.01824, 0.01978, 0.005036, 0.00445, 0.0009001, 0.009179, 0.003651, 0.00349, 0.001909, 0.01022, 1.608, 0.5664, 0.8431, 0.07743, 0.03581, 0.1028], [-0.05027, -0.1545, -0.01743, 0.01732, -0.001996, -0.06488, 0.01453, 0.02572, 0.002551, -0.004747, 0.0009795, 0.07125, -0.005076, -0.002747, 0.002492, 0.03104, 1.192, 0.07033, 0.07743, 1.903, 0.203, 0.01753], [-0.006686, -0.01002, 0.001832, -0.002887, 0.01541, 0.01266, 0.002514, 0.004099, -0.002566, 0.0002134, 0.0001779, 0.007518, -0.0001599, -0.001798, 0.0006547, 0.007245, 0.0703, 0.262, 0.03581, 0.203, 0.13, 0.04504], [0.0109, 0.01648, 0.003709, 0.004678, 0.01112, 0.01277, 0.002796, 0.0067, 0.0006324, 0.0007696, 0.0002314, 0.004858, 0.001133, -0.0003085, 0.0008085, 0.005361, 0.07672, 0.03766, 0.1028, 0.01753, 0.04504, 0.04159]]
nsig=[0.0, 0.0002892207, 0.0004011771, 0.005287607475, 0.000170267025, 0.000746376, 0.0007673678249999999, 0.0069832804500000005, 0.0007930245, 0.00267295905, 0.001835618475, 0.031107552225, 0.0008769918, 0.005873046149999999, 0.007456762725000001, 0.085919539725, 0.59161307046, 0.7652938326899998, 5.264143279499999, 0.5127043338, 0.63509786919, 4.421279522100001]
analysis='CMS-SUS-20-004'
lumi=137.0

import spey

stat_wrapper = spey.get_backend("default_pdf.correlated_background")           
speyModel = stat_wrapper( data = obsN, background_yields = bg,
    covariance_matrix = cov, signal_yields = nsig,
    xsection = [ x / lumi for x in nsig ], analysis = analysis )

print ( f"spey oUL(mu)={speyModel.poi_upper_limit( optimiser_arguments = { 'ntrial': 3 } ):.4f}" ) 
# print ( f"spey eUL(mu)={speyModel.poi_upper_limit( expected = spey.ExpectationType.aposteriori ):.4f}" )

Tracebacks

sonic ~/Downloads> python3 forjack.py 
/home/walten/.venvs/311/lib/python3.11/site-packages/spey/optimizer/scipy_tools.py:57: OptimizeWarning: Unknown solver options: ntrial
  opt = scipy.optimize.minimize(
minimization [0] 67.59623551652393 Optimization terminated successfully
/home/walten/.venvs/311/lib/python3.11/site-packages/spey/optimizer/scipy_tools.py:57: OptimizeWarning: Unknown solver options: ntrial
  opt = scipy.optimize.minimize(
minimization [1] 67.59630122863426 Optimization terminated successfully
/home/walten/.venvs/311/lib/python3.11/site-packages/spey/optimizer/scipy_tools.py:57: OptimizeWarning: Unknown solver options: ntrial
  opt = scipy.optimize.minimize(
minimization [2] 58.22544816184985 Optimization terminated successfully
_prepare for llhd 3.1290050479353755e-14 0.0
minimization [3] 67.59630122863426 Optimization terminated successfully
minimization [4] 58.22544816184985 Optimization terminated successfully
minimization [5] 67.59630122863426 Optimization terminated successfully
/home/walten/.venvs/311/lib/python3.11/site-packages/spey/optimizer/scipy_tools.py:73: RuntimeWarning: Inequality constraints incompatible
spey::Expanding the bounds.
  warnings.warn(
Traceback (most recent call last):
  File "/home/walten/Downloads/forjack.py", line 17, in <module>
    print ( f"spey oUL(mu)={speyModel.poi_upper_limit( optimiser_arguments = { 'ntrial': 3 } ):.4f}" ) 
                            ^^^^^^^^^^^^^^^^^^^^^^^^^^^^^^^^^^^^^^^^^^^^^^^^^^^^^^^^^^^^^^^^^^
  File "/home/walten/.venvs/311/lib/python3.11/site-packages/spey/base/hypotest_base.py", line 898, in poi_upper_limit
    sigma_mu = self.sigma_mu(muhat, expected=expected)
               ^^^^^^^^^^^^^^^^^^^^^^^^^^^^^^^^^^^^^^^
  File "/home/walten/.venvs/311/lib/python3.11/site-packages/spey/base/hypotest_base.py", line 522, in sigma_mu
    qmuA = teststat_func(poi_test, muhatA, -min_nllA, logpdf_asimov)
           ^^^^^^^^^^^^^^^^^^^^^^^^^^^^^^^^^^^^^^^^^^^^^^^^^^^^^^^^^
  File "/home/walten/.venvs/311/lib/python3.11/site-packages/spey/hypothesis_testing/test_statistics.py", line 41, in qmu_tilde
    -2.0 * (logpdf(mu) - (max_logpdf if muhat >= 0.0 else logpdf(0.0))), 0.0, None
            ^^^^^^^^^^
  File "/home/walten/.venvs/311/lib/python3.11/site-packages/spey/base/hypotest_base.py", line 515, in logpdf_asimov
    return -self.asimov_likelihood(
            ^^^^^^^^^^^^^^^^^^^^^^^
  File "/home/walten/.venvs/311/lib/python3.11/site-packages/spey/interface/statistical_model.py", line 446, in asimov_likelihood
    return self.likelihood(
           ^^^^^^^^^^^^^^^^
  File "/home/walten/.venvs/311/lib/python3.11/site-packages/spey/interface/statistical_model.py", line 305, in likelihood
    logpdf, _ = fit(
                ^^^^
  File "/home/walten/.venvs/311/lib/python3.11/site-packages/spey/optimizer/core.py", line 52, in fit
    fun, x = minimize(
             ^^^^^^^^^
  File "/home/walten/.venvs/311/lib/python3.11/site-packages/spey/optimizer/scipy_tools.py", line 82, in minimize
    bounds[bdx] = (min(bound[0], bound[0] * 10.0), bound[1] * 10.0)
                                 ~~~~~~~~~^~~~~~
TypeError: unsupported operand type(s) for *: 'NoneType' and 'float'

Expected behaviour

No response

Additional information

No response

Existing GitHub issues

  • I have searched existing GitHub issues to make sure the issue does not already exist.

Python 3.12 compatibility issue

          Thanks Jack! But in running it I get the error: python3.12/site-packages/spey/hypothesis_testing/asymptotic_calculator.py", line 81, in compute_asymptotic_confidence_level
CLsb_obs, CLb_obs, CLs_obs = pvalues(
                             ^^^^^^^^

File "....local/lib/python3.12/site-packages/spey/hypothesis_testing/utils.py", line 63, in pvalues
CLsb = sig_plus_bkg_distribution.pvalue(delta_test_statistic)
^^^^^^^^^^^^^^^^^^^^^^^^^^^^^^^^^^^^^^^^^^^^^^^^^^^^^^
File "....local/lib/python3.12/site-packages/spey/hypothesis_testing/distributions.py", line 42, in pvalue
return_value = multivariate_normal.cdf(self.shift - value)
^^^^^^^^^^^^^^^^^^^^^^^^^^^^^^^^^^^^^^^^^^^
File "/usr/lib64/python3.12/site-packages/scipy/stats/_multivariate.py", line 723, in cdf
params = self._process_parameters(mean, cov, allow_singular)
^^^^^^^^^^^^^^^^^^^^^^^^^^^^^^^^^^^^^^^^^^^^^^^^^^^
File "/usr/lib64/python3.12/site-packages/scipy/stats/_multivariate.py", line 422, in _process_parameters
psd = _PSD(cov, allow_singular=allow_singular)
^^^^^^^^^^^^^^^^^^^^^^^^^^^^^^^^^^^^^^^^
File "/usr/lib64/python3.12/site-packages/scipy/stats/_multivariate.py", line 167, in init
s, u = scipy.linalg.eigh(M, lower=lower, check_finite=check_finite)
^^^^^^^^^^^^^^^^^^^^^^^^^^^^^^^^^^^^^^^^^^^^^^^^^^^^^^^^^^^^
File "/usr/lib64/python3.12/site-packages/scipy/linalg/_decomp.py", line 560, in eigh
w, v, other_args, info = drv(a=a1, **drv_args, **lwork_args)
^^^^^^^^^^^^^^^^^^^^^^^^^^^^^^^^^^^
_flapack.error: (liwork>=max(1,10
n)||liwork==-1) failed for 10th keyword liwork: dsyevr:liwork=1

Originally posted by @mdgoodsell in #39 (comment)

Can't find the likelihood maximum

System Settings

Fedora Linux 35
Python 3.9.12

Describe the bug

Optimizer in combiner.maximize_likelihood() can't reach the required precision.

Sometimes it crashes, sometimes it doesn't.

fun: nan
     jac: array([nan, nan, nan, nan, nan, nan, nan, nan, nan, nan, nan, nan, nan,
       nan, nan, nan, nan, nan, nan, nan, nan, nan, nan, nan, nan, nan,
       nan, nan, nan, nan, nan, nan, nan, nan, nan, nan, nan, nan, nan,
       nan, nan, nan, nan, nan, nan, nan, nan, nan, nan, nan, nan, nan,
       nan, nan, nan, nan, nan, nan, nan, nan])
 message: 'Inequality constraints incompatible'
    nfev: 61
     nit: 1
    njev: 1
  status: 4
 success: False
       x: array([ 0.        ,  0.        ,  0.        ,  0.        ,  0.        ,
        0.        ,  0.        ,  0.        ,  0.        ,  0.        ,
        0.        ,  0.        ,  0.        ,  0.        ,  0.        ,
        0.        ,  0.        ,  0.        ,  0.        ,  0.        ,
        0.        ,  0.        ,  0.        ,  0.        ,  0.        ,
        0.        ,  0.        ,  0.        ,  0.        ,  0.        ,
        0.        ,  0.        ,  0.        ,  0.        ,  0.        ,
        0.        ,  0.        ,  0.        ,  0.        ,  0.        ,
        0.        ,  0.        ,  0.        ,  0.        ,  0.        ,
        0.        ,  0.        ,  0.        ,  0.        ,  0.        ,
        0.        ,  0.        ,  1.        , -8.87822344,  1.        ,
        0.        ,  0.        ,  1.        ,  1.        ,  1.        ])
Traceback (most recent call last):
  File "/home/pascal/anaconda3/lib/python3.9/site-packages/pyhf/optimize/mixins.py", line 64, in _internal_minimize
    assert result.success
AssertionError
     fun: nan
     jac: array([nan, nan, nan, nan, nan, nan, nan, nan, nan, nan, nan, nan, nan,
       nan, nan, nan, nan, nan, nan, nan, nan, nan, nan, nan, nan, nan,
       nan, nan, nan, nan, nan, nan, nan, nan, nan, nan, nan, nan, nan,
       nan, nan, nan, nan, nan, nan, nan, nan, nan, nan, nan, nan, nan,
       nan, nan, nan, nan, nan, nan, nan, nan])
 message: 'Inequality constraints incompatible'
    nfev: 61
     nit: 1
    njev: 1
  status: 4
 success: False
       x: array([ 0.        ,  0.        ,  0.        ,  0.        ,  0.        ,
        0.        ,  0.        ,  0.        ,  0.        ,  0.        ,
        0.        ,  0.        ,  0.        ,  0.        ,  0.        ,
        0.        ,  0.        ,  0.        ,  0.        ,  0.        ,
        0.        ,  0.        ,  0.        ,  0.        ,  0.        ,
        0.        ,  0.        ,  0.        ,  0.        ,  0.        ,
        0.        ,  0.        ,  0.        ,  0.        ,  0.        ,
        0.        ,  0.        ,  0.        ,  0.        ,  0.        ,
        0.        ,  0.        ,  0.        ,  0.        ,  0.        ,
        0.        ,  0.        ,  0.        ,  0.        ,  0.        ,
        0.        ,  0.        ,  1.        , -7.87822344,  1.        ,
        0.        ,  0.        ,  1.        ,  1.        ,  1.        ])
Traceback (most recent call last):
  File "/home/pascal/anaconda3/lib/python3.9/site-packages/pyhf/optimize/mixins.py", line 64, in _internal_minimize
    assert result.success
AssertionError

---------------------------------------------------------------------------
RuntimeWarning                            Traceback (most recent call last)
Input In [8], in <cell line: 7>()
      4 nll_observed = np.array([combiner.likelihood(mu=m, return_nll=True, allow_negative_signal=True, expected=madstats.ExpectationType.observed) for m in mu])
      6 muhat_obs, nll_min_obs = combiner.maximize_likelihood(return_nll=True, allow_negative_signal=True, expected=madstats.ExpectationType.observed)
----> 7 muhat_apri, nll_min_apri = combiner.maximize_likelihood(return_nll=True, allow_negative_signal=True, expected=madstats.ExpectationType.apriori)
      9 fig = plt.figure(figsize=(8,6))
     11 plt.plot(mu, nll_apriori, label=str(madstats.ExpectationType.apriori), color="tab:red")

File ~/SModelS/madstats/src/madstats/combiner/prediction_combiner.py:156, in PredictionCombiner.maximize_likelihood(self, return_nll, expected, allow_negative_signal, iteration_threshold, **kwargs)
    147 opt = scipy.optimize.minimize(
    148     negloglikelihood,
    149     muhat_init,
   (...)
    152     options={"maxiter": iteration_threshold},
    153 )
    155 if not opt.success:
--> 156     raise RuntimeWarning("Optimiser was not able to reach required precision.")
    158 nll, muhat = opt.fun, opt.x[0]
    159 if not allow_negative_signal and muhat < 0.0:

RuntimeWarning: Optimiser was not able to reach required precision.

To Reproduce

import madstats, json
import numpy as np

with open("./madstats/test/signal_test.json", "r") as f:
    signal = json.load(f)

with open("./madstats/test/background_test.json", "r") as f:
    background = json.load(f)

stat_model = madstats.get_multi_region_statistical_model(
    analysis="atlas_susy_2018_31",
    signal=signal,
    background=background,
    xsection=0.000207244,
)

dat = np.load("./madstats/test/simplified_likelihood_data.npz")
sl_model = madstats.get_multi_region_statistical_model(
    analysis="cms_sus_19_006",
    signal=dat["nsignal"],
    background=dat["observed"],
    covariance=dat["covariance"],
    nb=dat["backgrounds"],
    xsection=0.000207244,
    delta_sys=0.
)

combiner = madstats.PredictionCombiner(sl_model, stat_model)

muhat_apri, nll_min_apri = combiner.maximize_likelihood(return_nll=True, allow_negative_signal=True, expected=madstats.ExpectationType.apriori)


Expected behaviour

Finding the parameters that maximise the likelihood.

Additional information

numpy version 1.21.6
scipy version 1.8.0

Recommend Projects

  • React photo React

    A declarative, efficient, and flexible JavaScript library for building user interfaces.

  • Vue.js photo Vue.js

    ๐Ÿ–– Vue.js is a progressive, incrementally-adoptable JavaScript framework for building UI on the web.

  • Typescript photo Typescript

    TypeScript is a superset of JavaScript that compiles to clean JavaScript output.

  • TensorFlow photo TensorFlow

    An Open Source Machine Learning Framework for Everyone

  • Django photo Django

    The Web framework for perfectionists with deadlines.

  • D3 photo D3

    Bring data to life with SVG, Canvas and HTML. ๐Ÿ“Š๐Ÿ“ˆ๐ŸŽ‰

Recommend Topics

  • javascript

    JavaScript (JS) is a lightweight interpreted programming language with first-class functions.

  • web

    Some thing interesting about web. New door for the world.

  • server

    A server is a program made to process requests and deliver data to clients.

  • Machine learning

    Machine learning is a way of modeling and interpreting data that allows a piece of software to respond intelligently.

  • Game

    Some thing interesting about game, make everyone happy.

Recommend Org

  • Facebook photo Facebook

    We are working to build community through open source technology. NB: members must have two-factor auth.

  • Microsoft photo Microsoft

    Open source projects and samples from Microsoft.

  • Google photo Google

    Google โค๏ธ Open Source for everyone.

  • D3 photo D3

    Data-Driven Documents codes.