![]()

ICMP & MTR & TCP Port & HTTP Get Prometheus exporter
This exporter gathers either ICMP, MTR, TCP Port or HTTP Get stats and exports them via HTTP for Prometheus consumption.
- IPv4 & IPv6 support
- Configuration reloading (By interval or OS signal)
- Dynamically Add or Remove targets without affecting the currently running tests
- Automatic update of the target IP when the DNS resolution changes
- Targets can be executed on all hosts or a list of specified ones
probe - Extra labels when defining targets
- Configurable logging levels and format (text or json)
- Configurable DNS Server
- Configurable Source IP per target
source_ip(optional), The IP has to be configured on one of the instance's interfaces
ping_upExporter stateping_targetsNumber of active targetsping_status: Ping Statusping_rtt_seconds{type=best}: Best round trip time in secondsping_rtt_seconds{type=worst}: Worst round trip time in secondsping_rtt_seconds{type=mean}: Mean round trip time in secondsping_rtt_seconds{type=sum}: Sum round trip time in secondsping_rtt_seconds{type=sd}: Squared deviation in secondsping_rtt_seconds{type=usd}: Standard deviation without correction in secondsping_rtt_seconds{type=csd}: Standard deviation with correction (Bessel's) in secondsping_rtt_seconds{type=range}: Range in secondsping_rtt_snt_count: Packet sent count totalping_rtt_snt_fail_count: Packet sent fail count totalping_rtt_snt_seconds: Packet sent time total in secondsping_loss_percent: Packet loss in percent
mtr_upExporter statemtr_targetsNumber of active targetsmtr_hopsNumber of route hopsmtr_rtt_seconds{type=last}: Last round trip time in secondsmtr_rtt_seconds{type=best}: Best round trip time in secondsmtr_rtt_seconds{type=worst}: Worst round trip time in secondsmtr_rtt_seconds{type=mean}: Mean round trip time in secondsmtr_rtt_seconds{type=sum}: Sum round trip time in secondsmtr_rtt_seconds{type=sd}: Squared deviation in secondsmtr_rtt_seconds{type=usd}: Standard deviation without correction in secondsmtr_rtt_seconds{type=csd}: Standard deviation with correction (Bessel's) in secondsmtr_rtt_seconds{type=range}: Range in secondsmtr_rtt_seconds{type=loss}: Packet loss in percentmtr_rtt_snt_count: Packet sent count totalmtr_rtt_snt_fail_count: Packet sent fail count totalmtr_rtt_snt_seconds: Packet sent time total in seconds
tcp_upExporter statetcp_targetsNumber of active targetstcp_connection_statusConnection Statustcp_connection_secondsConnection time in seconds
http_get_upExporter statehttp_get_targetsNumber of active targetshttp_get_statusHTTP Status Code and Connection Statushttp_get_content_bytesHTTP Get Content Size in byteshttp_get_seconds{type=DNSLookup}: DNSLookup connection drill down time in secondshttp_get_seconds{type=TCPConnection}: TCPConnection connection drill down time in secondshttp_get_seconds{type=TLSHandshake}: TLSHandshake connection drill down time in secondshttp_get_seconds{type=TLSEarliestCertExpiry}: TLSEarliestCertExpiry cert expiration time in epochhttp_get_seconds{type=TLSLastChainExpiry}: TLSLastChainExpiry cert expiration time in epochhttp_get_seconds{type=ServerProcessing}: ServerProcessing connection drill down time in secondshttp_get_seconds{type=ContentTransfer}: ContentTransfer connection drill down time in secondshttp_get_seconds{type=Total}: Total connection time in seconds
Each metric contains the below labels and additionally the ones added in the configuration file.
name(ALL: The target name)target(ALL: The target defined Hostname or IP)target_ip(ALL: The target resolved IP Address)source_ip(ALL: The source IP Address)port(TCP: The target TCP Port)ttl(MTR: Time to live)path(MTR: Traceroute IP)
The process must run with the necesary linux or docker previlages to be able to perform the necesary tests
apt update
apt install docker
apt install docker.io
touch network_exporter.yml$ goreleaser release --skip=publish --snapshot --clean
$ ls -l artifacts/network_exporter_*6?
# If you want to run it with a non root user
$ sudo setcap 'cap_net_raw,cap_net_admin+eip' artifacts/network_exporter_linux_amd64/network_exporterTo run the network_exporter as a Docker container by builing your own image or using https://hub.docker.com/r/syepes/network_exporter
docker build -t syepes/network_exporter .
# Default mode
docker run --privileged --cap-add NET_ADMIN --cap-add NET_RAW -p 9427:9427 -v $PWD/network_exporter.yml:/app/cfg/network_exporter.yml:ro --name network_exporter syepes/network_exporter
# Debug level
docker run --privileged --cap-add NET_ADMIN --cap-add NET_RAW -p 9427:9427 -v $PWD/network_exporter.yml:/app/cfg/network_exporter.yml:ro --name network_exporter syepes/network_exporter /app/network_exporter --log.level=debugTo see all available configuration flags:
./network_exporter -hThe configuration (YAML) is mainly separated into three sections Main, Protocols and Targets.
The file network_exporter.yml can be either edited before building the docker container or changed it runtime.
# Main Config
conf:
  refresh: 15m
  nameserver: 192.168.0.1:53 # Optional
  nameserver_timeout: 250ms # Optional

# Specific Protocol settings
icmp:
  interval: 3s
  timeout: 1s
  count: 6

mtr:
  interval: 3s
  timeout: 500ms
  max-hops: 30
  count: 6

tcp:
  interval: 3s
  timeout: 1s

http_get:
  interval: 15m
  timeout: 5s

# Target list and settings
targets:
  - name: internal
    host: 192.168.0.1
    type: ICMP
    probe:
      - hostname1
      - hostname2
    labels:
      dc: home
      rack: a1
  - name: google-dns1
    host: 8.8.8.8
    type: ICMP
  - name: google-dns2
    host: 8.8.4.4
    type: MTR
  - name: cloudflare-dns
    host: 1.1.1.1
    type: ICMP+MTR
  - name: cloudflare-dns-https
    host: 1.1.1.1:443
    source_ip: 192.168.1.1
    type: TCP
  - name: download-file-64M
    host: http://test-debit.free.fr/65536.rnd
    type: HTTPGet
  - name: download-file-64M-proxy
    host: http://test-debit.free.fr/65536.rnd
    type: HTTPGet
    proxy: http://localhost:3128
Source IP
source_ip parameter will try to assign IP for request sent to specific target. This IP has to be configure on one of the interfaces of the OS.
Supported for all types of the checks
  - name: server3.example.com:9427
    host: server3.example.com:9427
    type: TCP
    source_ip: 192.168.1.1
Note: Domain names are resolved (regularly) to their corresponding A and AAAA records (IPv4 and IPv6).
By default if not configured, network_exporter uses the system resolver to translate domain names to IP addresses.
You can also override the DNS resolver address by specifying the conf.nameserver configuration setting.
SRV records:
If the host field of a target contains a SRV record with the format _<service>._<protocol>.<domain> it will be resolved, all it's A records will be added (dynamically) as separate targets with name and host of the this A record.
Every field of the parent target with a SRV record will be inherited by sub targets except name and host
SRV record supported for ICMP/MTR/TCP target types. TCP SRV record specifcs:
- Target type should be
TCPand_protocolpart in the SRV record should be_tcpas well - Port will be taken from the 3rd number, just before the hostname
TCP SRV example
_connectivity-check._tcp.example.com. 86400 IN SRV 10 5 80 server.example.com.
_connectivity-check._tcp.example.com. 86400 IN SRV 10 5 443 server2.example.com.
_connectivity-check._tcp.example.com. 86400 IN SRV 10 5 9247 server3.example.com.
ICMP SRV example
_connectivity-check._icmp.example.com. 86400 IN SRV 10 5 8 server.example.com.
_connectivity-check._icmp.example.com. 86400 IN SRV 10 5 8 server2.example.com.
_connectivity-check._icmp.example.com. 86400 IN SRV 10 5 8 server3.example.com.
Configuration reference
  - name: test-srv-record
    host: _connectivity-check._icmp.example.com
    type: ICMP
  - name: test-srv-record
    host: _connectivity-check._tcp_.example.com
    type: TCP
Will be resolved to 3 separate targets:
  - name: server.example.com
    host: server.example.com
    type: ICMP
  - name: server2.example.com
    host: server2.example.com
    type: ICMP
  - name: server3.example.com
    host: server3.example.com
    type: ICMP
  - name: server.example.com:80
    host: server.example.com:80
    type: TCP
  - name: server2.example.com:443
    host: server2.example.com:443
    type: TCP
  - name: server3.example.com:9427
    host: server3.example.com:9427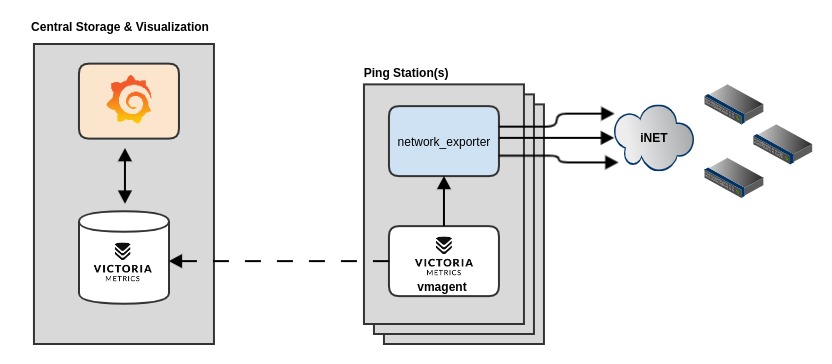
type: TCPThis deployment example will permit you to have as many Ping Stations as you need (LAN or WIFI) devices but at the same time decoupling the data collection from the storage and visualization. This docker compose will deploy and configure all the components plus setup Grafana with the Datasource and Dashboard
If you have any idea for an improvement or find a bug do not hesitate in opening an issue, just simply fork and create a pull-request to help improve the exporter.
All content is distributed under the Apache 2.0 License Copyright © 2020-2023, Sebastian YEPES

![dependabot[bot] avatar](https://avatars.githubusercontent.com/in/29110?v=4 "dependabot[bot]")