Package to generate and display color palettes.
This readme contains excerpts of a blogpost. The full text can be found here
The output when calling paletteprint() looks like this:
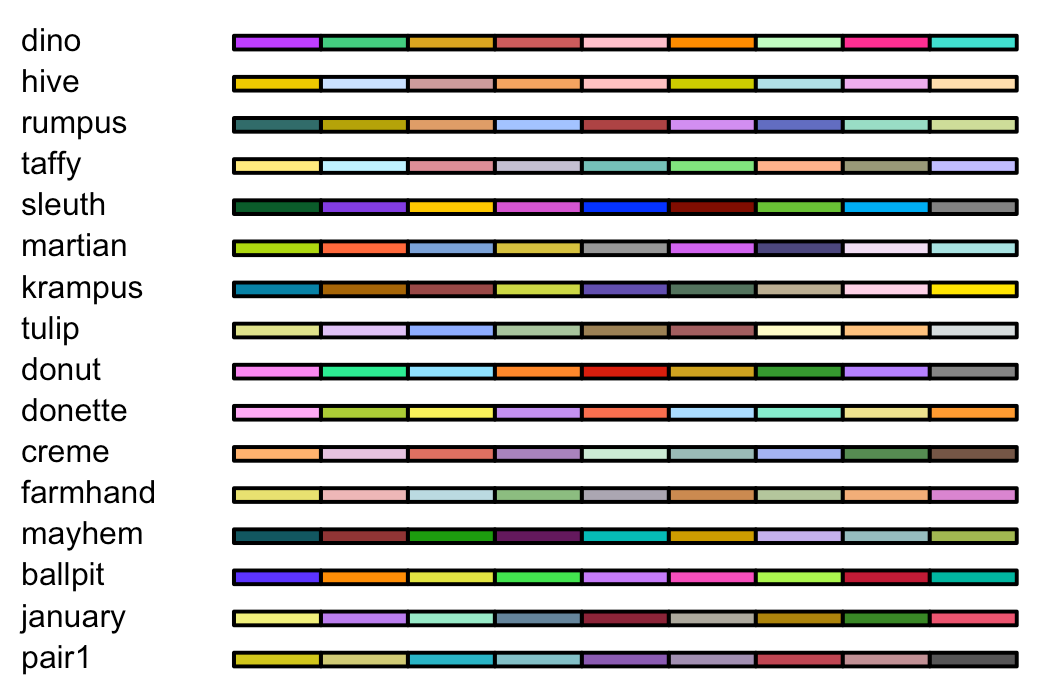
Next I wanted a function that would display the colors in a selected palette, display them in a straightforward way, allow me to choose how many colors I wanted to see, shuffle the colors if desired, and return a list of the colors displayed.
If I call colordisplay, choose my palette and use all default parameters, the result will look like this (fully zoomed out):
colordisplay(january)
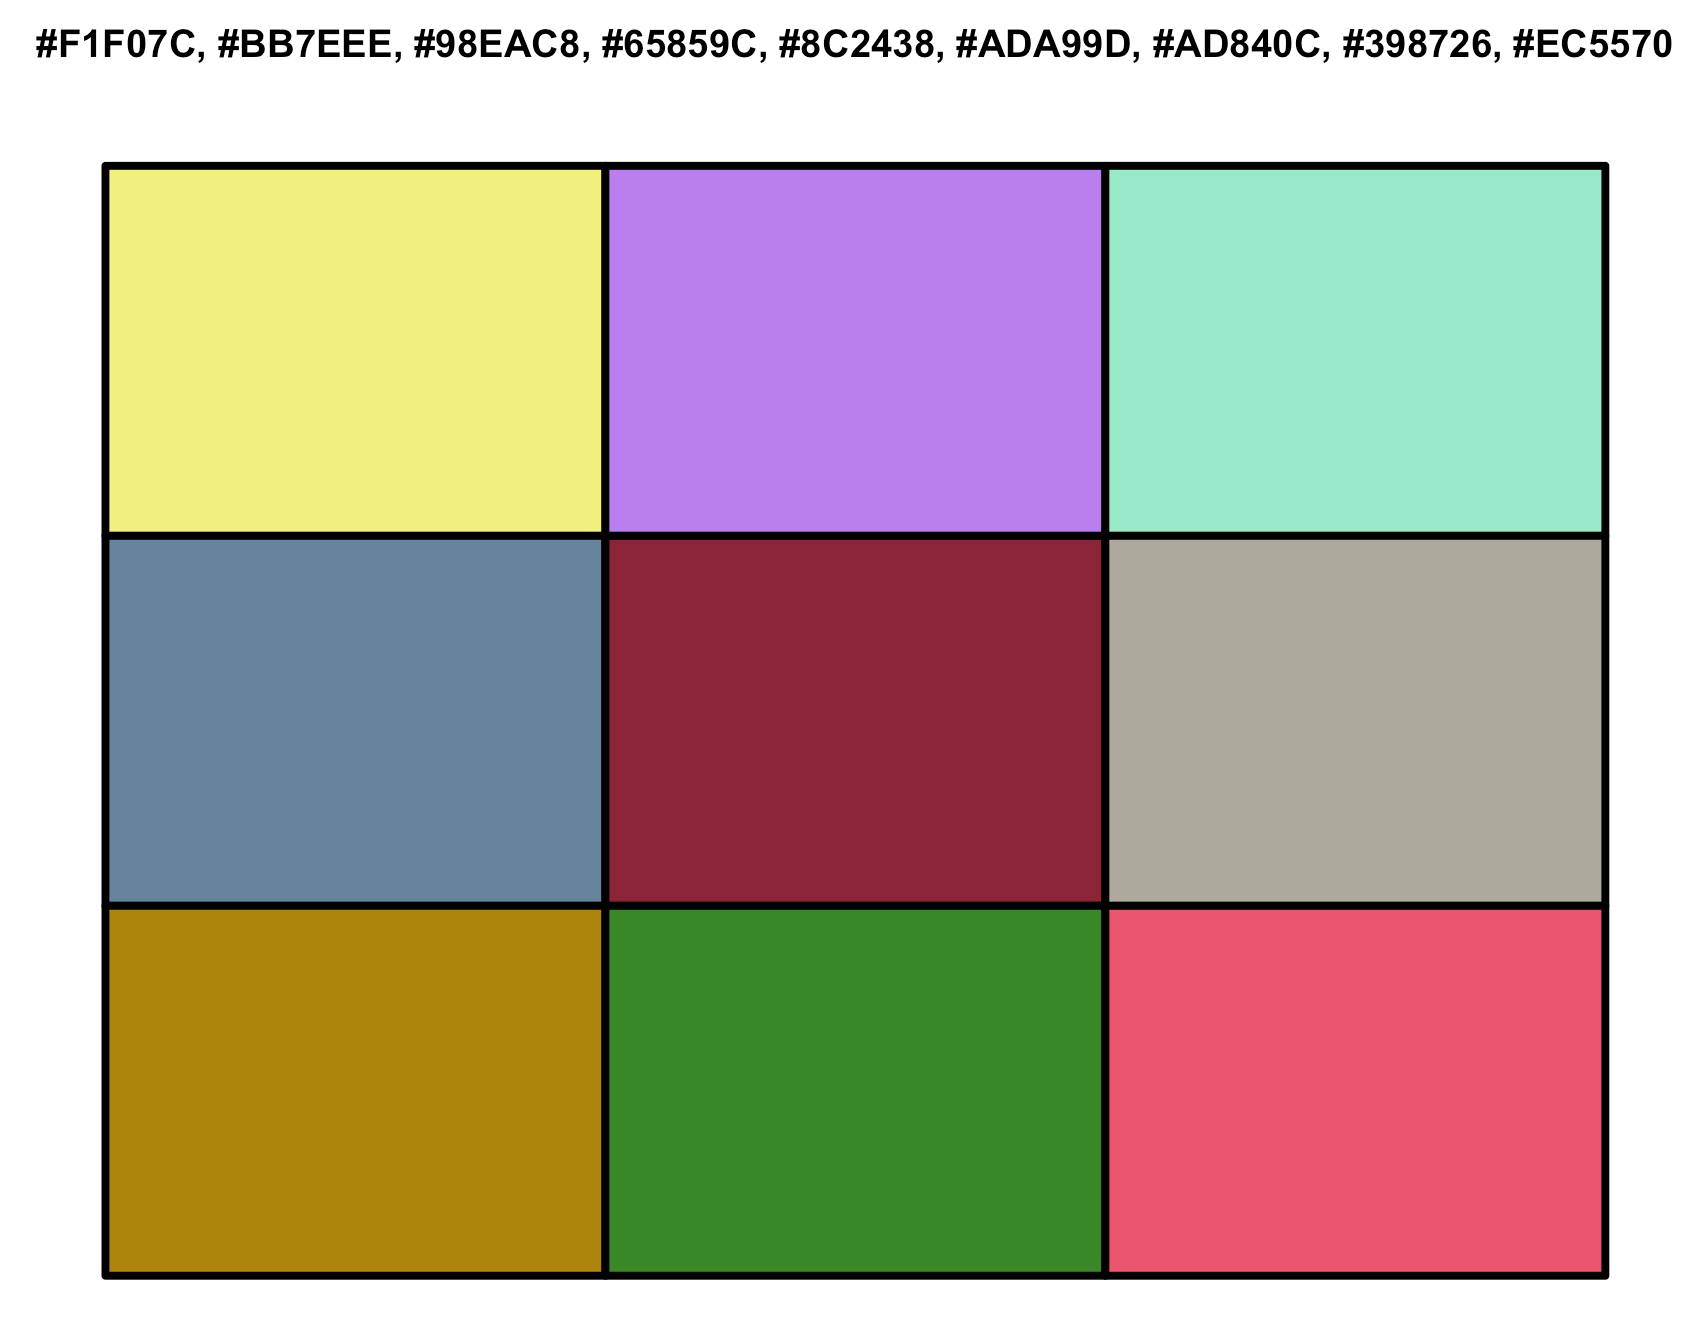
I will also get this as output:
[1] "#F1F07C, #BB7EEE, #98EAC8, #65859C, #8C2438, #ADA99D, #AD840C, #398726, #EC5570"If I call colordisplay with shuffle on, I get a randomly shuffled output with the corresponding list of colors:
colordisplay(january, shuffle = "yes")
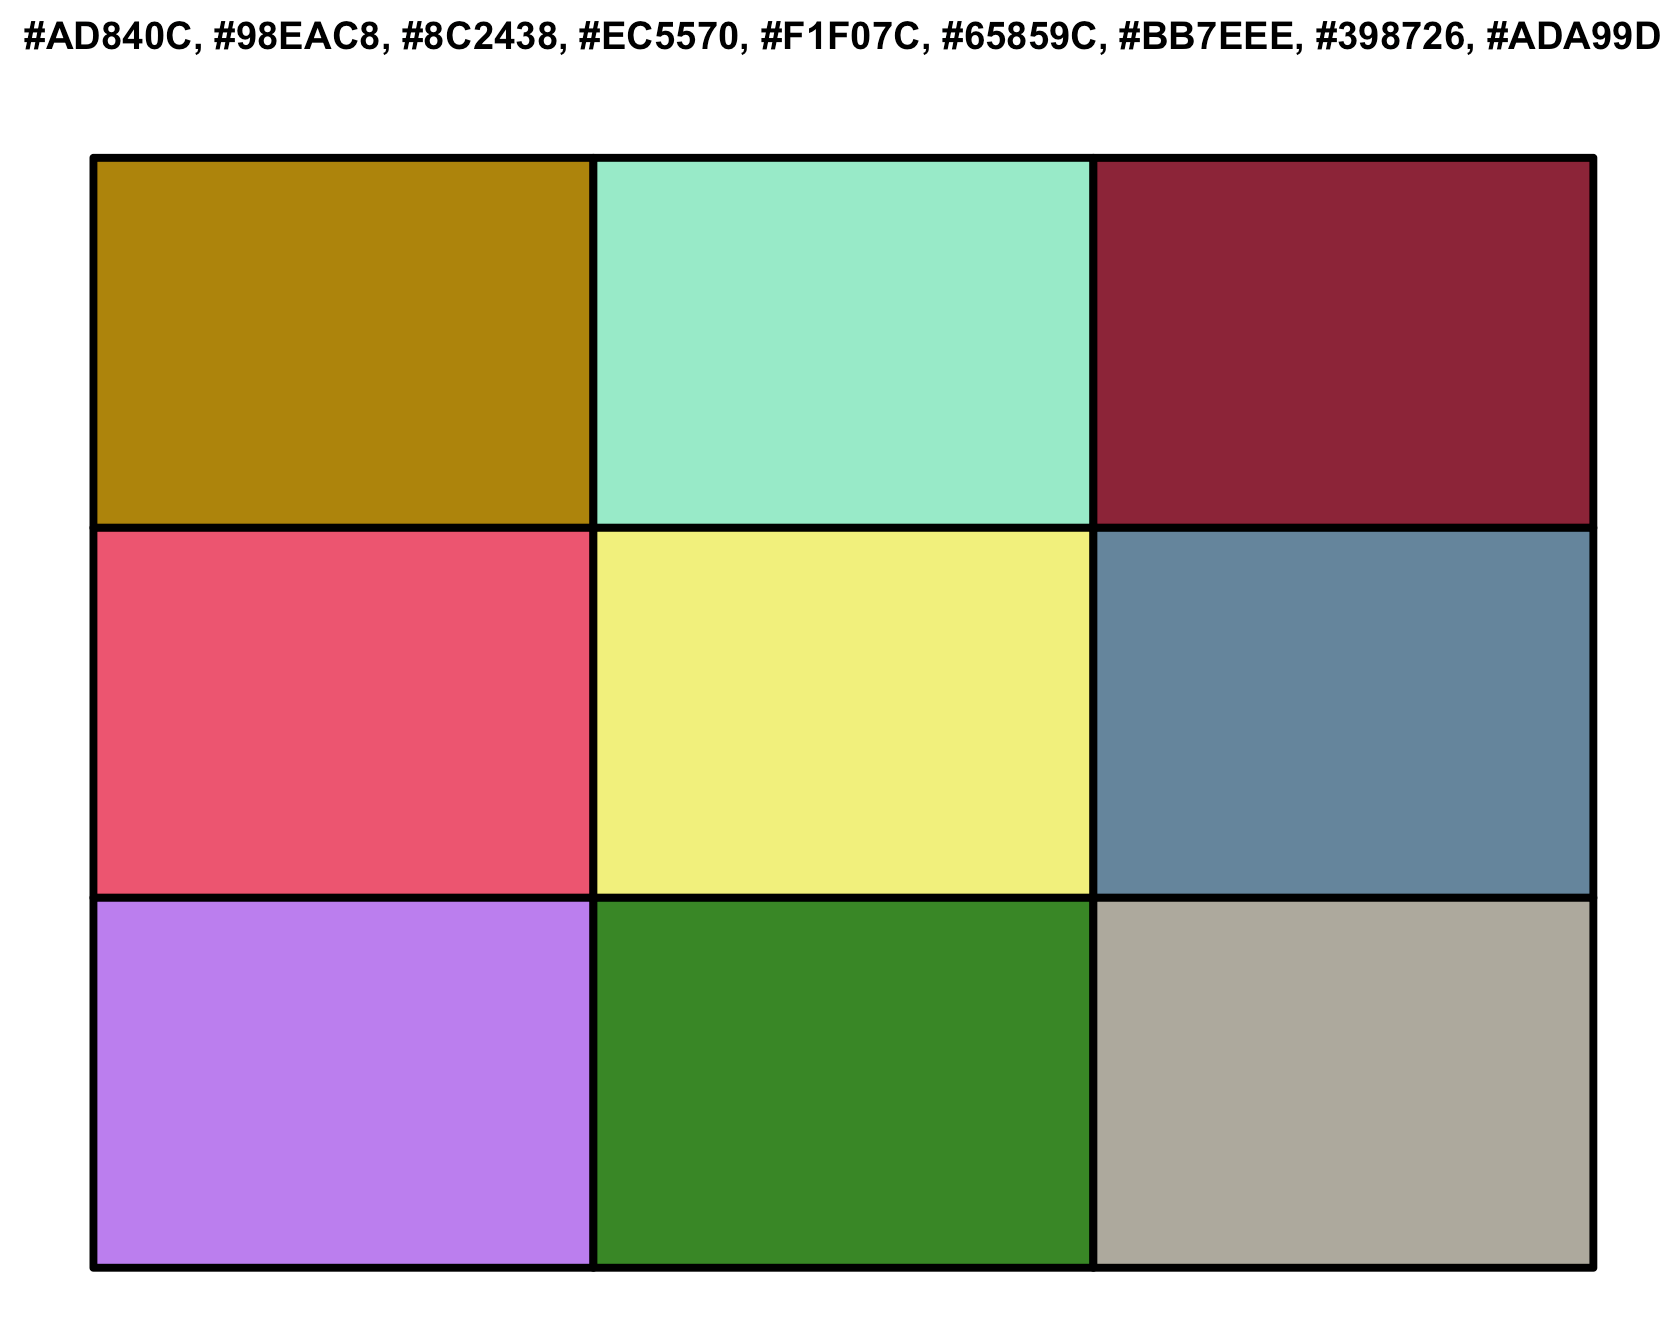
[1] "#AD840C, #98EAC8, #8C2438, #EC5570, #F1F07C, #65859C, #BB7EEE, #398726, #ADA99Colordisplay will display as little as 2 colors.
You can also choose to display a palette from another package, or using paletteer:
colordisplay(paletteer_d("nationalparkcolors::DeathValley"), number = 6, shuffle = "yes")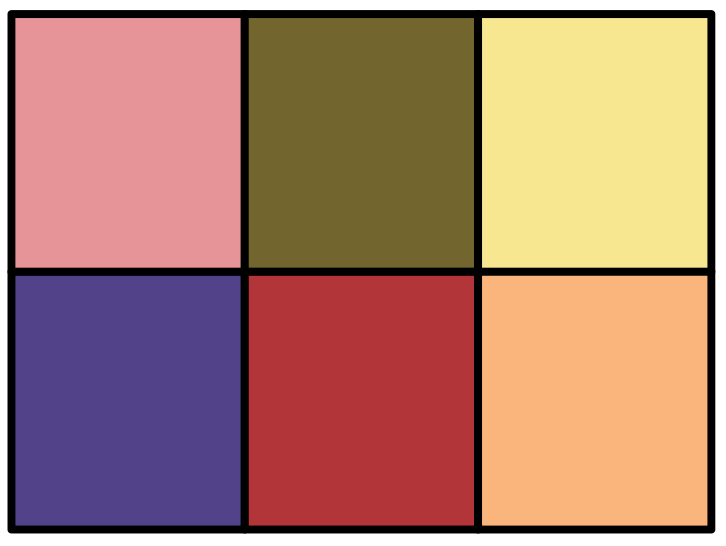
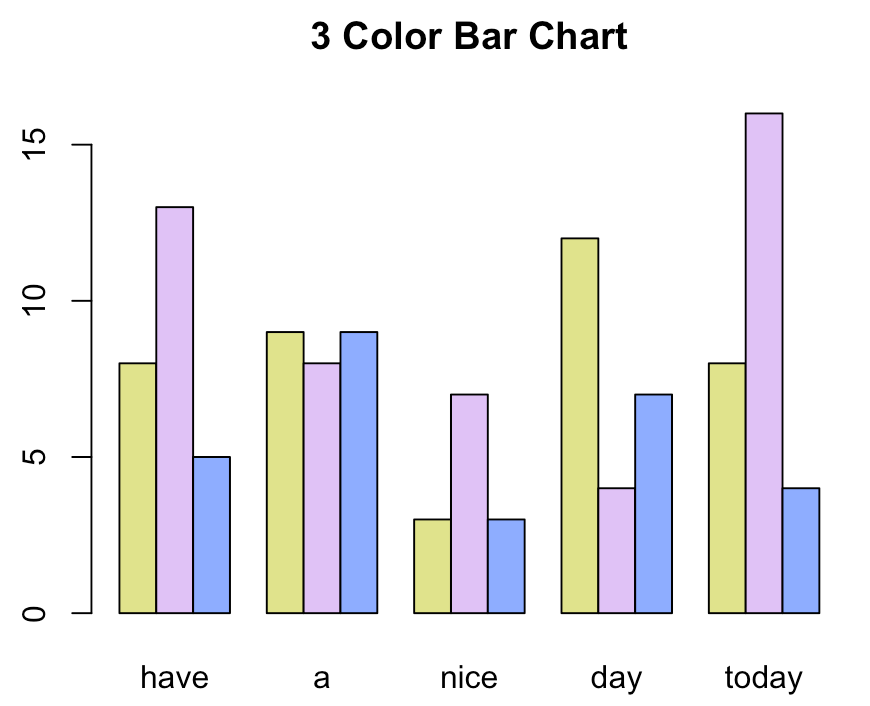
[1] "#E79498FF, #73652DFF, #F7E790FF, #514289FF, #B23539FF, #FAB57CFF"Let's try colorbar with the tulip palette and default parameters:
colorbar(palette = tulip)
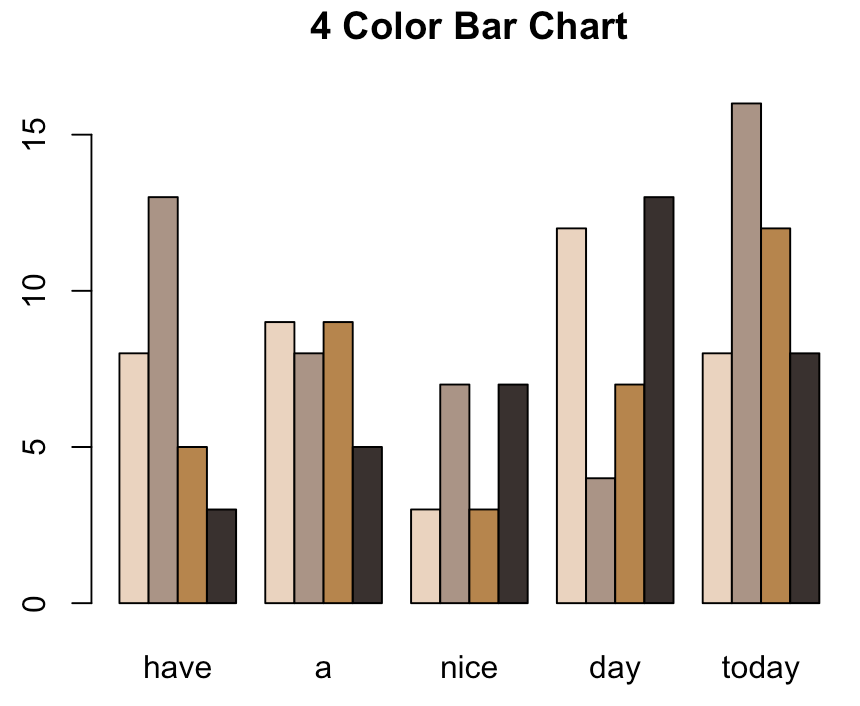
We can add up to 7 colors in the bar chart:
colorbar(palette = tulip, number = 7)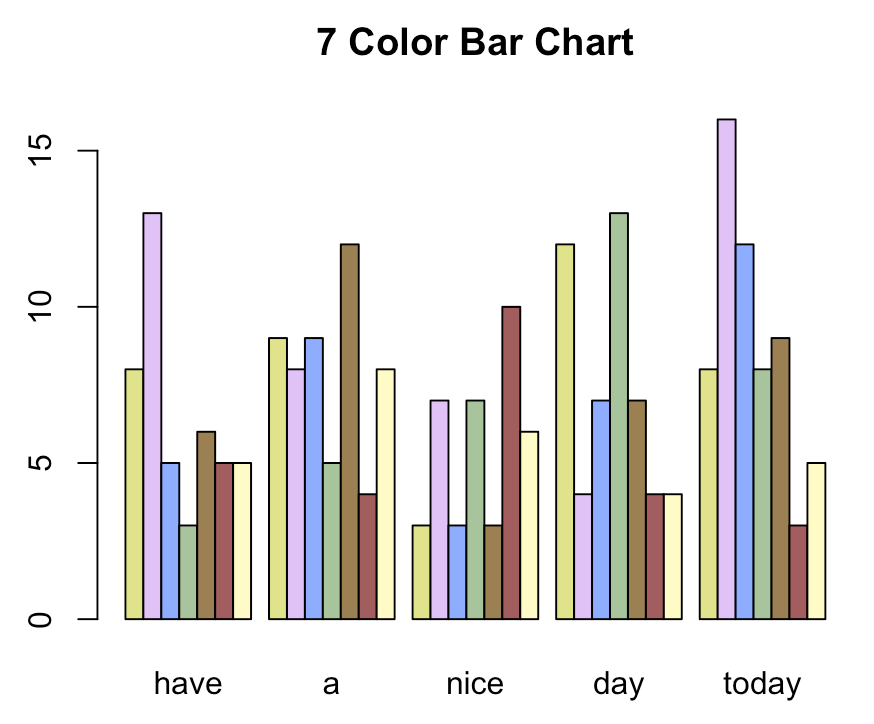
We can choose to stack the bars:
colorbar(palette = tulip, number = 7, stacked = "yes")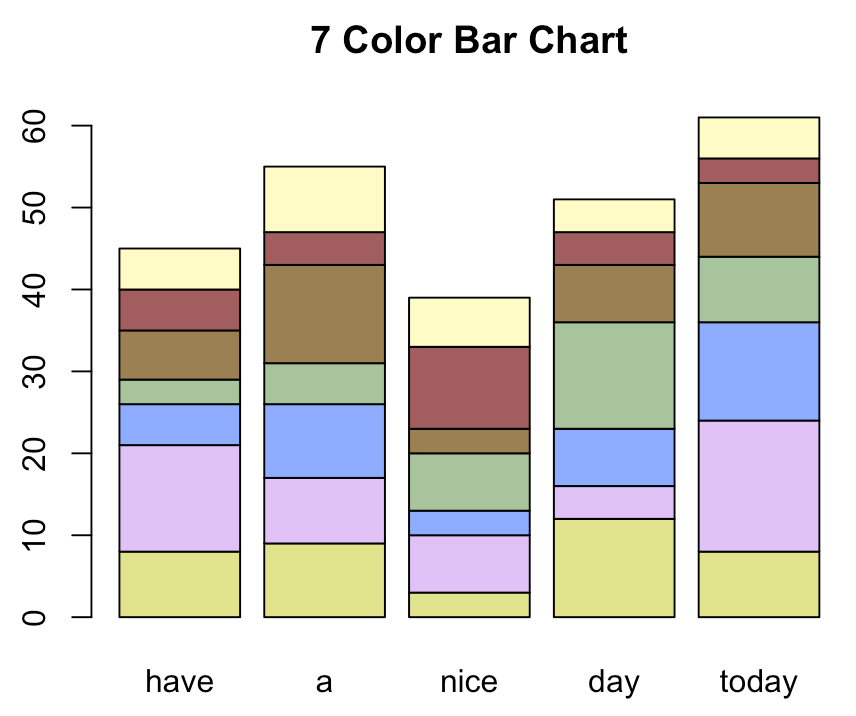
We can shuffle the colors:
colorbar(palette = tulip, number = 7, stacked = "yes", shuffle = "yes")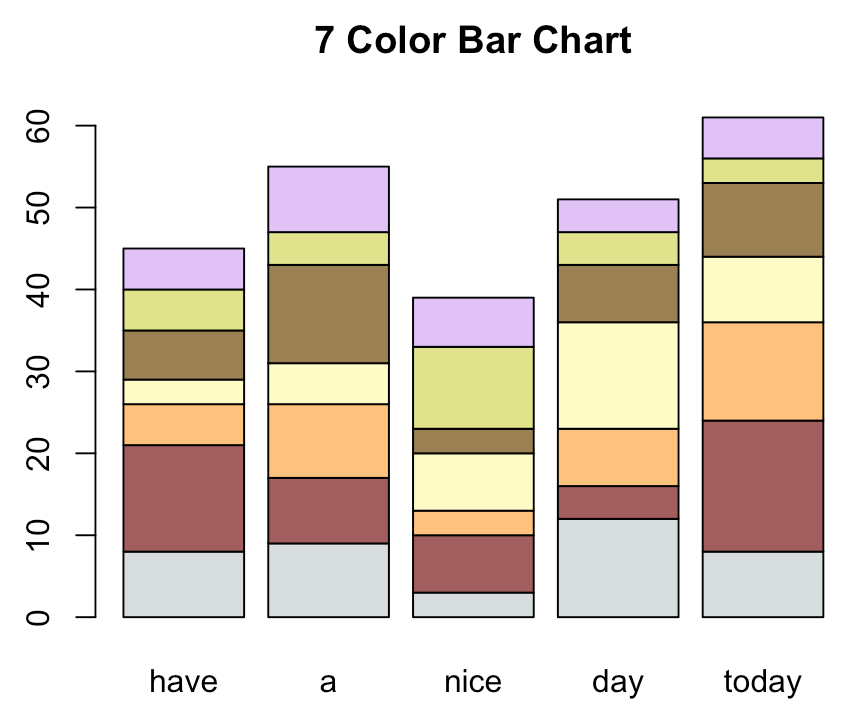
Like colordisplay, colorbar will always output the ordered list of colors for each chart:
[1] "#D7DDDE, #A25E5F, #FFC27E, #FFFBC7, #9B8054, #E0E38C, #E0C2F6"
Lastly, we can use palettes from other packages:
colorbar(palette = paletteer_d("wesanderson::IsleofDogs2"), number = 4)
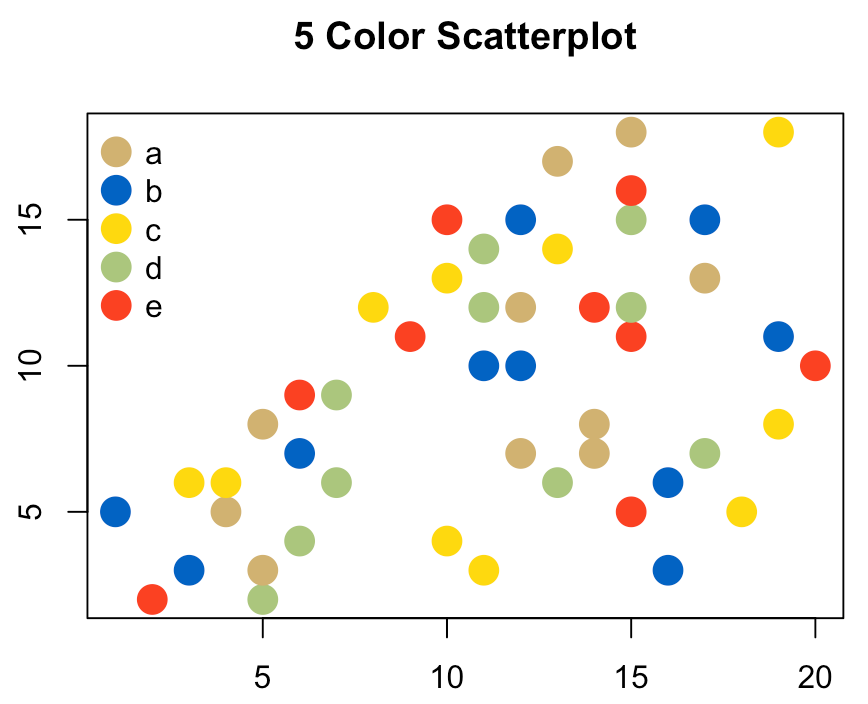
Colorscatter is virtually the same function as colorbar, but instead of a bar chart, color scatter will display a scatter plot. The only difference in parameters between the two is that color scatter lacks the "stacked" feature, for obvious reasons.
Let's try the default colorscatter function using the "ballpit" palette:
colorscatter(palette = ballpit)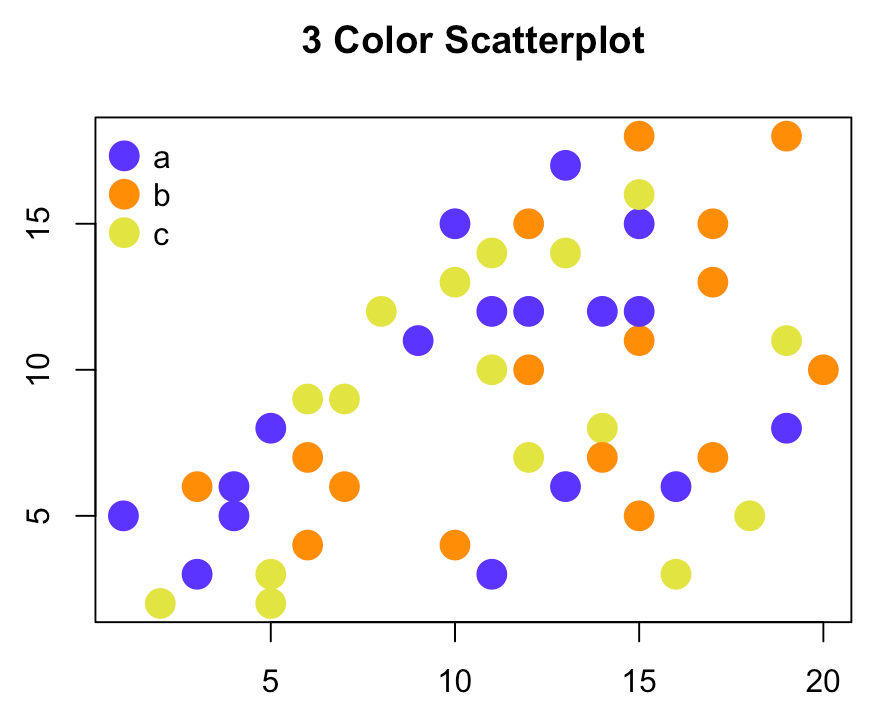
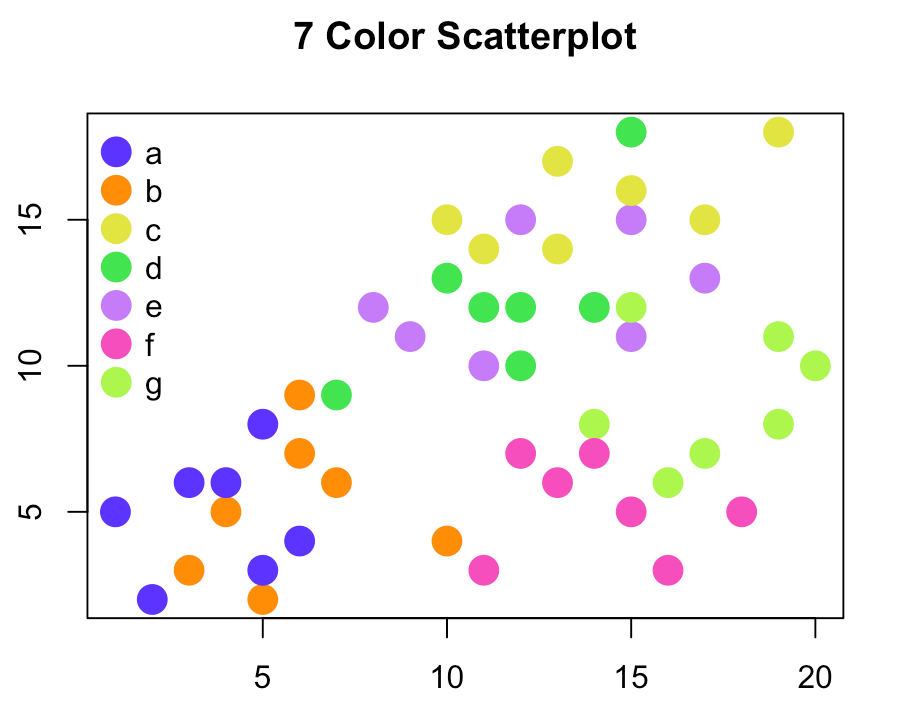
Like colorbar, we can view up to 7 colors using colorscatter:
colorscatter(palette = ballpit, number = 7)
We can also shuffle colors:
colorscatter(palette = ballpit, number = 5, shuffle = "yes")
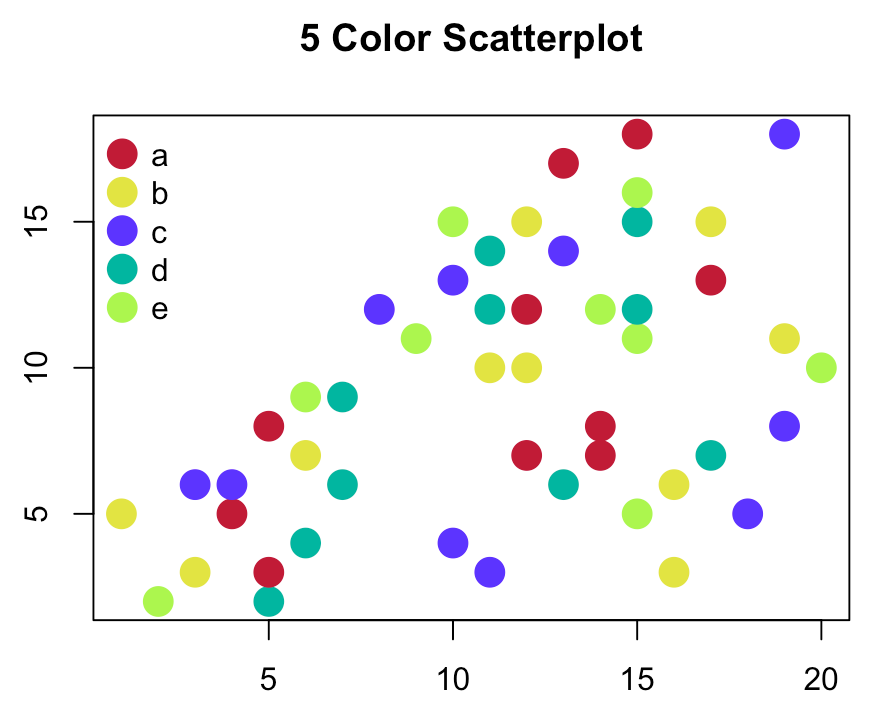
Colorscatter will also return an ordered list of colors each time it is run:
[1] "#C11736, #E2E442, #5C33FF, #00B6A0, #ACF64E"
And of course like colorbar, colorscatter will accept external palettes:
colorscatter(palette = paletteer_d("tvthemes::simpsons"), number = 5, shuffle = "yes")