


tqdm derives from the Arabic word taqaddum (تقدّم) which can mean "progress," and is an abbreviation for "I love you so much" in Spanish (te quiero demasiado).
Instantly make your loops show a smart progress meter - just wrap any iterable with tqdm(iterable), and you're done!
from tqdm import tqdm
for i in tqdm(range(10000)):
    ...
76%|████████████████████████ | 7568/10000 [00:33<00:10, 229.00it/s]
trange(N) can be also used as a convenient shortcut for tqdm(range(N)).


It can also be executed as a module with pipes:
$ seq 9999999 | tqdm --bytes | wc -l
75.2MB [00:00, 217MB/s]
9999999

$ tar -zcf - docs/ | tqdm --bytes --total `du -sb docs/ | cut -f1` \
    > backup.tgz
 32%|██████████▍                      | 8.89G/27.9G [00:42<01:31, 223MB/s]
Overhead is low -- about 60ns per iteration (80ns with tqdm.gui), and is unit tested against performance regression. By comparison, the well-established ProgressBar has an 800ns/iter overhead.
In addition to its low overhead, tqdm uses smart algorithms to predict the remaining time and to skip unnecessary iteration displays, which allows for a negligible overhead in most cases.
tqdm works on any platform (Linux, Windows, Mac, FreeBSD, NetBSD, Solaris/SunOS), in any console or in a GUI, and is also friendly with IPython/Jupyter notebooks.
tqdm does not require any dependencies (not even curses!), just Python and an environment supporting carriage return \r and line feed \n control characters.
Table of contents


pip install tqdm


Pull and install pre-release devel branch:
pip install "git+https://github.com/tqdm/tqdm.git@devel#egg=tqdm"conda install -c conda-forge tqdmThere are 3 channels to choose from:
snap install tqdm  # implies --stable, i.e. latest tagged release
snap install tqdm  --candidate  # master branch
snap install tqdm  --edge  # devel branch
Note that snap binaries are purely for CLI use (not import-able), and automatically set up bash tab-completion.
docker pull tqdm/tqdm
docker run -i --rm tqdm/tqdm --helpThere are other (unofficial) places where tqdm may be downloaded, particularly for CLI use:
The list of all changes is available either on GitHub's Releases:
tqdm is very versatile and can be used in a number of ways. The three main ones are given below.
Wrap tqdm() around any iterable:
from tqdm import tqdm
from time import sleep

text = ""
for char in tqdm(["a", "b", "c", "d"]):
    sleep(0.25)
    text = text + char
trange(i) is a special optimised instance of tqdm(range(i)):
from tqdm import trange

for i in trange(100):
    sleep(0.01)
Instantiation outside of the loop allows for manual control over tqdm():
pbar = tqdm(["a", "b", "c", "d"])
for char in pbar:
    sleep(0.25)
    pbar.set_description("Processing %s" % char)
Manual control of tqdm() updates using a with statement:
with tqdm(total=100) as pbar:
    for i in range(10):
        sleep(0.1)
        pbar.update(10)
If the optional variable total (or an iterable with len()) is provided, predictive stats are displayed.
with is also optional (you can just assign tqdm() to a variable, but in this case don't forget to del or close() at the end:
pbar = tqdm(total=100)
for i in range(10):
    sleep(0.1)
    pbar.update(10)
pbar.close()Perhaps the most wonderful use of tqdm is in a script or on the command line. Simply inserting tqdm (or python -m tqdm) between pipes will pass through all stdin to stdout while printing progress to stderr.
The example below demonstrate counting the number of lines in all Python files in the current directory, with timing information included.
$ time find . -name '*.py' -type f -exec cat \{} \; | wc -l
857365

real    0m3.458s
user    0m0.274s
sys     0m3.325s

$ time find . -name '*.py' -type f -exec cat \{} \; | tqdm | wc -l
857366it [00:03, 246471.31it/s]
857365

real    0m3.585s
user    0m0.862s
sys     0m3.358s
Note that the usual arguments for tqdm can also be specified.
$ find . -name '*.py' -type f -exec cat \{} \; |
    tqdm --unit loc --unit_scale --total 857366 >> /dev/null
100%|█████████████████████████████████| 857K/857K [00:04<00:00, 246Kloc/s]
Backing up a large directory?
$ tar -zcf - docs/ | tqdm --bytes --total `du -sb docs/ | cut -f1` \
  > backup.tgz
 44%|██████████████▊                   | 153M/352M [00:14<00:18, 11.0MB/s]
This can be beautified further:
$ BYTES=$(du -sb docs/ | cut -f1)
$ tar -cf - docs/ \
  | tqdm --bytes --total "$BYTES" --desc Processing | gzip \
  | tqdm --bytes --total "$BYTES" --desc Compressed --position 1 \
  > ~/backup.tgz
Processing: 100%|██████████████████████| 352M/352M [00:14<00:00, 30.2MB/s]
Compressed:  42%|█████████▎            | 148M/352M [00:14<00:19, 10.9MB/s]
Or done on a file level using 7-zip:
$ 7z a -bd -r backup.7z docs/ | grep Compressing \
  | tqdm --total $(find docs/ -type f | wc -l) --unit files \
  | grep -v Compressing
100%|██████████████████████████▉| 15327/15327 [01:00<00:00, 712.96files/s]
Pre-existing CLI programs already outputting basic progress information will benefit from tqdm's --update and --update_to flags:
$ seq 3 0.1 5 | tqdm --total 5 --update_to --null
100%|████████████████████████████████████| 5.0/5 [00:00<00:00, 9673.21it/s]
$ seq 10 | tqdm --update --null  # 1 + 2 + ... + 10 = 55 iterations
55it [00:00, 90006.52it/s]The most common issues relate to excessive output on multiple lines, instead of a neat one-line progress bar.
- Consoles in general: require support for carriage return (
CR,\r).- Some cloud logging consoles which don't support
\rproperly (cloudwatch, K8s) may benefit fromexport TQDM_POSITION=-1.
- Some cloud logging consoles which don't support
- Nested progress bars:
- Unicode:
- Environments which report that they support unicode will have solid smooth progressbars. The fallback is an
ascii-only bar. - Windows consoles often only partially support unicode and thus often require explicit ascii=True (also here). This is due to either normal-width unicode characters being incorrectly displayed as "wide", or some unicode characters not rendering.
- Environments which report that they support unicode will have solid smooth progressbars. The fallback is an
- Wrapping generators:
- Generator wrapper functions tend to hide the length of iterables.
tqdmdoes not. - Replace
tqdm(enumerate(...))withenumerate(tqdm(...))ortqdm(enumerate(x), total=len(x), ...). The same applies tonumpy.ndenumerate. - Replace
tqdm(zip(a, b))withzip(tqdm(a), b)or evenzip(tqdm(a), tqdm(b)). - The same applies to
itertools. - Some useful convenience functions can be found under
tqdm.contrib.
- Generator wrapper functions tend to hide the length of iterables.
- No intermediate output in docker-compose: use
docker-compose runinstead ofdocker-compose upandtty: true. - Overriding defaults via environment variables: e.g. in CI/cloud jobs,
export TQDM_MININTERVAL=5to avoid log spam. This override logic is handled by thetqdm.utils.envwrapdecorator (useful independent oftqdm).
If you come across any other difficulties, browse and file 
class tqdm():
  """
  Decorate an iterable object, returning an iterator which acts exactly
  like the original iterable, but prints a dynamically updating
  progressbar every time a value is requested.
  """

  @envwrap("TQDM_")  # override defaults via env vars
  def __init__(self, iterable=None, desc=None, total=None, leave=True,
               file=None, ncols=None, mininterval=0.1,
               maxinterval=10.0, miniters=None, ascii=None, disable=False,
               unit='it', unit_scale=False, dynamic_ncols=False,
               smoothing=0.3, bar_format=None, initial=0, position=None,
               postfix=None, unit_divisor=1000, write_bytes=False,
lock_args=None, nrows=None, colour=None, delay=0):- iterable : iterable, optional
Iterable to decorate with a progressbar. Leave blank to manually manage the updates.
- desc : str, optional
Prefix for the progressbar.
- total : int or float, optional
The number of expected iterations. If unspecified, len(iterable) is used if possible. If float("inf") or as a last resort, only basic progress statistics are displayed (no ETA, no progressbar). If
guiis True and this parameter needs subsequent updating, specify an initial arbitrary large positive number, e.g. 9e9.
- leave : bool, optional
If [default: True], keeps all traces of the progressbar upon termination of iteration. If
None, will leave only ifpositionis0.
- file :
io.TextIOWrapperorio.StringIO, optional Specifies where to output the progress messages (default: sys.stderr). Uses
file.write(str)andfile.flush()methods. For encoding, seewrite_bytes.
- file :
- ncols : int, optional
The width of the entire output message. If specified, dynamically resizes the progressbar to stay within this bound. If unspecified, attempts to use environment width. The fallback is a meter width of 10 and no limit for the counter and statistics. If 0, will not print any meter (only stats).
- mininterval : float, optional
Minimum progress display update interval [default: 0.1] seconds.
- maxinterval : float, optional
Maximum progress display update interval [default: 10] seconds. Automatically adjusts
minitersto correspond tominintervalafter long display update lag. Only works ifdynamic_minitersor monitor thread is enabled.
- miniters : int or float, optional
Minimum progress display update interval, in iterations. If 0 and
dynamic_miniters, will automatically adjust to equalmininterval(more CPU efficient, good for tight loops). If > 0, will skip display of specified number of iterations. Tweak this andminintervalto get very efficient loops. If your progress is erratic with both fast and slow iterations (network, skipping items, etc) you should set miniters=1.
- ascii : bool or str, optional
If unspecified or False, use unicode (smooth blocks) to fill the meter. The fallback is to use ASCII characters " 123456789#".
- disable : bool, optional
Whether to disable the entire progressbar wrapper [default: False]. If set to None, disable on non-TTY.
- unit : str, optional
String that will be used to define the unit of each iteration [default: it].
- unit_scale : bool or int or float, optional
If 1 or True, the number of iterations will be reduced/scaled automatically and a metric prefix following the International System of Units standard will be added (kilo, mega, etc.) [default: False]. If any other non-zero number, will scale
totalandn.
- dynamic_ncols : bool, optional
If set, constantly alters
ncolsandnrowsto the environment (allowing for window resizes) [default: False].
- smoothing : float, optional
Exponential moving average smoothing factor for speed estimates (ignored in GUI mode). Ranges from 0 (average speed) to 1 (current/instantaneous speed) [default: 0.3].
- bar_format : str, optional
Specify a custom bar string formatting. May impact performance. [default: '{l_bar}{bar}{r_bar}'], where l_bar='{desc}: {percentage:3.0f}% {n_fmt}/{total_fmt} [{elapsed}<{remaining}, ' '{rate_fmt}{postfix}]' Possible vars: l_bar, bar, r_bar, n, n_fmt, total, total_fmt, percentage, elapsed, elapsed_s, ncols, nrows, desc, unit, rate, rate_fmt, rate_noinv, rate_noinv_fmt, rate_inv, rate_inv_fmt, postfix, unit_divisor, remaining, remaining_s, eta. Note that a trailing ": " is automatically removed after {desc} if the latter is empty.
- initial : int or float, optional
The initial counter value. Useful when restarting a progress bar [default: 0]. If using float, consider specifying
{n:.3f}or similar inbar_format, or specifyingunit_scale.
- position : int, optional
Specify the line offset to print this bar (starting from 0) Automatic if unspecified. Useful to manage multiple bars at once (eg, from threads).
- postfix : dict or
*, optional Specify additional stats to display at the end of the bar. Calls
set_postfix(**postfix)if possible (dict).
- postfix : dict or
- unit_divisor : float, optional
[default: 1000], ignored unless
unit_scaleis True.
- write_bytes : bool, optional
Whether to write bytes. If (default: False) will write unicode.
- lock_args : tuple, optional
Passed to
refreshfor intermediate output (initialisation, iterating, and updating).
- nrows : int, optional
The screen height. If specified, hides nested bars outside this bound. If unspecified, attempts to use environment height. The fallback is 20.
- colour : str, optional
Bar colour (e.g. 'green', '#00ff00').
- delay : float, optional
Don't display until [default: 0] seconds have elapsed.
- delim : chr, optional
Delimiting character [default: 'n']. Use '0' for null. N.B.: on Windows systems, Python converts 'n' to 'rn'.
- buf_size : int, optional
String buffer size in bytes [default: 256] used when
delimis specified.
- bytes : bool, optional
If true, will count bytes, ignore
delim, and defaultunit_scaleto True,unit_divisorto 1024, andunitto 'B'.
- tee : bool, optional
If true, passes
stdinto bothstderrandstdout.
- update : bool, optional
If true, will treat input as newly elapsed iterations, i.e. numbers to pass to
update(). Note that this is slow (~2e5 it/s) since every input must be decoded as a number.
- update_to : bool, optional
If true, will treat input as total elapsed iterations, i.e. numbers to assign to
self.n. Note that this is slow (~2e5 it/s) since every input must be decoded as a number.
- null : bool, optional
If true, will discard input (no stdout).
- manpath : str, optional
Directory in which to install tqdm man pages.
- comppath : str, optional
Directory in which to place tqdm completion.
- log : str, optional
CRITICALERROR[default: 'INFO']NOTSET.
- out : decorated iterator.
class tqdm():
  def update(self, n=1):
      """
      Manually update the progress bar, useful for streams
      such as reading files.
      E.g.:
      >>> t = tqdm(total=filesize) # Initialise
      >>> for current_buffer in stream:
      ...    ...
      ...    t.update(len(current_buffer))
      >>> t.close()
      The last line is highly recommended, but possibly not necessary if
      ``t.update()`` will be called in such a way that ``filesize`` will be
      exactly reached and printed.

      Parameters
      ----------
      n  : int or float, optional
          Increment to add to the internal counter of iterations
          [default: 1]. If using float, consider specifying ``{n:.3f}``
          or similar in ``bar_format``, or specifying ``unit_scale``.

      Returns
      -------
      out  : bool or None
          True if a ``display()`` was triggered.
      """

  def close(self):
      """Cleanup and (if leave=False) close the progressbar."""

  def clear(self, nomove=False):
      """Clear current bar display."""

  def refresh(self):
      """
      Force refresh the display of this bar.

      Parameters
      ----------
      nolock  : bool, optional
          If ``True``, does not lock.
          If [default: ``False``]: calls ``acquire()`` on internal lock.
      lock_args  : tuple, optional
          Passed to internal lock's ``acquire()``.
          If specified, will only ``display()`` if ``acquire()`` returns ``True``.
      """

  def unpause(self):
      """Restart tqdm timer from last print time."""

  def reset(self, total=None):
      """
      Resets to 0 iterations for repeated use.

      Consider combining with ``leave=True``.

      Parameters
      ----------
      total  : int or float, optional. Total to use for the new bar.
      """

  def set_description(self, desc=None, refresh=True):
      """
      Set/modify description of the progress bar.

      Parameters
      ----------
      desc  : str, optional
      refresh  : bool, optional
          Forces refresh [default: True].
      """

  def set_postfix(self, ordered_dict=None, refresh=True, **tqdm_kwargs):
      """
      Set/modify postfix (additional stats)
      with automatic formatting based on datatype.

      Parameters
      ----------
      ordered_dict  : dict or OrderedDict, optional
      refresh  : bool, optional
          Forces refresh [default: True].
      kwargs  : dict, optional
      """

  @classmethod
  def write(cls, s, file=sys.stdout, end="\n"):
      """Print a message via tqdm (without overlap with bars)."""

  @property
  def format_dict(self):
      """Public API for read-only member access."""

  def display(self, msg=None, pos=None):
      """
      Use ``self.sp`` to display ``msg`` in the specified ``pos``.

      Consider overloading this function when inheriting to use e.g.:
      ``self.some_frontend(**self.format_dict)`` instead of ``self.sp``.

      Parameters
      ----------
      msg  : str, optional. What to display (default: ``repr(self)``).
      pos  : int, optional. Position to ``moveto``
        (default: ``abs(self.pos)``).
      """

  @classmethod
  @contextmanager
  def wrapattr(cls, stream, method, total=None, bytes=True, **tqdm_kwargs):
      """
      stream  : file-like object.
      method  : str, "read" or "write". The result of ``read()`` and
          the first argument of ``write()`` should have a ``len()``.

      >>> with tqdm.wrapattr(file_obj, "read", total=file_obj.size) as fobj:
      ...     while True:
      ...         chunk = fobj.read(chunk_size)
      ...         if not chunk:
      ...             break
      """

  @classmethod
  def pandas(cls, *targs, **tqdm_kwargs):
      """Registers the current `tqdm` class with `pandas`."""

def trange(*args, **tqdm_kwargs):
"""Shortcut for `tqdm(range(*args), **tqdm_kwargs)`."""def tqdm.contrib.tenumerate(iterable, start=0, total=None,
tqdm_class=tqdm.auto.tqdm, **tqdm_kwargs):
"""Equivalent of `numpy.ndenumerate` or builtin `enumerate`."""
def tqdm.contrib.tzip(iter1, *iter2plus, **tqdm_kwargs):
"""Equivalent of builtin `zip`."""
def tqdm.contrib.tmap(function, *sequences, **tqdm_kwargs):
"""Equivalent of builtin `map`."""class tqdm.notebook.tqdm(tqdm.tqdm):
"""IPython/Jupyter Notebook widget."""
class tqdm.auto.tqdm(tqdm.tqdm):
"""Automatically chooses beween `tqdm.notebook` and `tqdm.tqdm`."""
class tqdm.asyncio.tqdm(tqdm.tqdm):
"""Asynchronous version."""
@classmethod
def as_completed(cls, fs, *, loop=None, timeout=None, total=None,
**tqdm_kwargs):
"""Wrapper for `asyncio.as_completed`."""
class tqdm.gui.tqdm(tqdm.tqdm):
"""Matplotlib GUI version."""
class tqdm.tk.tqdm(tqdm.tqdm):
"""Tkinter GUI version."""
class tqdm.rich.tqdm(tqdm.tqdm):
"""`rich.progress` version."""
class tqdm.keras.TqdmCallback(keras.callbacks.Callback):
"""Keras callback for epoch and batch progress."""
class tqdm.dask.TqdmCallback(dask.callbacks.Callback):
"""Dask callback for task progress."""The tqdm.contrib package also contains experimental modules:
tqdm.contrib.itertools: Thin wrappers arounditertoolstqdm.contrib.concurrent: Thin wrappers aroundconcurrent.futurestqdm.contrib.slack: Posts to Slack botstqdm.contrib.discord: Posts to Discord botstqdm.contrib.telegram: Posts to Telegram botstqdm.contrib.bells: Automagically enables all optional featuresauto,pandas,slack,discord,telegram
- See the examples folder;
- import the module and run
help(); - consult the wiki;
- this has an excellent article on how to make a great progressbar;
- check out the slides from PyData London, or
- run the
.
Custom information can be displayed and updated dynamically on tqdm bars with the desc and postfix arguments:
from tqdm import tqdm, trange
from random import random, randint
from time import sleep

with trange(10) as t:
    for i in t:
        # Description will be displayed on the left
        t.set_description('GEN %i' % i)
        # Postfix will be displayed on the right,
        # formatted automatically based on argument's datatype
        t.set_postfix(loss=random(), gen=randint(1,999), str='h',
                      lst=[1, 2])
        sleep(0.1)

with tqdm(total=10, bar_format="{postfix[0]} {postfix[1][value]:>8.2g}",
          postfix=["Batch", {"value": 0}]) as t:
    for i in range(10):
        sleep(0.1)
        t.postfix[1]["value"] = i / 2
        t.update()
Points to remember when using {postfix[...]} in the bar_format string:
postfixalso needs to be passed as an initial argument in a compatible format, andpostfixwill be auto-converted to a string if it is adict-like object. To prevent this behaviour, insert an extra item into the dictionary where the key is not a string.
Additional bar_format parameters may also be defined by overriding format_dict, and the bar itself may be modified using ascii:
from tqdm import tqdm
class TqdmExtraFormat(tqdm):
    """Provides a `total_time` format parameter"""
    @property
    def format_dict(self):
        d = super(TqdmExtraFormat, self).format_dict
        total_time = d["elapsed"] * (d["total"] or 0) / max(d["n"], 1)
        d.update(total_time=self.format_interval(total_time) + " in total")
        return d

for i in TqdmExtraFormat(
      range(9), ascii=" .oO0",
      bar_format="{total_time}: {percentage:.0f}%|{bar}{r_bar}"):
    if i == 4:
        break
00:00 in total: 44%|0000. | 4/9 [00:00<00:00, 962.93it/s]Note that {bar} also supports a format specifier [width][type].
width- unspecified (default): automatic to fill
ncols int >= 0: fixed width overridingncolslogicint < 0: subtract from the automatic default
- unspecified (default): automatic to fill
typea: ascii (ascii=Trueoverride)u: unicode (ascii=Falseoverride)b: blank (ascii=" "override)
This means a fixed bar with right-justified text may be created by using: bar_format="{l_bar}{bar:10}|{bar:-10b}right-justified"
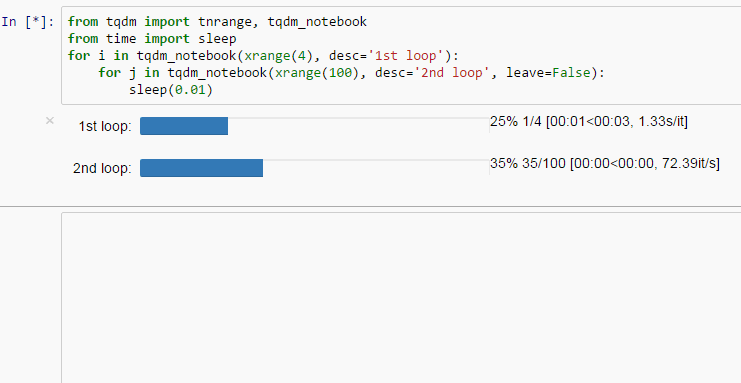
tqdm supports nested progress bars. Here's an example:
from tqdm.auto import trange
from time import sleep

for i in trange(4, desc='1st loop'):
    for j in trange(5, desc='2nd loop'):
        for k in trange(50, desc='3rd loop', leave=False):
            sleep(0.01)
For manual control over positioning (e.g. for multi-processing use), you may specify position=n where n=0 for the outermost bar, n=1 for the next, and so on. However, it's best to check if tqdm can work without manual position first.
from time import sleep
from tqdm import trange, tqdm
from multiprocessing import Pool, RLock, freeze_support

L = list(range(9))

def progresser(n):
    interval = 0.001 / (n + 2)
    total = 5000
    text = f"#{n}, est. {interval * total:<04.2}s"
    for _ in trange(total, desc=text, position=n):
        sleep(interval)

if __name__ == '__main__':
    freeze_support()  # for Windows support
    tqdm.set_lock(RLock())  # for managing output contention
    p = Pool(initializer=tqdm.set_lock, initargs=(tqdm.get_lock(),))
    p.map(progresser, L)
Note that in Python 3, tqdm.write is thread-safe:
from time import sleep
from tqdm import tqdm, trange
from concurrent.futures import ThreadPoolExecutor

L = list(range(9))

def progresser(n):
    interval = 0.001 / (n + 2)
    total = 5000
    text = f"#{n}, est. {interval * total:<04.2}s"
    for _ in trange(total, desc=text):
        sleep(interval)
    if n == 6:
        tqdm.write("n == 6 completed.")
        tqdm.write("`tqdm.write()` is thread-safe in py3!")

if __name__ == '__main__':
    with ThreadPoolExecutor() as p:
p.map(progresser, L)tqdm can easily support callbacks/hooks and manual updates. Here's an example with urllib:
``urllib.urlretrieve`` documentation
[...]
If present, the hook function will be called once
on establishment of the network connection and once after each block read
thereafter. The hook will be passed three arguments; a count of blocks
transferred so far, a block size in bytes, and the total size of the file.
[...]
import urllib, os
from tqdm import tqdm
urllib = getattr(urllib, 'request', urllib)

class TqdmUpTo(tqdm):
    """Provides `update_to(n)` which uses `tqdm.update(delta_n)`."""
    def update_to(self, b=1, bsize=1, tsize=None):
        """
        b  : int, optional
            Number of blocks transferred so far [default: 1].
        bsize  : int, optional
            Size of each block (in tqdm units) [default: 1].
        tsize  : int, optional
            Total size (in tqdm units). If [default: None] remains unchanged.
        """
        if tsize is not None:
            self.total = tsize
        return self.update(b * bsize - self.n)  # also sets self.n = b * bsize

eg_link = "https://caspersci.uk.to/matryoshka.zip"
with TqdmUpTo(unit='B', unit_scale=True, unit_divisor=1024, miniters=1,
              desc=eg_link.split('/')[-1]) as t:  # all optional kwargs
    urllib.urlretrieve(eg_link, filename=os.devnull,
                       reporthook=t.update_to, data=None)
    t.total = t.n
Inspired by twine#242. Functional alternative in examples/tqdm_wget.py.
It is recommend to use miniters=1 whenever there is potentially large differences in iteration speed (e.g. downloading a file over a patchy connection).
Wrapping read/write methods
To measure throughput through a file-like object's read or write methods, use CallbackIOWrapper:
from tqdm.auto import tqdm
from tqdm.utils import CallbackIOWrapper

with tqdm(total=file_obj.size,
          unit='B', unit_scale=True, unit_divisor=1024) as t:
    fobj = CallbackIOWrapper(t.update, file_obj, "read")
    while True:
        chunk = fobj.read(chunk_size)
        if not chunk:
            break
    t.reset()
    # ... continue to use `t` for something else
Alternatively, use the even simpler wrapattr convenience function, which would condense both the urllib and CallbackIOWrapper examples down to:
import urllib, os
from tqdm import tqdm

eg_link = "https://caspersci.uk.to/matryoshka.zip"
response = getattr(urllib, 'request', urllib).urlopen(eg_link)
with tqdm.wrapattr(open(os.devnull, "wb"), "write",
                   miniters=1, desc=eg_link.split('/')[-1],
                   total=getattr(response, 'length', None)) as fout:
    for chunk in response:
        fout.write(chunk)
The requests equivalent is nearly identical:
import requests, os
from tqdm import tqdm

eg_link = "https://caspersci.uk.to/matryoshka.zip"
response = requests.get(eg_link, stream=True)
with tqdm.wrapattr(open(os.devnull, "wb"), "write",
                   miniters=1, desc=eg_link.split('/')[-1],
                   total=int(response.headers.get('content-length', 0))) as fout:
    for chunk in response.iter_content(chunk_size=4096):
        fout.write(chunk)
Custom callback
tqdm is known for intelligently skipping unnecessary displays. To make a custom callback take advantage of this, simply use the return value of update(). This is set to True if a display() was triggered.
from tqdm.auto import tqdm as std_tqdm

def external_callback(*args, **kwargs):
    ...

class TqdmExt(std_tqdm):
    def update(self, n=1):
        displayed = super(TqdmExt, self).update(n)
        if displayed:
            external_callback(**self.format_dict)
return displayedNote that break isn't currently caught by asynchronous iterators. This means that tqdm cannot clean up after itself in this case:
from tqdm.asyncio import tqdm

async for i in tqdm(range(9)):
    if i == 2:
        break
Instead, either call pbar.close() manually or use the context manager syntax:
from tqdm.asyncio import tqdm

with tqdm(range(9)) as pbar:
    async for i in pbar:
        if i == 2:
breakDue to popular demand we've added support for pandas -- here's an example for DataFrame.progress_apply and DataFrameGroupBy.progress_apply:
import pandas as pd
import numpy as np
from tqdm import tqdm

df = pd.DataFrame(np.random.randint(0, 100, (100000, 6)))

# Register `pandas.progress_apply` and `pandas.Series.map_apply` with `tqdm`
# (can use `tqdm.gui.tqdm`, `tqdm.notebook.tqdm`, optional kwargs, etc.)
tqdm.pandas(desc="my bar!")

# Now you can use `progress_apply` instead of `apply`
# and `progress_map` instead of `map`
df.progress_apply(lambda x: x**2)
# can also groupby:
# df.groupby(0).progress_apply(lambda x: x**2)
In case you're interested in how this works (and how to modify it for your own callbacks), see the examples folder or import the module and run help().
A keras callback is also available:
from tqdm.keras import TqdmCallback

...

model.fit(..., verbose=0, callbacks=[TqdmCallback()])A dask callback is also available:
from tqdm.dask import TqdmCallback
with TqdmCallback(desc="compute"):
...
arr.compute()
# or use callback globally
cb = TqdmCallback(desc="global")
cb.register()
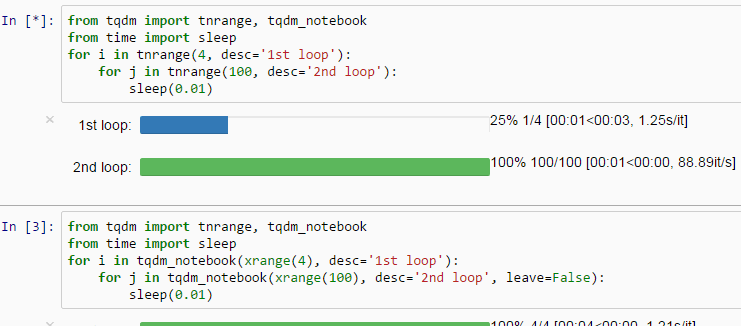
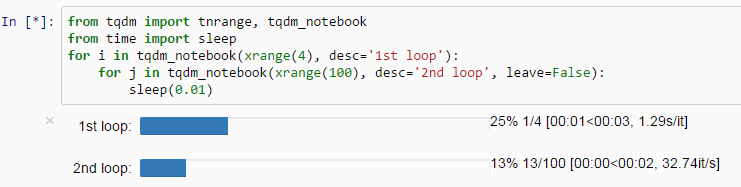
arr.compute()IPython/Jupyter is supported via the tqdm.notebook submodule:
from tqdm.notebook import trange, tqdm
from time import sleep

for i in trange(3, desc='1st loop'):
    for j in tqdm(range(100), desc='2nd loop'):
        sleep(0.01)
In addition to tqdm features, the submodule provides a native Jupyter widget (compatible with IPython v1-v4 and Jupyter), fully working nested bars and colour hints (blue: normal, green: completed, red: error/interrupt, light blue: no ETA); as demonstrated below.
The notebook version supports percentage or pixels for overall width (e.g.: ncols='100%' or ncols='480px').
It is also possible to let tqdm automatically choose between console or notebook versions by using the autonotebook submodule:
from tqdm.autonotebook import tqdm
tqdm.pandas()
Note that this will issue a TqdmExperimentalWarning if run in a notebook since it is not meant to be possible to distinguish between jupyter notebook and jupyter console. Use auto instead of autonotebook to suppress this warning.
Note that notebooks will display the bar in the cell where it was created. This may be a different cell from the one where it is used. If this is not desired, either
- delay the creation of the bar to the cell where it must be displayed, or
- create the bar with
display=False, and in a later cell calldisplay(bar.container):
from tqdm.notebook import tqdm
pbar = tqdm(..., display=False)
# different cell
display(pbar.container)The keras callback has a display() method which can be used likewise:
from tqdm.keras import TqdmCallback
cbk = TqdmCallback(display=False)
# different cell
cbk.display()
model.fit(..., verbose=0, callbacks=[cbk])Another possibility is to have a single bar (near the top of the notebook) which is constantly re-used (using reset() rather than close()). For this reason, the notebook version (unlike the CLI version) does not automatically call close() upon Exception.
from tqdm.notebook import tqdm
pbar = tqdm()
# different cell
iterable = range(100)
pbar.reset(total=len(iterable)) # initialise with new `total`
for i in iterable:
pbar.update()
pbar.refresh() # force print final status but don't `close()`To change the default arguments (such as making dynamic_ncols=True), simply use built-in Python magic:
from functools import partial
from tqdm import tqdm as std_tqdm
tqdm = partial(std_tqdm, dynamic_ncols=True)
For further customisation, tqdm may be inherited from to create custom callbacks (as with the TqdmUpTo example above) or for custom frontends (e.g. GUIs such as notebook or plotting packages). In the latter case:
def __init__()to callsuper().__init__(..., gui=True)to disable terminalstatus_printercreation.- Redefine:
close(),clear(),display().
Consider overloading display() to use e.g. self.frontend(**self.format_dict) instead of self.sp(repr(self)).
Some submodule examples of inheritance:
- tqdm/notebook.py
- tqdm/gui.py
- tqdm/tk.py
- tqdm/contrib/slack.py
- tqdm/contrib/discord.py
- tqdm/contrib/telegram.py
You can use a tqdm as a meter which is not monotonically increasing. This could be because n decreases (e.g. a CPU usage monitor) or total changes.
One example would be recursively searching for files. The total is the number of objects found so far, while n is the number of those objects which are files (rather than folders):
from tqdm import tqdm
import os.path

def find_files_recursively(path, show_progress=True):
    files = []
    # total=1 assumes `path` is a file
    t = tqdm(total=1, unit="file", disable=not show_progress)
    if not os.path.exists(path):
        raise IOError("Cannot find:" + path)

    def append_found_file(f):
        files.append(f)
        t.update()

    def list_found_dir(path):
        """returns os.listdir(path) assuming os.path.isdir(path)"""
        listing = os.listdir(path)
        # subtract 1 since a "file" we found was actually this directory
        t.total += len(listing) - 1
        # fancy way to give info without forcing a refresh
        t.set_postfix(dir=path[-10:], refresh=False)
        t.update(0)  # may trigger a refresh
        return listing

    def recursively_search(path):
        if os.path.isdir(path):
            for f in list_found_dir(path):
                recursively_search(os.path.join(path, f))
        else:
            append_found_file(path)

    recursively_search(path)
    t.set_postfix(dir=path)
    t.close()
    return files
Using update(0) is a handy way to let tqdm decide when to trigger a display refresh to avoid console spamming.
This is a work in progress (see #737).
Since tqdm uses a simple printing mechanism to display progress bars, you should not write any message in the terminal using print() while a progressbar is open.
To write messages in the terminal without any collision with tqdm bar display, a .write() method is provided:
from tqdm.auto import tqdm, trange
from time import sleep

bar = trange(10)
for i in bar:
    # Print using tqdm class method .write()
    sleep(0.1)
    if not (i % 3):
        tqdm.write("Done task %i" % i)
    # Can also use bar.write()
By default, this will print to standard output sys.stdout. but you can specify any file-like object using the file argument. For example, this can be used to redirect the messages writing to a log file or class.
If using a library that can print messages to the console, editing the library by replacing print() with tqdm.write() may not be desirable. In that case, redirecting sys.stdout to tqdm.write() is an option.
To redirect sys.stdout, create a file-like class that will write any input string to tqdm.write(), and supply the arguments file=sys.stdout, dynamic_ncols=True.
A reusable canonical example is given below:
from time import sleep
import contextlib
import sys
from tqdm import tqdm
from tqdm.contrib import DummyTqdmFile


@contextlib.contextmanager
def std_out_err_redirect_tqdm():
    orig_out_err = sys.stdout, sys.stderr
    try:
        sys.stdout, sys.stderr = map(DummyTqdmFile, orig_out_err)
        yield orig_out_err[0]
    # Relay exceptions
    except Exception as exc:
        raise exc
    # Always restore sys.stdout/err if necessary
    finally:
        sys.stdout, sys.stderr = orig_out_err

def some_fun(i):
    print("Fee, fi, fo,".split()[i])

# Redirect stdout to tqdm.write() (don't forget the `as save_stdout`)
with std_out_err_redirect_tqdm() as orig_stdout:
    # tqdm needs the original stdout
    # and dynamic_ncols=True to autodetect console width
    for i in tqdm(range(3), file=orig_stdout, dynamic_ncols=True):
        sleep(.5)
        some_fun(i)

# After the `with`, printing is restored
print("Done!")Similar to sys.stdout/sys.stderr as detailed above, console logging may also be redirected to tqdm.write().
Warning: if also redirecting sys.stdout/sys.stderr, make sure to redirect logging first if needed.
Helper methods are available in tqdm.contrib.logging. For example:
import logging
from tqdm import trange
from tqdm.contrib.logging import logging_redirect_tqdm

LOG = logging.getLogger(__name__)

if __name__ == '__main__':
    logging.basicConfig(level=logging.INFO)
    with logging_redirect_tqdm():
        for i in trange(9):
            if i == 4:
                LOG.info("console logging redirected to `tqdm.write()`")
# logging restoredtqdm implements a few tricks to increase efficiency and reduce overhead.
- Avoid unnecessary frequent bar refreshing:
minintervaldefines how long to wait between each refresh.tqdmalways gets updated in the background, but it will display only everymininterval. - Reduce number of calls to check system clock/time.
minintervalis more intuitive to configure thanminiters. A clever adjustment systemdynamic_miniterswill automatically adjustminitersto the amount of iterations that fit into timemininterval. Essentially,tqdmwill check if it's time to print without actually checking time. This behaviour can be still be bypassed by manually settingminiters.
However, consider a case with a combination of fast and slow iterations. After a few fast iterations, dynamic_miniters will set miniters to a large number. When iteration rate subsequently slows, miniters will remain large and thus reduce display update frequency. To address this:
maxintervaldefines the maximum time between display refreshes. A concurrent monitoring thread checks for overdue updates and forces one where necessary.
The monitoring thread should not have a noticeable overhead, and guarantees updates at least every 10 seconds by default. This value can be directly changed by setting the monitor_interval of any tqdm instance (i.e. t = tqdm.tqdm(...); t.monitor_interval = 2). The monitor thread may be disabled application-wide by setting tqdm.tqdm.monitor_interval = 0 before instantiation of any tqdm bar.
You can buy tqdm branded merch now!


All source code is hosted on GitHub. Contributions are welcome.
See the CONTRIBUTING file for more information.
Developers who have made significant contributions, ranked by SLoC (surviving lines of code, git fame -wMC --excl '\.(png|gif|jpg)$'), are:
| Name | ID | SLoC | Notes |
|---|---|---|---|
| Casper da Costa-Luis | casperdcl | ~80% | primary maintainer |
Stephen Larroque Martin Zugnoni Daniel Ecer Richard Sheridan Guangshuo Chen Helio Machado Kyle Altendorf |
lrq3000 martinzugnoni de-code richardsheridan chengs 0x2b3bfa0 altendky |
~9% ~3% ~2% ~1% ~1% ~1% <1% |
team member |
Noam Yorav-Raphael Matthew Stevens |
<1% <1% |
original author |
|
| Hadrien Mary | hadim | <1% | team member |
| Mikhail Korobov | kmike | <1% | team member |
A list is available on this wiki page.
Open Source (OSI approved):
Citation information:


