install.packages('ROpenCVLite')
ROpenCVLite::installOpenCV()library(leti)
filename<-system.file('INSTAseq_ch03.csv', package='leti')
points<-read.table(filename, sep=',', header=TRUE)
#lets look at out points
plot(points$x, points$y, pch=16, ylim=rev(range(points$y)), asp = 1, cex=0.5 )
#get the file path for the TIFF file we want to load
tiff.file<-system.file('INSTAseq_ch03.tif', package='leti')
#get the intensities from the coordinates
out<-get.intensity(tiff.file, points$x, points$y, points$z)
#we are interested in normalized log-coordinates
log2int<-log2(out$intensity+1)
log2int<-log2int - min(log2int)
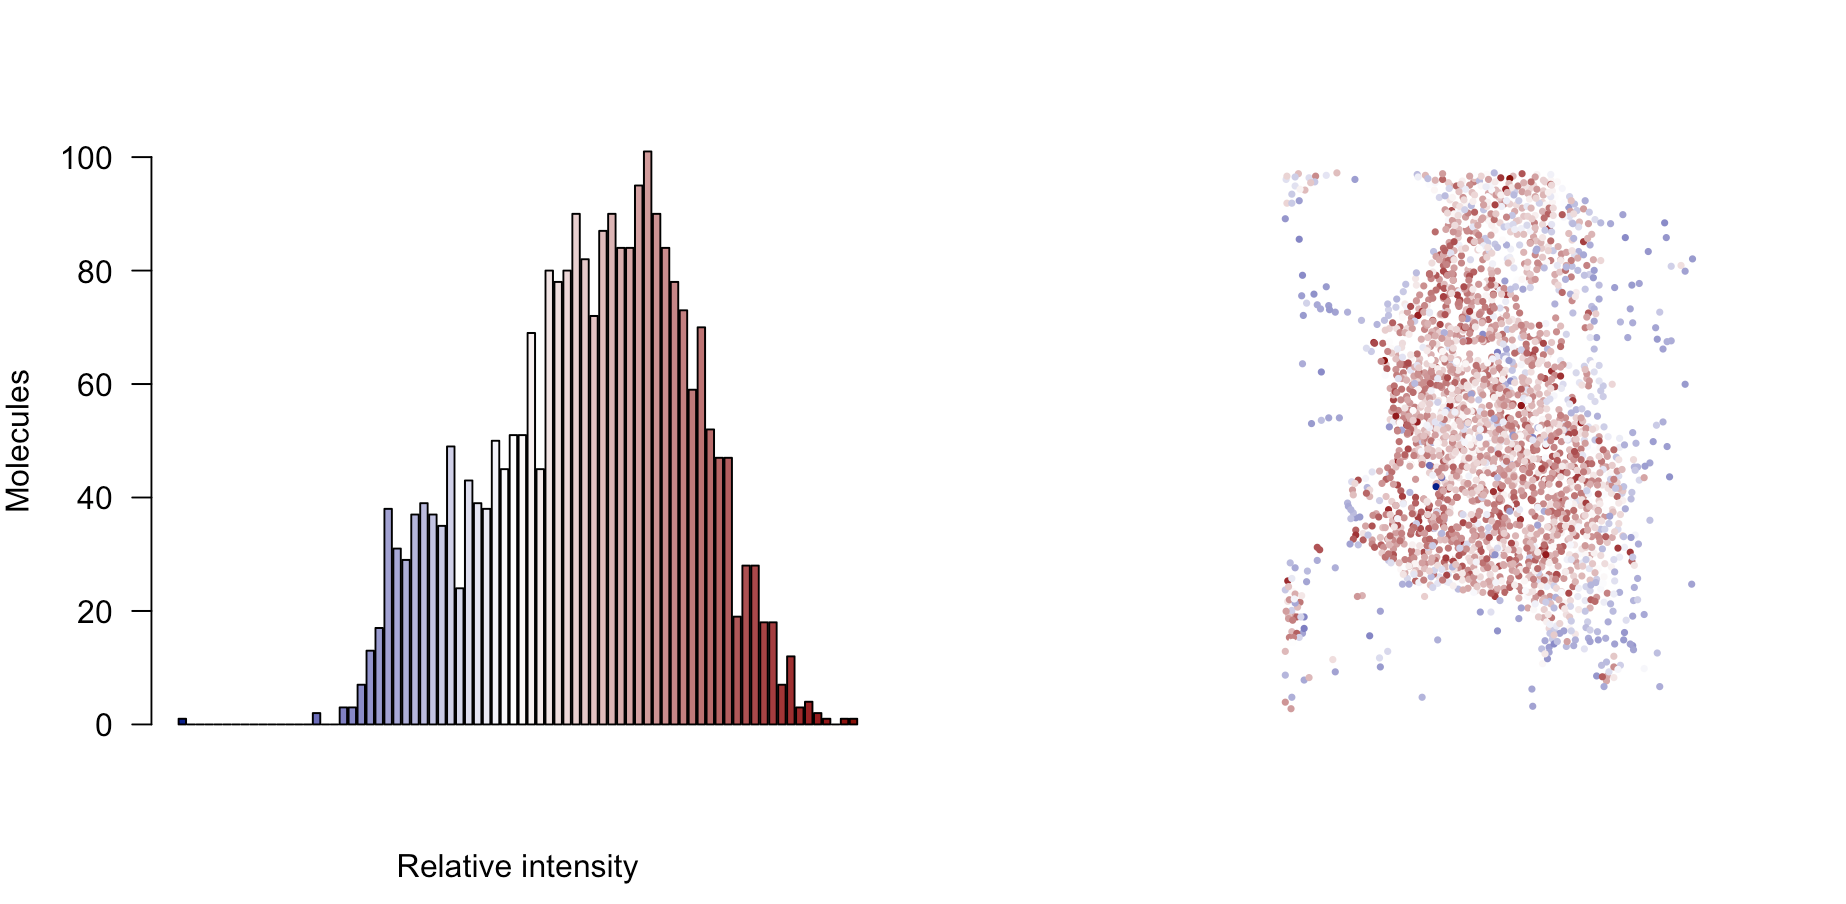
par(mfrow=c(1,2))
palette<- colorRamp(c("darkblue", "white", "darkred"))
histogram<-hist(log2int, breaks=100, plot=F)
barplot(histogram$counts,
col = rgb(palette(seq_along(histogram$counts) / max(seq_along(histogram$counts))), max=255),
las=1, ylab='Molecules',
xlab='Relative intensity'
)
color<- rgb(palette(log2int / max(log2int)), max=255)
plot(points$x, points$y,
pch=16,
ylim=rev(range(points$y)),
asp = 1, cex=0.5, axes=F, ylab='', xlab='', col=color )