


monthly-returns-heatmap is a simple Python library for creating Monthly Returns Heatmap from Pandas series with ease.
Let's create a returns heatmap for SPY (S&P 500 Spider ETF).
First, let's download SPY's daily close prices from Google finance.
from pandas_datareader import data
prices = data.get_data_google("SPY")['Close']
returns = prices.pct_change()
Next, we'll import monthly_returns_heatmap and plot the monthly return heatmap:
import monthly_returns_heatmap as mrh

returns.plot_monthly_returns_heatmap()
# mrh.plot(returns) # <== or using direct call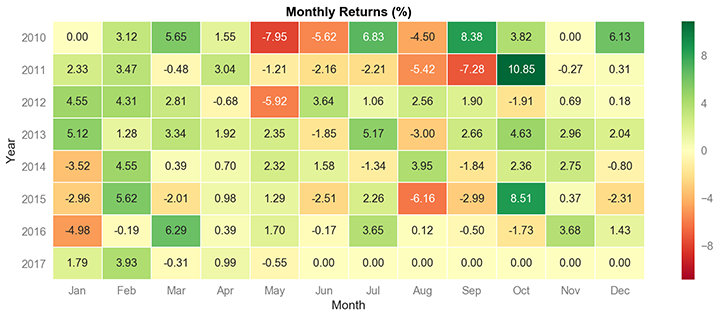
Getting heatmap data only (no plotting)
heatmap = prices.get_monthly_returns_heatmap()
# heatmap = mrh.get(returns) # <== or using direct call

print(heatmap)

# prints:

Month       Jan        Feb        Mar        Apr  ...        Dec
Year
2010   0.000000   0.031195   0.056529   0.015470  ...   0.061271
2011   0.023300   0.034737  -0.004807   0.030413  ...   0.003117
2012   0.045498   0.043137   0.028129  -0.006751  ...   0.001759
2013   0.051190   0.012759   0.033375   0.019212  ...   0.020387
2014  -0.035248   0.045516   0.003865   0.006951  ...  -0.008012
2015  -0.029629   0.056205  -0.020080   0.009834  ...  -0.023096
2016  -0.049787  -0.001910   0.062943   0.003941  ...   0.014293
2017 0.017895 0.039292 -0.003087 0.009926 ... 0.000000is_prices- set toTrueif the data used is price data instead of returns datacompounded- set toFalseif the you don't want the calculation to use compounded returnseoy- set toTrueto add a End Of Year column with total yearly returns
title- Heatmap title (defaults to"Monthly Returns (%)")title_color- Heatmap title color (defaults to"black")title_size- Heatmap title font size (defaults to12)annot_size- Returns boxes font size (defaults to10)figsize- Heatmap figure size (defaults toNone)cmap- Color map (defaults to"RdYlGn")cbar- Show color bar? (defaults toTrue)square- Force squere returns boxes? (defaults toFalse)is_prices- set toTrueif the data used is price data instead of returns datacompounded- set toFalseif the you don't want the calculation to use compounded returnseoy- set toTrueto add a End Of Year column with total yearly returns
Install monthly_returns_heatmap using pip:
$ pip install monthly_returns_heatmap --upgrade --no-cache-dir- Python >=3.4
- Pandas (tested to work with >=0.18.1)
- Matplotlib (tested to work with >=1.5.3)
- Seaborn (tested to work with >=0.7)
monthly-returns-heatmap is distributed under the GNU Lesser General Public License v3.0. See the LICENSE.txt file in the release for details.
Please drop me an note with any feedback you have.
Ran Aroussi

