volkovlabs / volkovlabs-grapi-datasource Goto Github PK
View Code? Open in Web Editor NEWGrafana HTTP API Data Source for @grafana.
Home Page: https://docs.volkovlabs.io
License: Apache License 2.0
Grafana HTTP API Data Source for @grafana.
Home Page: https://docs.volkovlabs.io
License: Apache License 2.0


Hello,
I watched the YouTube video well.
An error occurred while proceeding according to the installation guide, so please inquire.

I'm using grafana 9.4.7 version
and installed the app through Grafana plugins.
grafana log ::
logger=context userId=3 orgId=1 uname=sa-anotations t=2023-04-17T14:07:00.12210861+09:00 level=info msg="Access denied" userID=3 accessErrorID=ACE3144968927 permissions="action:alert.provisioning:read scopes:"
logger=context userId=3 orgId=1 uname=sa-anotations t=2023-04-17T14:07:00.122516508+09:00 level=info msg="Request Completed" method=GET path=/api/v1/provisioning/alert-rules status=403 remote_addr=[hide] time_ms=90 duration=90.233508ms size=173 referer= handler=/api/v1/provisioning/alert-rules
grafana ini
[unified_alerting]
enabled = true
How we can run health checks using grafana http api. Is there any way we can get health check information for all data sources while we're retrieving data sources.
The API user was set as a viewer, but when I changed to admin I could see all dashboard UIDs and the plugin was working as expected.
I have a follow-up question, Regarding the string that is in the text column, is it possible to separate the labels into rows? I
tried using transform → extract fields but it creates a bit of a mess.
From Slack:
then we can hide uncessecery labels easily and you would be able to filter better in the table between the different alert
labels, in general you would get more information in cleaner in a table.
Add the duration of the alarm state to a new row.
To allow deep linking to alert rules in grafana, could you please add the UUID field in the annotation list for alert ?
It would be great to have color coded alert states like the built-in alerts/annotations does. And maybe a different color for annotations (blue/selectable).
Pending (yellow), firing (red) and resolved (green)
Seeing a single color for everything makes it difficult to tell if the alert has fired or not - you'd have to check the values of the alert and you'd have to know what A, B, C, etc. actually mean.
Thanks!
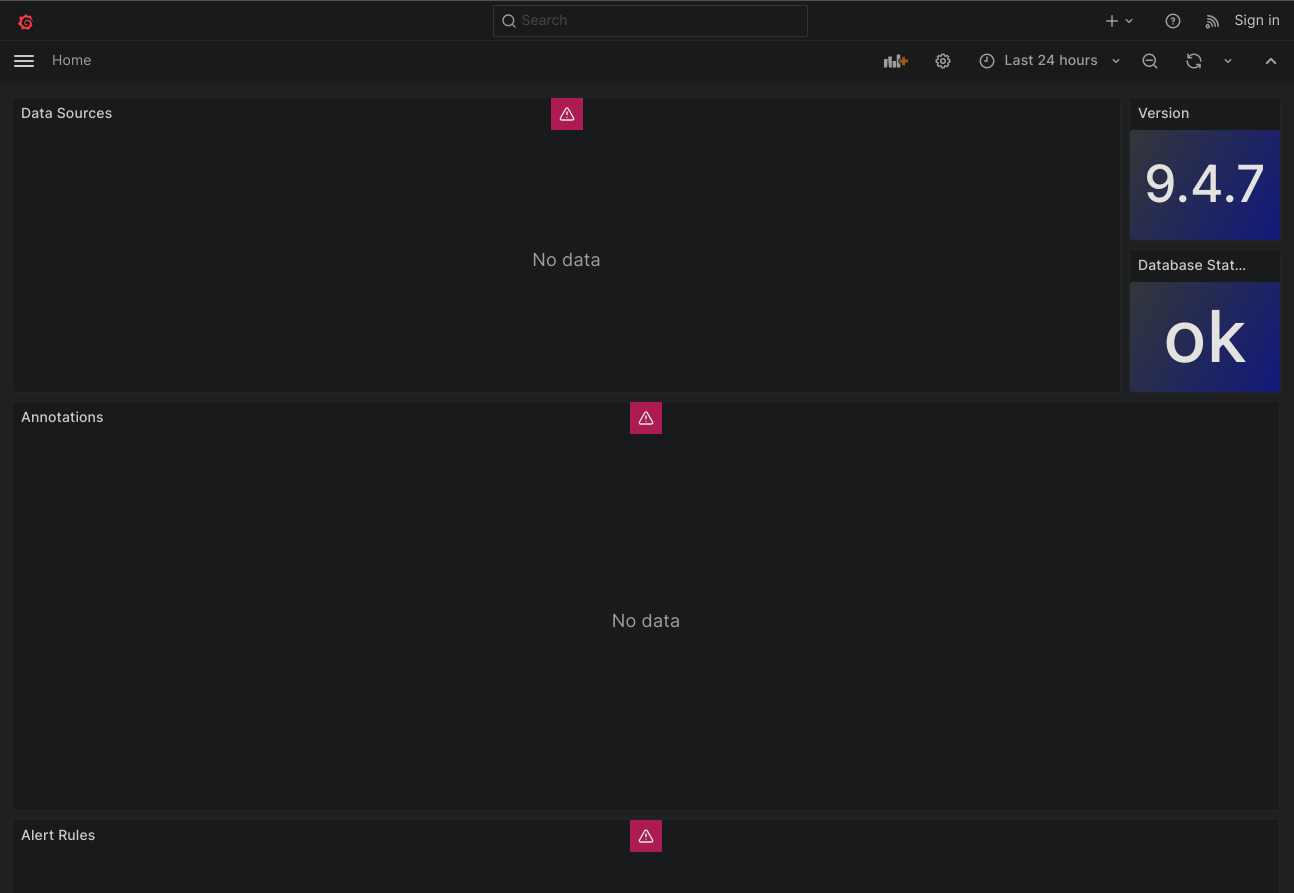
Good morning, I'm having some issue displaying all my Grafana alerts/annotations correctly with the Grafana HTTP API data source.
I've installed it and connected it with my token correctly, and in fact some of the panel (the two showing the infos/health status) work correctly, but the Annotations panel doesn't seems to be working and give me the following error:

What could be possibly causing this error?
Grafana HTTP API version: 1.2.0
Grafana version: 9.3.8
Main Data-source: Prometheus

Thanks a lot!
Hello! It's not entirely clear whether it's possible to interact with databases via the Grafana HTTP API using a plugin. For instance, building a query to a database from Grafana to Grafana via a plugin.
Get Dashboards and Metadata at the following endpoint:
/api/search?type=dash-db
This would be very helpful for cross-referencing uids and reviewing Tag implementation in my use case.
Wouldn't it be nice if we could use this datasource to set variables in grafana dashboards ?
Right now, grafana returns:
"Error updating options: Couldn't find a query runner that matches supplied arguments."
This way, one could iterate over current alerts and repeat details for each alert. And much more :)
I've followed your tutorial on using the text pattern function to filter on specific values as well as using grafana variables.
I was wondering if the text pattern had the ability to filter across multiple parameters or is there a specific syntax to pass it multiple parameters?
For example,
I got an OR function to work by entering the following examples:
metric_type = discrete | metric_aggregate = mean
I get the equivalent of metric_type equals 'discrete' OR metric_aggregate equals 'mean'
And if I used a set of variables:
metric_type = ${metric_type:regex} | metric_aggregate = ${metric_aggregate:regex}
I get the equivalent of metric_type equals any values in variable $metric_type OR metric_aggregate equals any values in variable $metric_aggregate
But now I am looking for the ability to pass an AND function through:
Basically the same scenario stated above but with AND as the operator instead of OR.
The variable scenario is what I'm trying to accomplish:
metric_type = ${metric_type:regex} & metric_aggregate = ${metric_aggregate:regex}
I want the equivalent of metric_type equals any values in variable $metric_type and metric_aggregate equals any values in variable $metric_aggregate
I am not very fluent in regex so there may be a syntax that I am unfamiliar with that will satisfy my case.
But, I was wondering if the Text Pattern function had the ability to resolve multiple parameters by separating the statement with a specific character or if you could point me in the direction of a specific regex syntax that would represent the equivalent of an AND operator.
Hello,
I cloned the repo and did yarn install, yarn build and yarn start
docker ps
Output
CONTAINER ID   IMAGE                                        COMMAND                  CREATED          STATUS          PORTS                    NAMES
2b83d03dd532   grafana-volkovlabs-grapi-datasource_server   "docker-entrypoint.s…"   16 minutes ago   Up 16 minutes   0.0.0.0:3001->3001/tcp   server
72ba44ab82d4   ghcr.io/volkovlabs/app:latest                "/bin/bash /entrypoi…"   16 minutes ago   Up 16 minutes   0.0.0.0:3000->3000/tcp   grafana
776c96d17888   timescale/timescaledb:latest-pg12            "docker-entrypoint.s…"   16 minutes ago   Up 16 minutes   0.0.0.0:5432->5432/tcp   timescale
I see this in the logs
grafana      | logger=ngalert.scheduler rule_uid=ox_h9f-4k org_id=1 version=2 attempt=0 now=2023-04-17T19:54:20Z t=2023-04-17T19:54:20.060784933Z level=error msg="Failed to evaluate rule" error="failed to execute query A: db query error: failed to connect to server - please inspect Grafana server log for details" duration=0s
grafana      | logger=ngalert.sender.router rule_uid=ox_h9f-4k org_id=1 t=2023-04-17T19:54:20.07547042Z level=info msg="Sending alerts to local notifier" count=1
grafana      | logger=tsdb.postgres rule_uid=ox_h9f-4k org_id=1 t=2023-04-17T19:54:30.041230173Z level=error msg="Query error" err="dial tcp: lookup host.docker.internal on 127.0.0.11:53: no such host"
grafana      | logger=ngalert.scheduler rule_uid=ox_h9f-4k org_id=1 version=2 attempt=0 now=2023-04-17T19:54:30Z t=2023-04-17T19:54:30.041348613Z level=error msg="Failed to evaluate rule" error="failed to execute query A: db query error: failed to connect to server - please inspect Grafana server log for details" duration=0s
grafana      | logger=context t=2023-04-17T19:54:36.253509151Z level=warn msg="failed to look up session from cookie" error="user token not found"
grafana      | logger=context userId=0 orgId=1 uname= t=2023-04-17T19:54:38.346575539Z level=info msg="Request Completed" method=GET path=/img/online.svg status=404 remote_addr=172.28.0.1 time_ms=122 duration=122.497754ms size=35423 referer=http://localhost:3000/ handler=notfound
grafana      | logger=context userId=0 orgId=1 uname= t=2023-04-17T19:54:38.364779174Z level=info msg="Request Completed" method=GET path=/img/warn-tiny.svg status=404 remote_addr=172.28.0.1 time_ms=122 duration=122.954763ms size=35423 referer=http://localhost:3000/ handler=notfound
grafana      | logger=context userId=0 orgId=1 uname= t=2023-04-17T19:54:38.410828251Z level=info msg="Request Completed" method=GET path=/img/critical.svg status=404 remote_addr=172.28.0.1 time_ms=122 duration=122.825824ms size=35423 referer=http://localhost:3000/ handler=notfound
grafana      | logger=context userId=0 orgId=1 uname= t=2023-04-17T19:54:38.437568512Z level=info msg="Request Completed" method=GET path=/img/background_tease.jpg status=404 remote_addr=172.28.0.1 time_ms=123 duration=123.541023ms size=35423 referer=http://localhost:3000/ handler=notfound
grafana      | logger=tsdb.postgres rule_uid=ox_h9f-4k org_id=1 t=2023-04-17T19:54:40.036217835Z level=error msg="Query error" err="dial tcp: lookup host.docker.internal on 127.0.0.11:53: no such host"
grafana      | logger=ngalert.scheduler rule_uid=ox_h9f-4k org_id=1 version=2 attempt=0 now=2023-04-17T19:54:40Z t=2023-04-17T19:54:40.036314925Z level=error msg="Failed to evaluate rule" error="failed to execute query A: db query error: failed to connect to server - please inspect Grafana server log for details" duration=0s
grafana      | logger=context userId=0 orgId=1 uname= t=2023-04-17T19:54:40.667093259Z level=info msg="Request Completed" method=GET path=/api/live/ws status=-1 remote_addr=172.28.0.1 time_ms=23 duration=23.225132ms size=0 referer= handler=/api/live/ws
grafana      | logger=live t=2023-04-17T19:54:41.221323494Z level=info msg="Initialized channel handler" channel=grafana/dashboard/uid/O4tc_E6Gz address=grafana/dashboard/uid/O4tc_E6Gz
grafana      | logger=context t=2023-04-17T19:54:42.008990479Z level=warn msg="invalid API key" error="invalid API key" traceID=
grafana      | logger=context userId=0 orgId=0 uname= t=2023-04-17T19:54:42.009111343Z level=info msg="Request Completed" method=GET path=/api/datasources status=401 remote_addr=172.28.0.1 time_ms=0 duration=846.522µs size=82 referer=
grafana      | logger=context t=2023-04-17T19:54:42.009191441Z level=warn msg="invalid API key" error="invalid API key" traceID=
grafana      | logger=context userId=0 orgId=0 uname= t=2023-04-17T19:54:42.00924422Z level=info msg="Request Completed" method=GET path=/api/annotations status=401 remote_addr=172.28.0.1 time_ms=0 duration=998.005µs size=82 referer=
grafana      | logger=context t=2023-04-17T19:54:42.009182135Z level=warn msg="invalid API key" error="invalid API key" traceID=
grafana      | logger=context userId=0 orgId=0 uname= t=2023-04-17T19:54:42.009336541Z level=info msg="Request Completed" method=GET path=/api/v1/provisioning/alert-rules status=401 remote_addr=172.28.0.1 time_ms=0 duration=875.175µs size=82 referer=
grafana      | logger=data-proxy-log userId=0 orgId=1 uname= path=/api/datasources/proxy/uid/grapi/api/datasources remote_addr=172.28.0.1 referer="http://localhost:3000/?orgId=1" t=2023-04-17T19:54:42.009400009Z level=info msg="Authentication to data source failed" body="{\n  \"error\": \"invalid API key\",\n  \"message\": \"invalid API key\",\n  \"traceID\": \"\"\n}\n" statusCode=401
grafana      | logger=data-proxy-log userId=0 orgId=1 uname= path=/api/datasources/proxy/uid/grapi/api/annotations remote_addr=172.28.0.1 referer="http://localhost:3000/?orgId=1" t=2023-04-17T19:54:42.009431698Z level=info msg="Authentication to data source failed" body="{\n  \"error\": \"invalid API key\",\n  \"message\": \"invalid API key\",\n  \"traceID\": \"\"\n}\n" statusCode=401
grafana      | logger=context userId=0 orgId=1 uname= t=2023-04-17T19:54:42.00950812Z level=info msg="Request Completed" method=GET path=/api/datasources/proxy/uid/grapi/api/annotations status=400 remote_addr=172.28.0.1 time_ms=50 duration=50.149204ms size=36 referer="http://localhost:3000/?orgId=1" handler=/api/datasources/proxy/uid/:uid/*
grafana      | logger=data-proxy-log userId=0 orgId=1 uname= path=/api/datasources/proxy/uid/grapi/api/v1/provisioning/alert-rules remote_addr=172.28.0.1 referer="http://localhost:3000/?orgId=1" t=2023-04-17T19:54:42.009677835Z level=info msg="Authentication to data source failed" body="{\n  \"error\": \"invalid API key\",\n  \"message\": \"invalid API key\",\n  \"traceID\": \"\"\n}\n" statusCode=401
grafana      | logger=context userId=0 orgId=1 uname= t=2023-04-17T19:54:42.017754658Z level=info msg="Request Completed" method=GET path=/api/datasources/proxy/uid/grapi/api/v1/provisioning/alert-rules status=400 remote_addr=172.28.0.1 time_ms=59 duration=59.470129ms size=36 referer="http://localhost:3000/?orgId=1" handler=/api/datasources/proxy/uid/:uid/*
grafana      | logger=context userId=0 orgId=1 uname= t=2023-04-17T19:54:42.018150443Z level=info msg="Request Completed" method=GET path=/api/datasources/proxy/uid/grapi/api/datasources status=400 remote_addr=172.28.0.1 time_ms=65 duration=65.449886ms size=36 referer="http://localhost:3000/?orgId=1" handler=/api/datasources/proxy/uid/:uid/*
grafana      | logger=tsdb.postgres rule_uid=ox_h9f-4k org_id=1 t=2023-04-17T19:54:50.051978291Z level=error msg="Query error" err="dial tcp: lookup host.docker.internal on 127.0.0.11:53: no such host"
grafana      | logger=ngalert.scheduler rule_uid=ox_h9f-4k org_id=1 version=2 attempt=0 now=2023-04-17T19:54:50Z t=2023-04-17T19:54:50.052156563Z level=error msg="Failed to evaluate rule" error="failed to execute query A: db query error: failed to connect to server - please inspect Grafana server log for details" duration=0s
grafana      | logger=alertmanager org=1 t=2023-04-17T19:54:50.077793264Z level=error component=alertmanager orgID=1 component=dispatcher msg="Notify for alerts failed" num_alerts=1 err="grafana-default-email/email[0]: notify retry canceled due to unrecoverable error after 1 attempts: SMTP not configured, check your grafana.ini config file's [smtp] section"
grafana      | logger=tsdb.postgres rule_uid=ox_h9f-4k org_id=1 t=2023-04-17T19:55:00.037933052Z level=error msg="Query error" err="dial tcp: lookup host.docker.internal on 127.0.0.11:53: no such host"
grafana      | logger=ngalert.scheduler rule_uid=ox_h9f-4k org_id=1 version=2 attempt=0 now=2023-04-17T19:55:00Z t=2023-04-17T19:55:00.038035212Z level=error msg="Failed to evaluate rule" error="failed to execute query A: db query error: failed to connect to server - please inspect Grafana server log for details" duration=0s
grafana      | logger=ngalert.sender.router rule_uid=ox_h9f-4k org_id=1 t=2023-04-17T19:55:00.051242785Z level=info msg="Sending alerts to local notifier" count=1
grafana      | logger=tsdb.postgres rule_uid=ox_h9f-4k org_id=1 t=2023-04-17T19:55:10.040502587Z level=error msg="Query error" err="dial tcp: lookup host.docker.internal on 127.0.0.11:53: no such host"
grafana      | logger=ngalert.scheduler rule_uid=ox_h9f-4k org_id=1 version=2 attempt=0 now=2023-04-17T19:55:10Z t=2023-04-17T19:55:10.040619985Z level=error msg="Failed to evaluate rule" error="failed to execute query A: db query error: failed to connect to server - please inspect Grafana server log for details" duration=0s
grafana      | logger=alertmanager org=1 t=2023-04-17T19:55:11.603286235Z level=error component=alertmanager orgID=1 component=dispatcher msg="Notify for alerts failed" num_alerts=1 err="grafana-default-email/email[0]: notify retry canceled due to unrecoverable error after 1 attempts: SMTP not configured, check your grafana.ini config file's [smtp] section"
grafana      | logger=tsdb.postgres rule_uid=ox_h9f-4k org_id=1 t=2023-04-17T19:55:20.044762875Z level=error msg="Query error" err="dial tcp: lookup host.docker.internal on 127.0.0.11:53: no such host"
grafana      | logger=ngalert.scheduler rule_uid=ox_h9f-4k org_id=1 version=2 attempt=0 now=2023-04-17T19:55:20Z t=2023-04-17T19:55:20.044889019Z level=error msg="Failed to evaluate rule" error="failed to execute query A: db query error: failed to connect to server - please inspect Grafana server log for details" duration=0s
grafana      | logger=tsdb.postgres rule_uid=ox_h9f-4k org_id=1 t=2023-04-17T19:55:30.064358919Z level=error msg="Query error" err="dial tcp: lookup host.docker.internal on 127.0.0.11:53: no such host"
grafana      | logger=ngalert.scheduler rule_uid=ox_h9f-4k org_id=1 version=2 attempt=0 now=2023-04-17T19:55:30Z t=2023-04-17T19:55:30.064488349Z level=error msg="Failed to evaluate rule" error="failed to execute query A: db query error: failed to connect to server - please inspect Grafana server log for details" duration=0s
grafana      | logger=tsdb.postgres rule_uid=ox_h9f-4k org_id=1 t=2023-04-17T19:55:40.036658213Z level=error msg="Query error" err="dial tcp: lookup host.docker.internal on 127.0.0.11:53: no such host"
grafana      | logger=ngalert.scheduler rule_uid=ox_h9f-4k org_id=1 version=2 attempt=0 now=2023-04-17T19:55:40Z t=2023-04-17T19:55:40.036772786Z level=error msg="Failed to evaluate rule" error="failed to execute query A: db query error: failed to connect to server - please inspect Grafana server log for details" duration=0s
grafana      | logger=ngalert.sender.router rule_uid=ox_h9f-4k org_id=1 t=2023-04-17T19:55:40.050512169Z level=info msg="Sending alerts to local notifier" count=1
grafana      | logger=tsdb.postgres rule_uid=ox_h9f-4k org_id=1 t=2023-04-17T19:55:50.038006275Z level=error msg="Query error" err="dial tcp: lookup host.docker.internal on 127.0.0.11:53: no such host"
grafana      | logger=ngalert.scheduler rule_uid=ox_h9f-4k org_id=1 version=2 attempt=0 now=2023-04-17T19:55:50Z t=2023-04-17T19:55:50.038112062Z level=error msg="Failed to evaluate rule" error="failed to execute query A: db query error: failed to connect to server - please inspect Grafana server log for details" duration=0s
The full logs are here:
https://github.com/coding-to-music/grafana-volkovlabs-grapi-datasource/blob/main/logs.txt
Any info is appreciated.
Your work is amazing btw, really great.
Also, I tend to read rather than watch, it is easier for me to follow written instructions rather than the videos (which are excellent & amazing).
Thanks
Add silence to the alert filter to be able to show all alerting states
hello, I installed grafana oss 8.5.13 version and then installed "HTTP API plugin".
After that, i created new data source like this. (request for https://dummyjson.com/products/1)
 - copy key and paste to Token field

But still not working.. Is there any steps that i missed?
Is there anything wrong for those steps?

Can grapi-datasource be used to find number of instances of multidimensional alerts, please? Standard Alert list panel shows number of rules at selected state(s), but I need to show number of alert instances.
I'm able to list alerts annotations in a table (many thanks to Daria's video!), but have no idea if/how I can recognize records are currently active instances of an alert and count them.
Thank you!
I've just installed plugin and wanted to create a data source, however no matter which method I try (local or remote request mode), I'm getting this ambiguous error.
After looking into grafana's logs I found this entry:
skip committing the transaction because it belongs to a session created in the outer scope
as well as
Applying default URL parsing for this data source type" type=volkovlabs-grapi-datasource url=
Data source URL doesn't specify protocol, so prepending it with http:// in order to make it unambiguous" type=volkovlabs-grapi-datasource url=
where url is not set in both cases
Hi,
I want to provision volkovlabs-grapi-datasource plugin in grafana using the yaml file in grafana/provisioning/plugins
can you say me what I have to write in the yaml ?
I tried :
apiVersion: 1

apps:
  - type: volkovlabs-grapi-datasource
    disabled: false
but doesn't work and grafana don't start
and I don't want to use grafana-cli to install the plugin
thanks for your help
Feature Request: Add a label row with values from specified labels, allowing users to see the alerting values in a separate column.
Example: Given label values A=1, B=2, C=1, it would be beneficial to have a label row that displays these values as separate columns for better visibility and understanding of the alerting context.
A declarative, efficient, and flexible JavaScript library for building user interfaces.
🖖 Vue.js is a progressive, incrementally-adoptable JavaScript framework for building UI on the web.
TypeScript is a superset of JavaScript that compiles to clean JavaScript output.
An Open Source Machine Learning Framework for Everyone
The Web framework for perfectionists with deadlines.
A PHP framework for web artisans
Bring data to life with SVG, Canvas and HTML. 📊📈🎉
JavaScript (JS) is a lightweight interpreted programming language with first-class functions.
Some thing interesting about web. New door for the world.
A server is a program made to process requests and deliver data to clients.
Machine learning is a way of modeling and interpreting data that allows a piece of software to respond intelligently.
Some thing interesting about visualization, use data art
Some thing interesting about game, make everyone happy.
We are working to build community through open source technology. NB: members must have two-factor auth.
Open source projects and samples from Microsoft.
Google ❤️ Open Source for everyone.
Alibaba Open Source for everyone
Data-Driven Documents codes.
China tencent open source team.
