Python project to determine stocks that exhibit similar price action.
Data: Data is collected from SIMFIN API (free version) using Asynchronous request for concurrency and
faster HTML response. The data is OHLCV data for the stocks in the PostgreSQL populated earlier. The data
is stored as a csv and later populated into a SQL table. The database contains other tables like stock symbol,
ETF composition etc.
The data is ingested into pandas dataframe using Dynamic SQL (psycopg2) and unsupervised clustering algorithm
is implemented.
To create the postgres instance on docker
docker pull postgres
To start a postgres instance
docker run --name some-postgres -e POSTGRES_PASSWORD=mysecretpassword -d postgres
The postgres instance name and password will be used to connect to the database using psycopg2
Create account with SIMFIN and Alphavantage for the api key.
https://simfin.com/data/api
https://www.alphavantage.co/
Enter the postgres database credentials and the API key in the config.py template file in the repository
Create a database and required tables by running the script etfdb.sql or by copy pasting the scripts in the terminal.
Run the script populate-stocks.py and populate-timeseries.py to pull all stocks and price data for alst ten years using API. This will take a few hours to complete depending on whether account associated with API is free or premium
The script for training the unsupervised clustering model is in train.py. The script app.py is the front end design and can be run by following command. The webpage can be visited on local
streamlit run app.py
The console will display the address where the web app is being hosted. It will be localhost followed by a port (eg: http://localhost:8502/)
This is the homepage
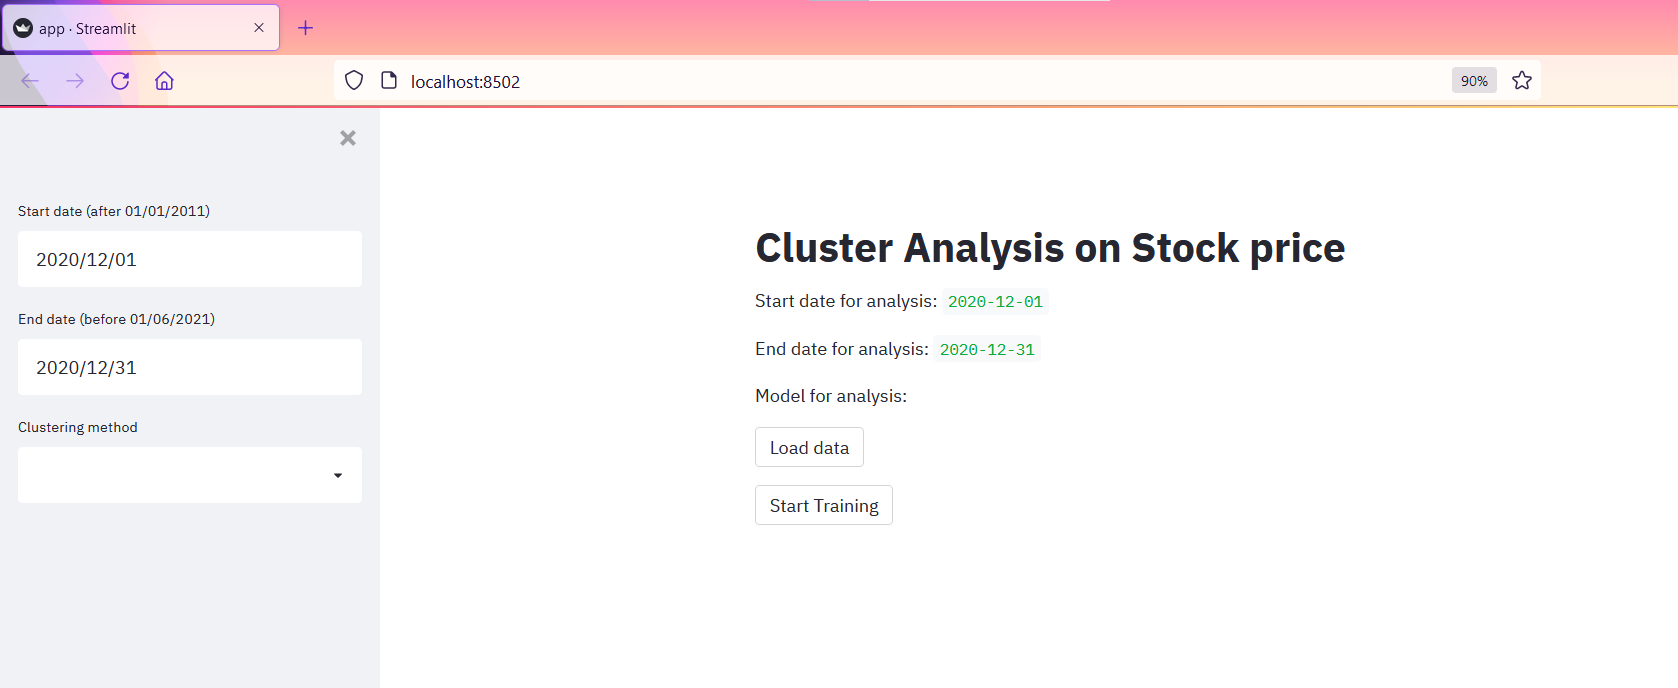
Here we can select the dates between which to carry out the cluster analysis and choose the model
Once the data is pulled from database, it will show the first 5 rows.

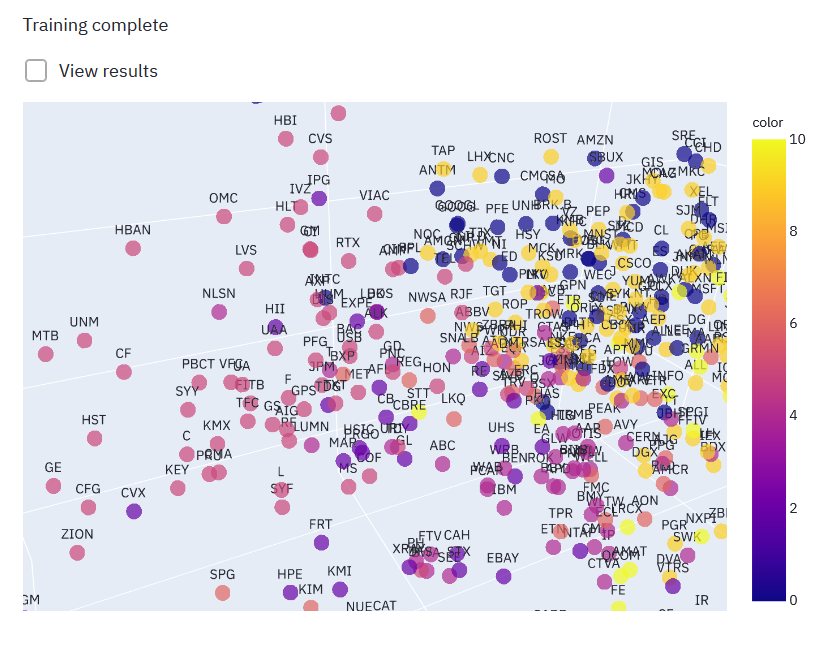
Click on start training to run the model. Once completed, we can view the clusters in an interactive 3d plot.