Meteorological data visualisation scripts
language: Python, bash
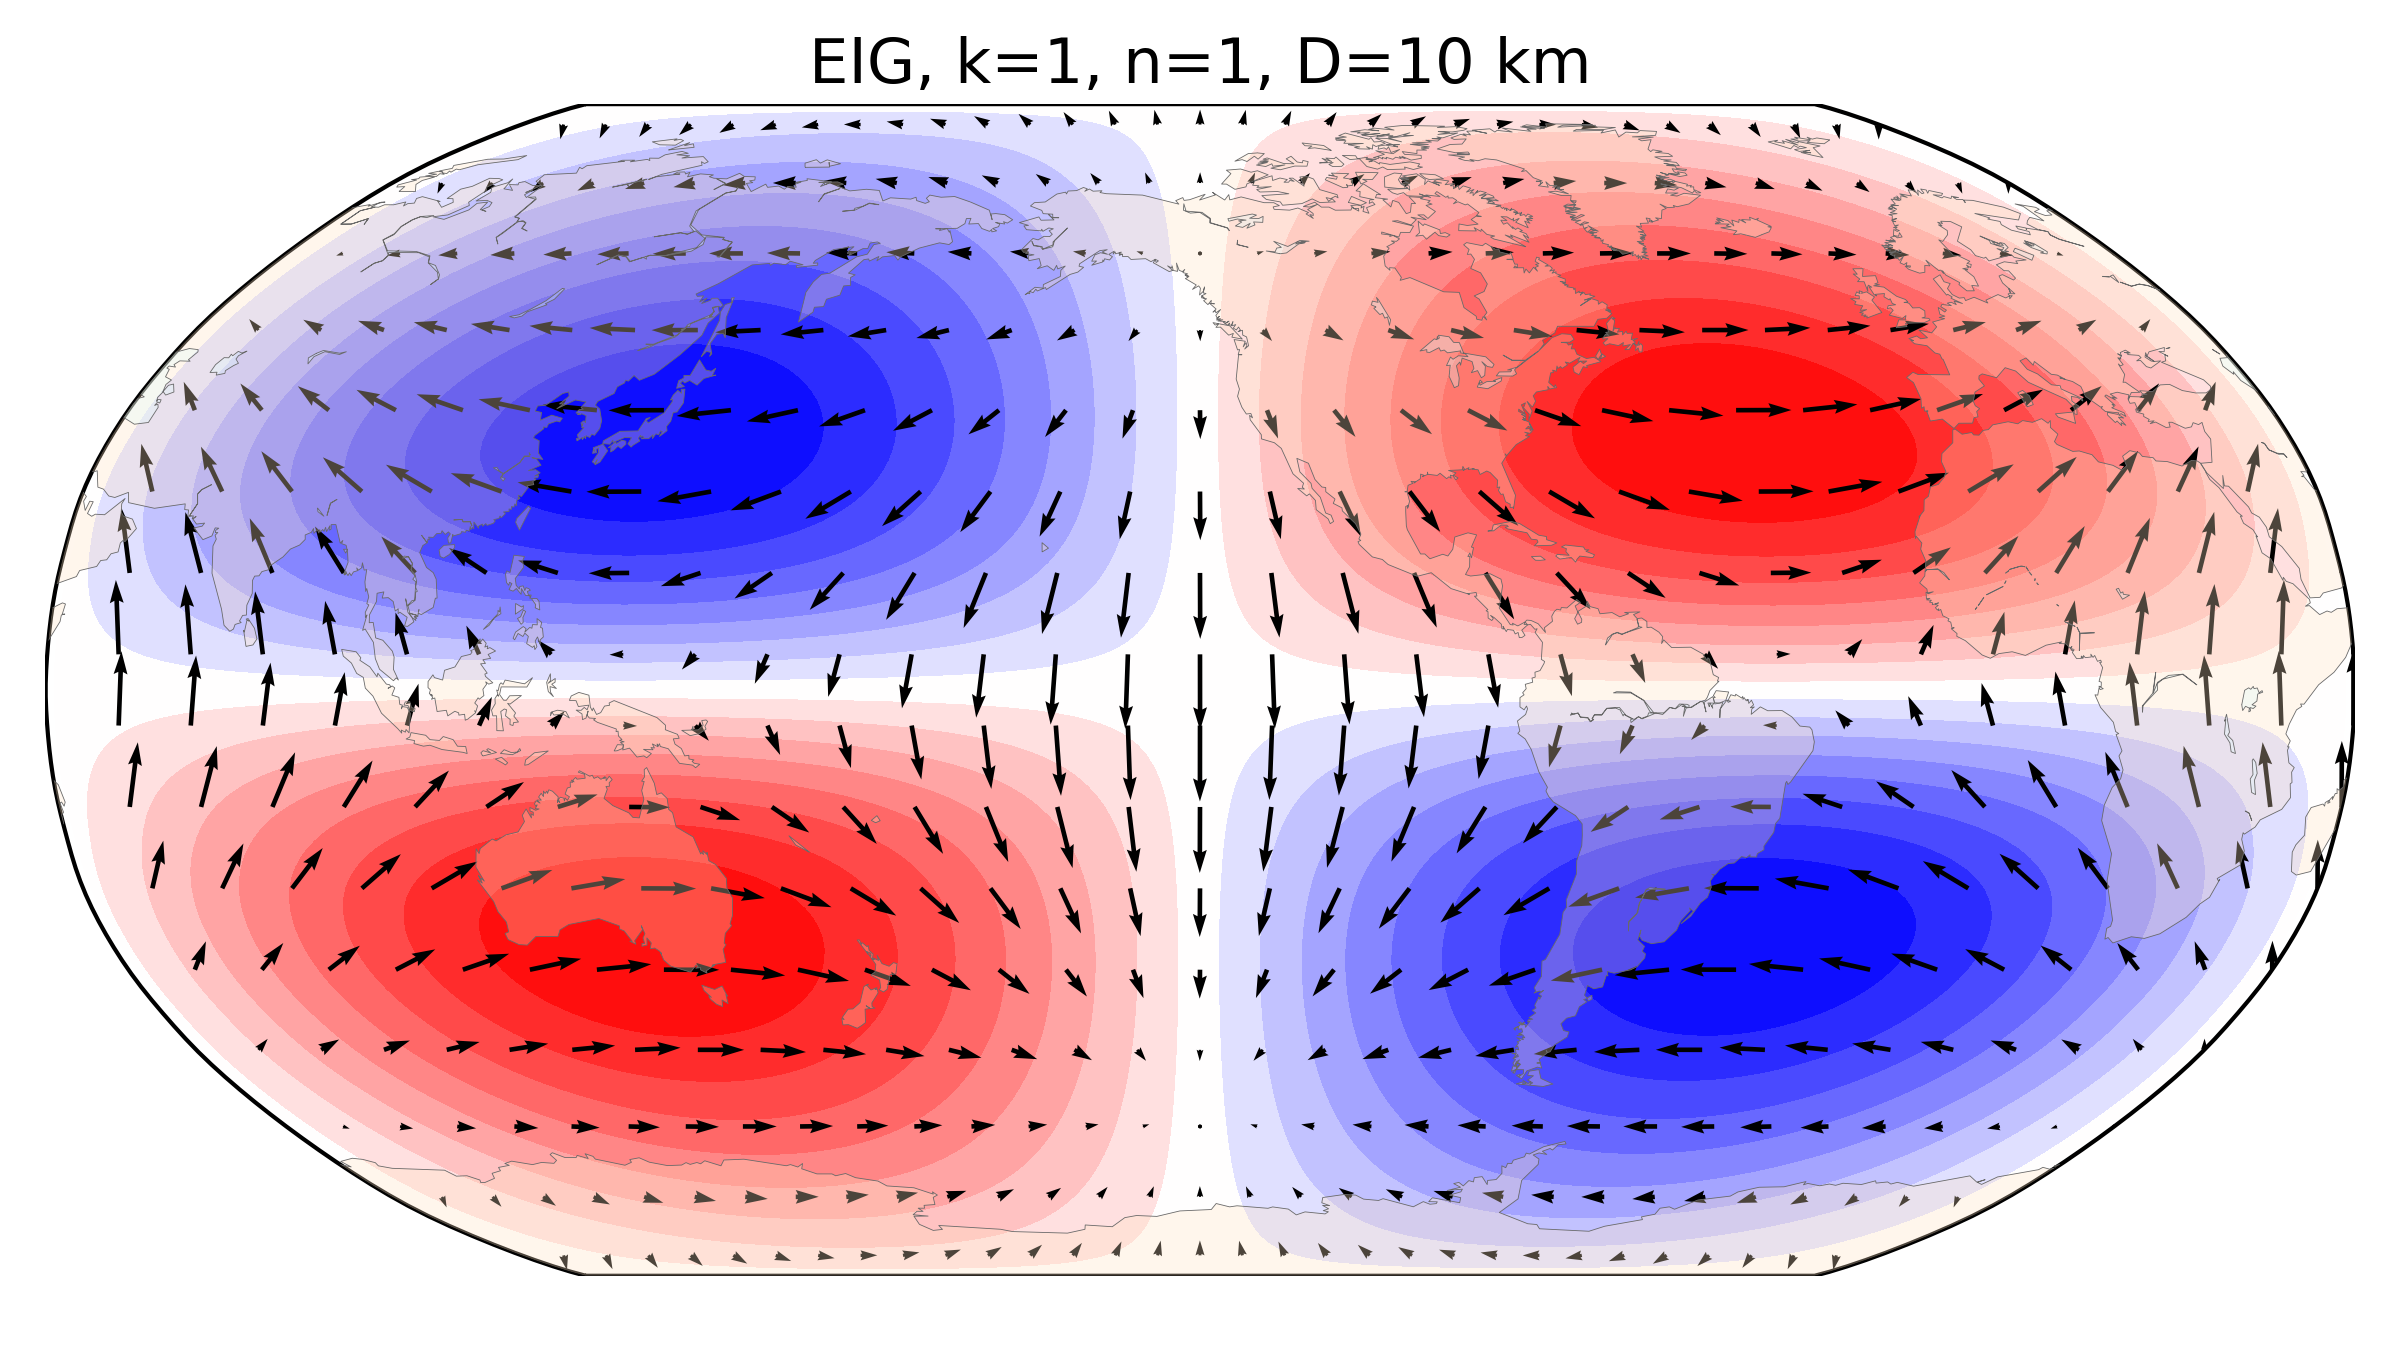
| Description: | plotting wind fields of Hough harmonics for MODES website (outcome figures: https://modes.cen.uni-hamburg.de/hough) |
| Input: | reanalysis wind data (u,v) and geopotential height data (Z) for different waves, decomposed by normal-mode function software MODES (https://modes.cen.uni-hamburg.de/) |
| Output: | wind vectors and geopotential height contour on a global map (longitude range shifted automatically according to the wave center in each data file) |
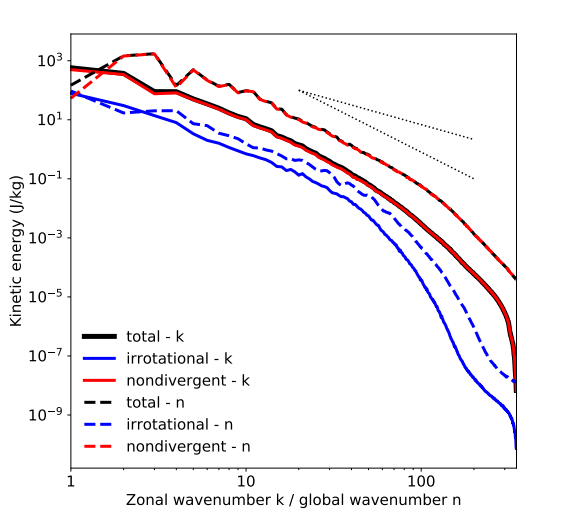
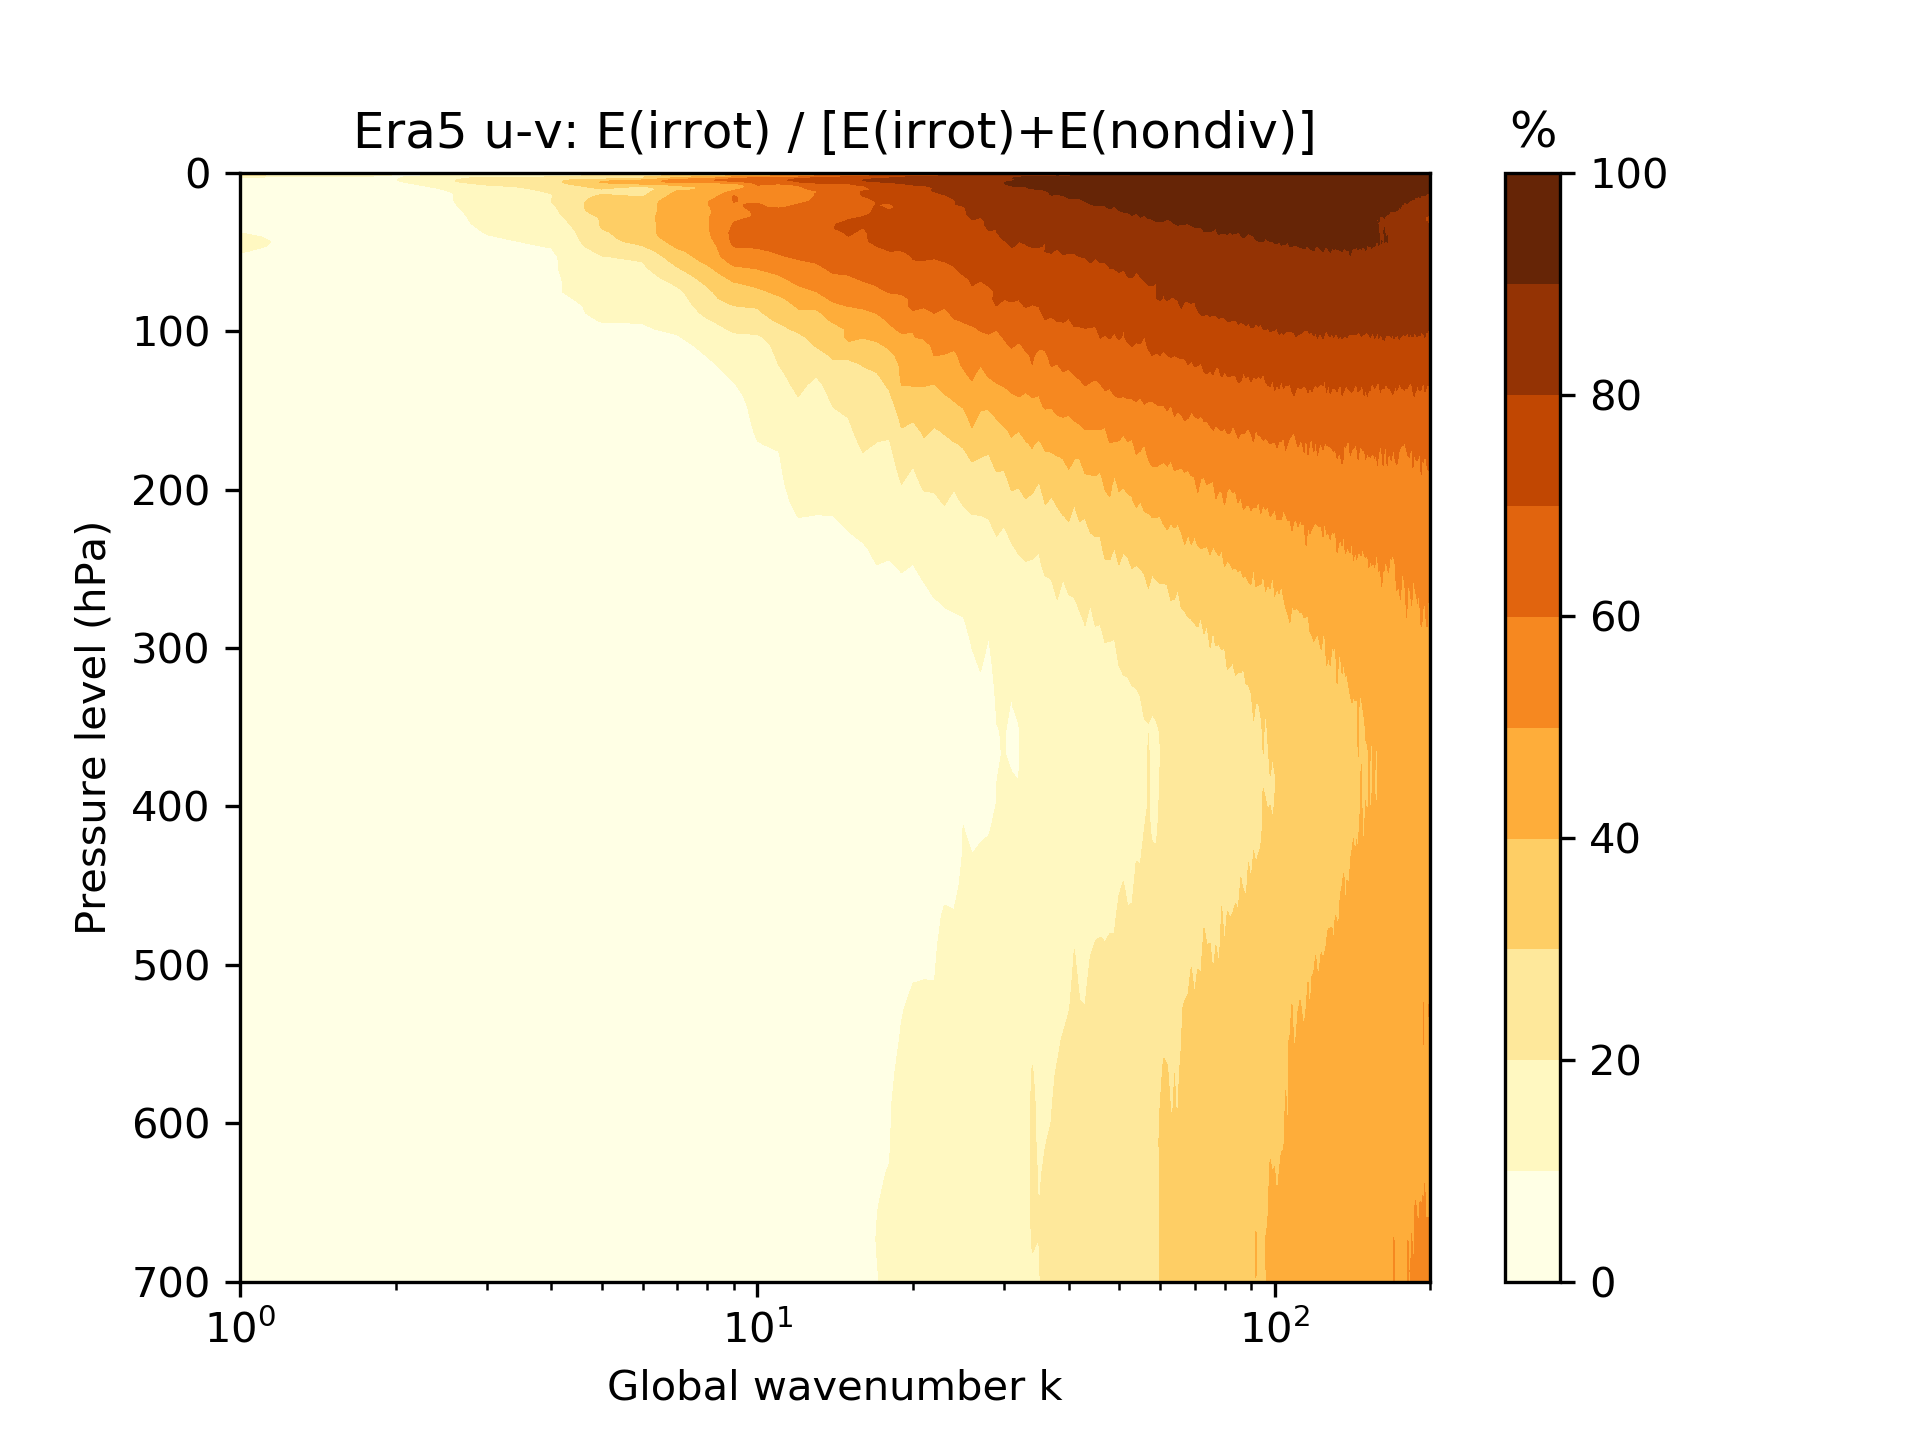
| Description: | calculate the mean energy spectra from single spectra over a week, and plot them (1-D);
calculate the irrot./total ratio and plot it |
| Input: | binary data of En_k(n,l), En_n(k,l) |
| Output: | 1-D mean energy spectra figures (x: log(k), log(n), y: log(En), irrot./total ratio |
| Description: | calculate the mean spectra from single spectra over a week, and plot them (2-D) |
| Input: | binary data of En(k,n,l) |
| Output: | 2-D mean energy spectra figures |
| Description: | Running a python script for 6-hourly data files |
| Description: | plot contourf of Rossby wave; convert a series of Rossby wave images into a .gif |
| Input: | decomposed Rossby wave data (6-hourly) |
| Output: | see "Gallery-Rossby.gif" |
examples of outcome figures