Giter VIP home page Giter VIP logo

wraysmith / boardgame-explorer Goto Github PK

View Code? Open in Web Editor NEW
1.0 3.0 1.0 89.16 MB

The Board Game Data Explorer allows a user to view board game trends and top games based on user ratings as well as explore games in a 3D graph.

Home Page: https://boardgame-explorer.herokuapp.com/

License: MIT License

HTML 45.44% Jupyter Notebook 51.30% Python 3.27%
board-games dashboard python plotly-dash 3d-graphics scatterplot t-sne

boardgame-explorer's Introduction

Board Game Data Explorer

GitHub GitHub Super-Linter

๐ŸŽฒ The Board Game Data Explorer can be found here! ๐ŸŽฒ

This document (the README file) provides information about the data explorer. Jump straight to one of the sections below, or just scroll down to find out more.

Description

The Board Game Data Explorer provides interactive exploration of board games from the BoardGameGeek website.

The app allows exploration based on game name, categories, mechanics, publishers and provides user rating information.

Features include:

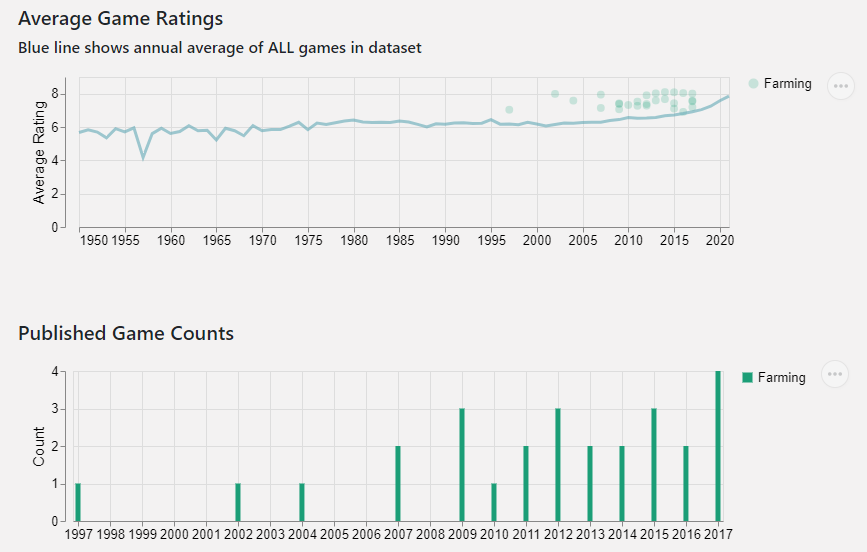
  • Trends in board game features vs game published year.
  • Top 10 games based user ratings and filtering on categories, mechanics, and/or publishers.
  • ๐Ÿ’ฅ A 3D game explorer. ๐Ÿ’ฅ

The best way to understand the functionality is just to check-out the app but a few examples are shown below.

Average User Ratings

Average Game Ratings

Published Game Counts

Published Game Counts

3D Game Explorer

3D Game Explorer

3D Game Explorer

The 3D Game Explorer is a representation of game similarity based on game categories, mechanics, and user ratings. It allows a user to select a game and then explore similar games in close proximity.

A brief demo is shown above and a more detailed demo can be found here.

The 3D Game Explorer uses dimensionality reduction (t-SNE) which results in plotting similar games close to each other and less similar games farther away. The horizontal axes represent similarity in game categories and mechanics and the vertical axis represents similarity in user ratings (count of ratings and average ratings).

Data

The Board Game Data Explorer queries the BoardGameGeek API and is processed into the format used by the app using a GitHub Actions workflow. It is currently triggered manually but the plan is to automate it on a bi-weekly basis.

There is some filtering done on the dataset before it goes into the explorer including:

  • Games with less than 100 user ratings are removed
  • Games published before 1950 or with no published year are removed

Status

v1.0.0 of the Board Game Data Explorer is now complete! The app was completed as part of the Master of Data Science program at the University of British Columbia (UBC) but will continue to be maintained.

There are still are few updates planned for the app that can be found here and include:

  • Improve layout to scale better on different browsers
  • Adding a few more data filters for the graphs

Getting Help or Reporting an Issue

To report bugs/issues/feature requests, please file an issue.

These are very welcome!

How to Contribute

If you would like to contribute, please see our CONTRIBUTING guidelines.

Please note that this project is released with a Contributor Code of Conduct. By participating in this project you agree to abide by its terms.

boardgame-explorer's People

Contributors

github-classroom[bot] avatar mqharris avatar rykoe avatar sophiabulcock avatar wraysmith avatar

Stargazers

 avatar

Watchers

 avatar  avatar  avatar

Forkers

mariliasilva22

boardgame-explorer's Issues

Dash Layout Updates for Milestone 4

Based on review of #32, the following won't be implemented in Milestone 2 but should be for Milestone 4:

  • speed of Figures 1 and 2 loading is slow
  • potential change of Figure 2 to an overlaid fill chart (may be dealt with directly in PR #32)
  • general layout (spacing/aesthetics) needs some work
  • needs thought into user instructions

Dashboard Updates to be completed for Milestone 2

Dashboard items to be fixed-up Monday for Milestone 2:

  • fix error that occurs in tab 1 top 2 figures when switching radio buttons
  • update bar charts so time slider goes above charts and so the output for each series of charts is a single faceted image
  • make the default on tab 2 have something that shows a graph
  • switch the order of the board game names in the tab 2 bar chart
  • remove game family from the table and cut down the words in the game table headers
  • update the Graph title to be capitalized on tab 2
  • update dashboard so that it loads the dataset from csv only once
  • add tooltips/interactivity to Altair plots (where it makes sense) - if slows down performance can go into #34
  • if there are no data in the elements selected the legend in the tab 1 top two figures, the legend default to a 'varying range' with nan - this should be fixed
  • put a subnote/subtitle below the title on the top figure on tab 1 that says "Annual average rating for all board games shown by grey line"
  • spelling mistakes in code as noted in PR #39

Group Discussion Suggestions

  • Better description of what it does
  • Link to source website / brief explanation of what mechanic/categories is
  • Making tabs more obvious
  • Change up bar chart type - make obvious that user can select year ranges
  • Highlight user selection areas to be easily found

General Errors found in v1.0.0

  • year range slider for density plot current stops at 2016 (and logic for all selected on density plot could likely be revised)

image

  • published game counts dynamically changes its x-axis while the average game rating plot does not resulting in a mismatch in the axis

image

Dashboard Potential Enhancements

Additional dashboard enhancements that may be included depending on timelines and for discussion with @firasm and @Davddng

  • Putting the board game spreadsheet into a database format and calling directly from the database - potentially worth trying to start implementing early on to avoid rewriting code
  • Automated updating of the board game database using the scraper available to do so (likely implemented at the very end of the project)
  • Doing an unsupervised learning analysis and showing the results in a network graph of similar games (separate tab on the dashboard), potentially showing on a 3D plot using the first 3 principle components or something similar if it works - another at the end item
  • Having all or some components of the dashboard AWS based. Initial thoughts include: calculations run using AWS lambda (on demand calcs and would potentially be only applicable to the unsupervised learning analysis), storing the database in dynamoDB or AWS RDS, or implementing full deployment through beanstalk - another in the last week thing going from Heroku to direct AWS hosting

Look into Dash Cytoscape for network graphs

In Issue #8, it was mentioned you wanted to create some Network Graphs. Those weren't really discussed in detail in 550 except to mention that they existed, mostly because they have limited utility.

For your application though, I can see a good use-case for Network Graphs. Network graphs don't exist by default in Altair, but there is another library, nx_altair that builds network graphs with altair but that's only if you're feeling brave.

A better way to do this would probably be to use the poorly library. Have a look at this article that shows how to make network graphs in plotly and control it with Dash.

Here's an example:

1*t3wDztpY8lTFrMBtko-4Cw

General App Updates

These were not completed as part of v1.0.0 of the app but are items that may be completed in the future:

  • Consider modification to tab 1 figure 1 to potentially add a toggle for turning on/off points and have all selections shows a mean line (potentially with quantiles shaded) - on the fly mean lines/quantiles in Altair would either need to be preprocessed or use the experimental Altair transformer (originally noted in Issues #34).
  • Adding a year range filter to all graphs in app.
  • Adding a user rating count filter to the 3D graph.
  • Improve some of the app layouts to scale better on different browsers.
  • Alphabetize lists
  • Provide option to filter categories instead of multiple select on 3D explorer.

Update Dataset using Scraper

Update the Board Game Geek dataset from the previous board game EDA using the board game scraper.

Get to a point where a script can be run to update the dataset wrangled into the format required by the the dashboard.

One of the items in #8

app Code Updates to Consider for Milestone 4

Based on a review of #32 these are a couple items to consider during Milestone 4 for the currently named dash_layout.py file:

  • figuring out card/container layout code
  • looking at potentially better methods of adding whitespace (vs multiple html.Br())
  • update bar chart functions which are currently copied code
  • split app file into multiple files (likely grouped by tab) to reduce size

Improve Data Query and Processing Workflow

The GitHub Actions worklow to run get data from the BoardGameGeek API and process it for the app is triggered manually. The plan is to update to automatically trigger every 2-weeks. As part of this, a failed API call needs to have progressive back-off instead of failing the process as it does currently.

Deploying Dash apps on AWS

Related to #8 again, the Lecture instructions only include deployment of the dashboard on Heroku, but it's pretty similar (moderately more complicated) to deploy things on AWS.

Here is a guide that seems promising.

That being said, you should make sure it's deployed on Heroku first because it's a lot simpler and you want to make sure you have a minimally viable product deployed on Heroku.

Create Python Dash dashboard

Create basic functionality for Python Dash dashboard. Focus is on making everything in the proposal work, any major formatting can be done during Milestone 4 (unless time permits).

Milestone 1 Tasks

  • add license (MIT)
  • proposal (motivation and purpose, description, research questions)
  • description of app & sketch (use noun project)
  • team work contract and collab doc
  • code of conduct
  • contributing guidelines
  • make release

Recommend Projects

  • React photo React

    A declarative, efficient, and flexible JavaScript library for building user interfaces.

  • Vue.js photo Vue.js

    ๐Ÿ–– Vue.js is a progressive, incrementally-adoptable JavaScript framework for building UI on the web.

  • Typescript photo Typescript

    TypeScript is a superset of JavaScript that compiles to clean JavaScript output.

  • TensorFlow photo TensorFlow

    An Open Source Machine Learning Framework for Everyone

  • Django photo Django

    The Web framework for perfectionists with deadlines.

  • D3 photo D3

    Bring data to life with SVG, Canvas and HTML. ๐Ÿ“Š๐Ÿ“ˆ๐ŸŽ‰

Recommend Topics

  • javascript

    JavaScript (JS) is a lightweight interpreted programming language with first-class functions.

  • web

    Some thing interesting about web. New door for the world.

  • server

    A server is a program made to process requests and deliver data to clients.

  • Machine learning

    Machine learning is a way of modeling and interpreting data that allows a piece of software to respond intelligently.

  • Game

    Some thing interesting about game, make everyone happy.

Recommend Org

  • Facebook photo Facebook

    We are working to build community through open source technology. NB: members must have two-factor auth.

  • Microsoft photo Microsoft

    Open source projects and samples from Microsoft.

  • Google photo Google

    Google โค๏ธ Open Source for everyone.

  • D3 photo D3

    Data-Driven Documents codes.