Giter VIP home page Giter VIP logo

wuba / react-native-echarts Goto Github PK

View Code? Open in Web Editor NEW
650.0 19.0 22.0 227.83 MB

📈 React Native ECharts Library: An awesome charting library for React Native, built upon Apache ECharts and leveraging react-native-svg and react-native-skia. Offers significantly better performance compared to WebView-based solutions.

Home Page: https://wuba.github.io/react-native-echarts/

License: Apache License 2.0

JavaScript 6.59% TypeScript 93.41%
react-native echarts android app chart ios react charts svg skia

react-native-echarts's Introduction

npm version npm downloads codecov issues GitHub contributors PRs Welcome license

简体中文 | English

React Native version of Apache Echarts, based on react-native-svg and react-native-skia. This awesome library offers significantly improved performance compared to WebView-based solutions.

Checkout the full documentation here.

About

  • 🔥 The same usage as Apache ECharts
  • 🎨 Rich charts, covering almost all usage scenarios
  • ✨ Optional rendering library: Skia or SVG
  • 🚀 Reusable code with web
  • 📱 Support gestures such as tapping, dragging and zooming

Installation

yarn add @wuba/react-native-echarts echarts

Install react-native-svg or react-native-skia according to your needs.

The latest versions of echarts, react-native-svg, and react-native-skia are recommended

Usage

example

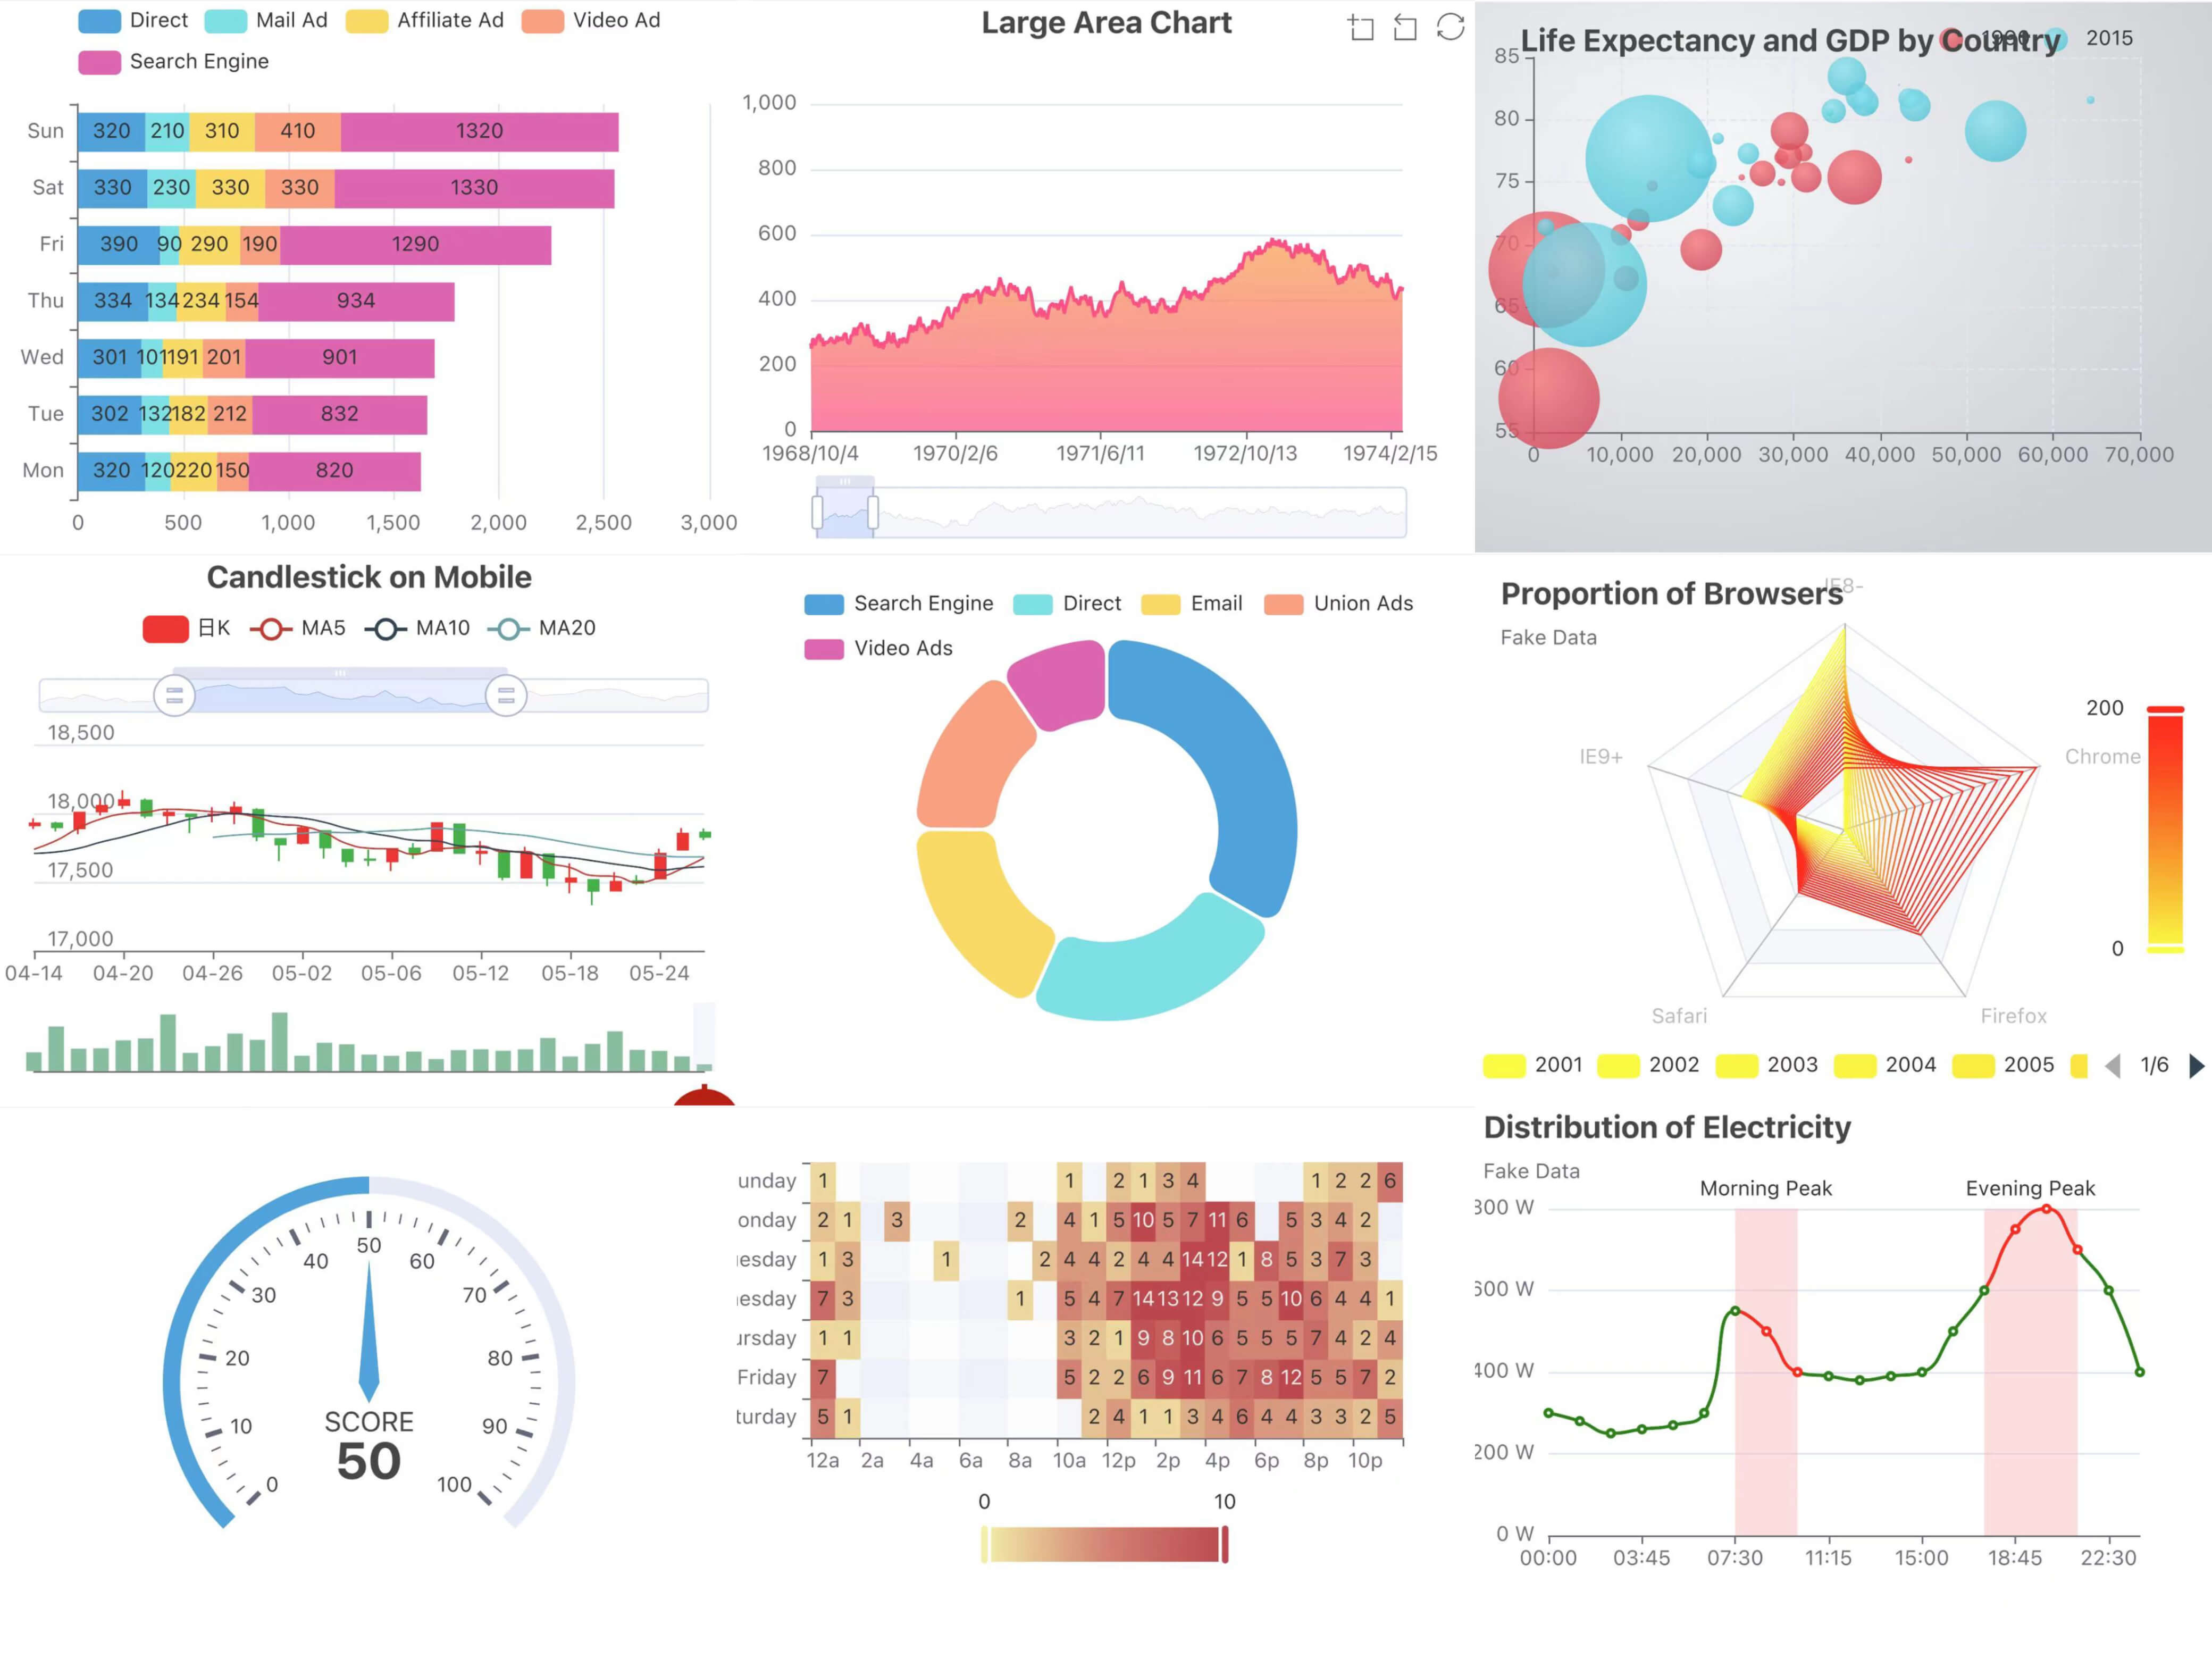
Most of the charts in ECharts are supported, and the usage remains largely consistent. For more use cases and demo previews, you can download the Taro Playground app.

Example

// Choose your preferred renderer
// import { SkiaChart, SVGRenderer } from '@wuba/react-native-echarts';
import { SvgChart, SVGRenderer } from '@wuba/react-native-echarts';
import * as echarts from 'echarts/core';
import { useRef, useEffect } from 'react';
import {
  BarChart,
} from 'echarts/charts';
import {
  TitleComponent,
  TooltipComponent,
  GridComponent,
} from 'echarts/components';

// Register extensions
echarts.use([
  TitleComponent,
  TooltipComponent,
  GridComponent,
  SVGRenderer,
  // ...
  BarChart,
])

const E_HEIGHT = 250;
const E_WIDTH = 300;

// Initialize
function ChartComponent({ option }) {
  const chartRef = useRef<any>(null);

  useEffect(() => {
    let chart: any;
    if (chartRef.current) {
      // @ts-ignore
      chart = echarts.init(chartRef.current, 'light', {
        renderer: 'svg',
        width: E_WIDTH,
        height: E_HEIGHT,
      });
      chart.setOption(option);
    }
    return () => chart?.dispose();
  }, [option]);

  // Choose your preferred chart component
  // return <SkiaChart ref={chartRef} />;
  return <SvgChart ref={chartRef} />;
}

// Component usage
export default function App() {
  const option = {
    xAxis: {
      type: 'category',
      data: ['Mon', 'Tue', 'Wed', 'Thu', 'Fri', 'Sat', 'Sun'],
    },
    yAxis: {
      type: 'value',
    },
    series: [
      {
        data: [120, 200, 150, 80, 70, 110, 130],
        type: 'bar',
      },
    ],
  }
  return <ChartComponent option={option} />
}

Use only one of SvgChart or SkiaChart

import SvgChart, { SVGRenderer } from '@wuba/react-native-echarts/svgChart';

or

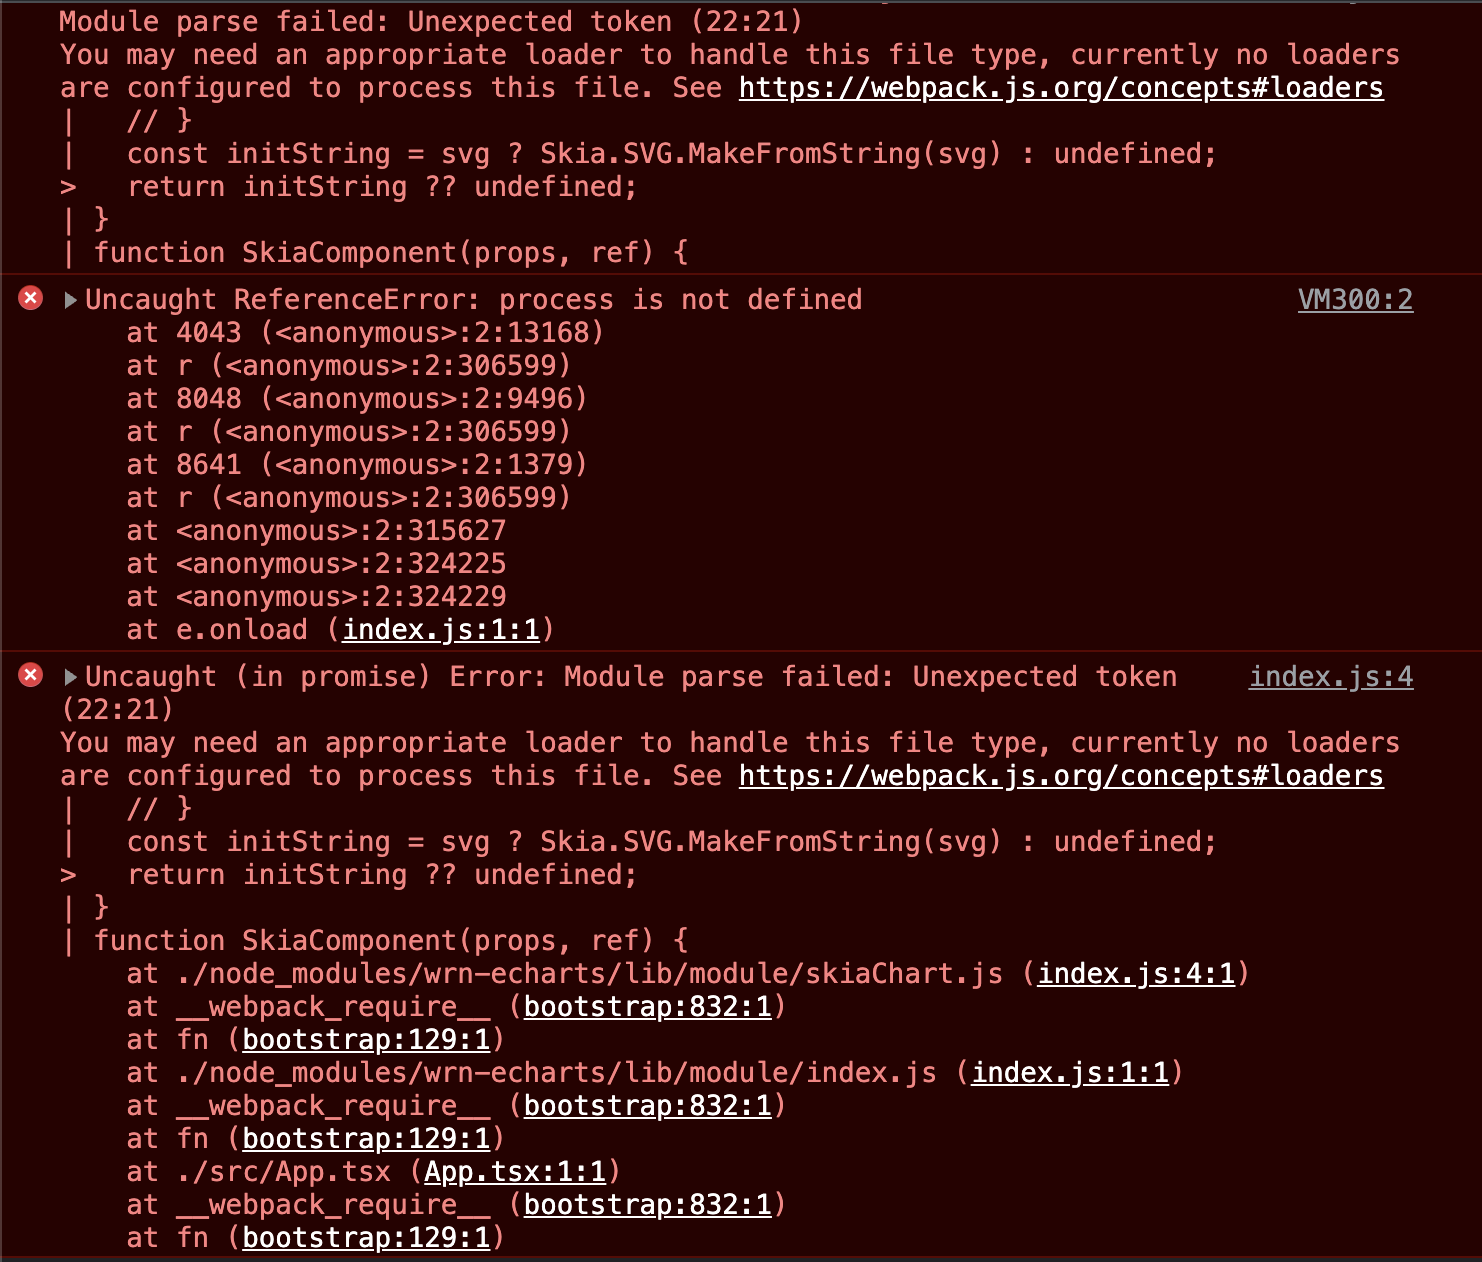
import SkiaChart, { SVGRenderer } from '@wuba/react-native-echarts/skiaChart';

Contributing

See the contributing guide to learn how to contribute to the repository and the development workflow.

Contributors

This project exists thanks to all the people who contribute:

License

Apache-2.0


Made with create-react-native-library

react-native-echarts's People

Contributors

dependabot[bot] avatar iambool avatar mateoguzmana avatar mrsquaare avatar rohrerf avatar shinken008 avatar xiaopanshi avatar yechunxi avatar yinyanli avatar zhiqingchen avatar

Stargazers

 avatar  avatar  avatar  avatar  avatar  avatar  avatar  avatar  avatar  avatar  avatar  avatar  avatar  avatar  avatar  avatar  avatar  avatar  avatar  avatar  avatar  avatar  avatar  avatar  avatar  avatar  avatar  avatar  avatar  avatar  avatar  avatar  avatar  avatar  avatar  avatar  avatar  avatar  avatar  avatar  avatar  avatar  avatar  avatar  avatar  avatar  avatar  avatar  avatar  avatar  avatar  avatar  avatar  avatar  avatar  avatar  avatar  avatar  avatar  avatar  avatar  avatar  avatar  avatar  avatar  avatar  avatar  avatar  avatar  avatar  avatar  avatar  avatar  avatar  avatar  avatar  avatar  avatar  avatar  avatar  avatar  avatar  avatar  avatar  avatar  avatar  avatar  avatar  avatar  avatar  avatar  avatar  avatar  avatar  avatar  avatar  avatar  avatar  avatar  avatar

Watchers

 avatar  avatar  avatar  avatar  avatar  avatar  avatar  avatar  avatar  avatar  avatar  avatar  avatar  avatar  avatar  avatar  avatar  avatar  avatar

react-native-echarts's Issues

点击图表没有反应

我使用的是1.1.1版本, 在安卓端环境.
生成图表后, 点击图表和图例都没有任何反应. 没有弹出数据标签, 也不会根据图例隐藏数据, 图例也不会变色.

SvgChart doesn't renders scrollable legend properly in Android

We are using SvgChart renderer from the package imported like this:

import SvgChart, { SVGRenderer } from '@wuba/react-native-echarts/svgChart';

When we render a chart with a legend without adding the "type" to "scroll", it displays the legend fine. But if we add the scrolling attribute in the legend configuration of the chart, it doesn't displays the legend properly and just shows it half. And when we press on the right arrow to scroll, the legend becomes completely invisible. This issue is only seen in Android and it works perfectly fine in iOS with everything same. Also, one thing to note that SkiaChart renderer doesn't have this issue at all either in Android or iOS but cannot use that because of it's huge size and drastically increased build time.

Screenshot 2023-07-11 at 10 16 00 am

📢📢📢 Known Issues

@wuba/react-native-echarts

issue example related link suggestion platform
Stalling when displaying a large number of data charts heatmap-large
Shadows are not supported heatmap-cartesian
Map is not supported lines-bmap-effect

SkiaChart

issue example related link suggestion platform
Unable to show image pictorialBar-spirit issue use SvgChart
tooltip.formatter with custom html is not supported pie-roseType

SvgChart

issue example related link suggestion platform
Gradients are sometimes rendered white heatmap-cartesian use SkiaChart Android
Gradient sometimes flickers line-draggable use SkiaChart Android
tooltip.formatter with <br/> is not supported pie-roseType

fixed

SkiaChart

issue example related link suggestion platform
Chinese (or other languages) cannot be displayed - - use latest version of skia, set font family for ios globally

Extract the chart colours ?

Does the library allow us to extract the colours used by the chart for each category (category:name in the data) ?

Package not able to handle different format of dataset provided in a line chart

Describe the bug
The line chart is not able to handle a different format of dataset.

Following are two sets of echarts configuration which work as expected when run in echarts code example executor:

demoConfig1 = {
tooltip: {
trigger: 'axis'
},
xAxis: {
type: 'category',
boundaryGap: false,
data: ['Mon', 'Tue', 'Wed']
},
yAxis: {
type: 'value'
},
series: [
{
name: 'Email',
type: 'line',
stack: 'Total',
data: [120, 132, 101]
},
{
name: 'Union Ads',
type: 'line',
stack: 'Total',
data: [220, 182, 191]
}
]
};

demoConfig2 = {
tooltip: {
trigger: 'axis'
},
xAxis: {
type: 'category',
boundaryGap: false
},
yAxis: {
type: 'value'
},
series: [
{
name: 'Email',
type: 'line',
stack: 'Total',
},
{
name: 'Union Ads',
type: 'line',
stack: 'Total',
}
],
"dataset": {
"source": [
["Monday",
120,
220,
],
[
"Tuesday",
132,
182,
],
[
"Wednesday",
101,
191,
]
],
}
};

As you can see both the configs are actually the same thing and produce the same chart, the only difference is the format in which the dataset is provided. In demoConfig2, the dataset is provided separately in a "dataset" object. Both the configs (demoConfig1 and demoConfig2) work as expected when run on ehcarts renderer on their website (https://echarts.apache.org/examples/en/editor.html?c=line-stack) meaning both are correct, and the demoConfig1 when passed to the package works well in the app but when demoConfig2 is passed to the package, it doesn't displays the graph data. The code being used to render the graphs in the app is the same as specified in the readme section of the library's github repository.

Output of demoConfig1:
Screenshot 2023-07-05 at 11 25 37 am

Output of demoConfig2:
Screenshot 2023-07-05 at 11 25 04 am

We are actually working with a large dataset and it is more feasible for us to work the format as specified in demoConfig2.

Please let me know if this issue is faced by others as well. Thanks!

Error: Unable to resolve module @shopify/react-native-skia

hi there,

First of all, it seems that I should import SvgChart, { SVGRenderer } from 'wrn-echarts', not 'wrn-echarts/svgChart'?

I imports Svg Chart only, but when building app, there is an error: Unable to resolve module @shopify/react-native-skia. I don't want to import the skia pkg

needs help
thank you for the library

Unexpected token 'export': ´export * from './lib/module/svgChart'´ when using Next.js & Expo in monorepo

Hi,
first of all, thank you for this lib!

I am using the expo & next.js starter from tamagui (source here).
And I ran into the following issue when using the SvgChart while running on "web" (Expo / React Native does work):

export * from './lib/module/svgChart';
^^^^^^

SyntaxError: Unexpected token 'export'
    at internalCompileFunction (node:internal/vm:73:18)
    at wrapSafe (node:internal/modules/cjs/loader:1178:20)
    at Module._compile (node:internal/modules/cjs/loader:1220:27)
    at Module._extensions..js (node:internal/modules/cjs/loader:1310:10)

I am importing like this (so there is no problem with Skia):

import SvgChart, { SVGRenderer } from '@wuba/react-native-echarts/svgChart'

Also, I have tried to add the Webpack extensions to next.conf.js like explained here, but that did not work,

I also tried adding @wuba/react-native-echarts/svgChart to the transpilePackages Array, but that did not work either.

What am I doing wrong?

Thank you

xAxis "0" not found error

Your example i copied, and getting this error
xAxis "0" not found

import * as React from 'react';
import {useEffect, useRef} from 'react';

import {StyleSheet, View, Dimensions} from 'react-native';
import {SVGRenderer, SkiaChart} from 'wrn-echarts';
import * as echarts from 'echarts/core';
import {BarChart} from 'echarts/charts';
import {TitleComponent, TooltipComponent} from 'echarts/components';

// register extensions
echarts.use([
  TitleComponent,
  TooltipComponent,
  SVGRenderer,
  // ...
  BarChart,
]);

const E_HEIGHT = 250;
const E_WIDTH = Dimensions.get('screen').width;

function SkiaComponent({option}: any) {
  const skiaRef = useRef<any>(null);

  useEffect(() => {
    let chart: any;
    if (skiaRef.current) {
      // @ts-ignore
      chart = echarts.init(skiaRef.current, 'light', {
        renderer: 'svg',
        width: E_WIDTH,
        height: E_HEIGHT,
      });
      chart.setOption(option);
    }
    return () => chart?.dispose();
  }, [option]);

  return <SkiaChart ref={skiaRef} />;
}

const option = {
  xAxis: {
    type: 'category',
    data: ['Mon', 'Tue', 'Wed', 'Thu', 'Fri', 'Sat', 'Sun'],
  },
  yAxis: {
    type: 'value',
  },
  series: [
    {
      data: [120, 200, 150, 80, 70, 110, 130],
      type: 'bar',
    },
  ],
};
export default function GrowthDetails() {
  return (
    <View style={styles.container}>
      <SkiaComponent option={option}></SkiaComponent>
    </View>
  );
}

const styles = StyleSheet.create({
  container: {
    flex: 1,
    alignItems: 'center',
    justifyContent: 'center',
  },
  box: {
    width: 60,
    height: 60,
    marginVertical: 20,
  },
});

Error Screen Shot

Simulator Screen Shot - iPhone 13 Pro - 2023-01-11 at 13 24 51

Android设备饼图中文乱码

option

{
      color: chartColors,
      grid: {
        left: "5%",
        right: "5%",
        top: "10%",
        bottom: 100,
        height: "80%",
        containLabel: true,
      },
      legend: {
        itemHeight: 16,
        itemWidth: 16,
        data: legend,
        itemGap: 16,
        right: 20,
        orient: "horizontal",
        y: "bottom",
        x: "center",
        top: 180,
        selectedMode: false,
        textStyle: {
          color: "#999",
        },
        formatter: function (name) {
          // 不进行换行 返回20字符的名称
          return name.length > 20 ? name.substr(0, 20) + "..." : name;
        },
      },
      series: [
        {
          name: "详情",
          type: "pie",
          center: ["50%", "90"],
          radius: [40, 60],
          avoidLabelOverlap: false,
          silent: true,
          labelLine: {
            normal: {
              show: true,
              length: 10,
              length2: 80,
            },
          },
          label: {
            show: true,
            borderWidth: 20,
            borderRadius: 4,
            padding: [0, -80],
            textStyle: {
              color: "#999",
            },
            formatter: (params) => {
              return `${
                params.data.value > 10000
                  ? `${(params.data.value / 10000).toFixed(2)}万`
                  : params.data.value
              }${unit} ${params.percent}%\n`;
            },
          },
          emphasis: {
            label: {
              show: true,
              fontSize: "12",
              fontWeight: "bold",
            },
          },
          labelLayout: {
            color: "red",
          },
          data: series,
          clickable: false,
        },
      ],
    };

配置

import React, { useRef, useEffect } from "react";
import * as echarts from "echarts/core";
import { PieChart } from "echarts/charts";
import { GridComponent, LegendComponent } from "echarts/components";
import SkiaChart, { SVGRenderer } from "@wuba/react-native-echarts/skiaChart";
import { Dimensions } from "react-native";

echarts.use([SVGRenderer, PieChart, GridComponent, LegendComponent]);
const E_HEIGHT = 210;
const E_WIDTH = Dimensions.get("screen").width;
export default function BaseAndroidOrIosCharts({ option }) {
  const skiaRef = useRef(null);
  useEffect(() => {
    let chart;
    if (skiaRef.current) {
      chart = echarts.init(skiaRef.current, "light", {
        renderer: "svg",
        width: E_WIDTH,
        height: E_HEIGHT,
      });
      if (option) {
        chart.setOption(option);
      }
    }
    return () => chart?.dispose();
  }, [option]);

  return <SkiaChart ref={skiaRef} />;
}

1683256314172

Tooltip formatter neglects all other options

Is your feature request related to a problem? Please describe.
When the Tooltip formatter is used the other options, such as valueFormatter, textStyle and others are neglected.

This is for the most part fine since value formatting can be done inside the formatter directly. I have yet to find a way to apply styling. Not being able to apply styling is particularly problematic as the one applied when formatter is used shows the tooltip text in a very small font.

Edit:
I might add that the behavior is inconsistent. E.g. tooltip.textStyle.color does still apply when formatter is used, fontSize does not apply.

Web support?

Any plans to support web in this library?

I was running the example in a project where I have set up react-native-skia with expo & react-native-web and I got this error when running it for web. iOS/Android work fine. Using the example code in the README.

image

关于tooltip

1.tootip想要做自定义设置样式,除了模版字符串,目前有别的实现方式吗?
2.在tooltip中设置fontsize,使用formatter字体大小设置无效,图表为svg渲染

[Help] How to setting chart container size the right way ?

Hi, i want to ask about How to setting chart container size the right way ?

The chart not adapt its container with wrapper view even when i set same size (CHART_SIZE) for both view and chart.

Width = 380
Screenshot 2023-09-12 at 10 13 44

CHART_SIZE = 320 // want it expected
Screenshot 2023-09-12 at 10 14 48

export default function App() {
  echarts.use([SVGRenderer, LineChart, GridComponent, VisualMapComponent, MarkAreaComponent, MarkLineComponent]);

  options = {... some chart options}

  const chartRef = useRef<any>(null);

  useEffect(() => {
    let chart: any;
    if (chartRef.current) {
      chart = echarts.init(chartRef.current, 'light', {
        renderer: 'svg',
        width: 380, // if width = CHART_SIZE, cannot show full axis number
        height: CHART_SIZE,
      });
      chart.setOption(option);
    }
    return () => chart?.dispose();
  }, []);

  return (
    <View // wrapper view
      style={{
        height: CHART_SIZE,
        width: CHART_SIZE,
        borderWidth: 1,
      }}
    >
      <SvgChart ref={chartRef} />
    </View>
  );
}

const CHART_SIZE = 320;

Heatmap always giving 'Heatmap must use with visualMap' error even though we provided visual map.

Heatmap always giving 'Heatmap must use with visualMap' error even though we provided visual map.

import React, {useRef, useEffect} from 'react';
import {StyleSheet} from 'react-native';
import * as echarts from 'echarts/core';
import * as Echarts from 'echarts/charts';
import {GridComponent} from 'echarts/components';
import {SVGRenderer, SvgChart} from '@wuba/react-native-echarts';

// LineChart, BarChart, PieChart, ScatterChart, RadarChart, MapChart, TreeChart, TreemapChart, GraphChart, GaugeChart, FunnelChart, ParallelChart, SankeyChart, BoxplotChart, CandlestickChart, EffectScatterChart, LinesChart, HeatmapChart, PictorialBarChart, ThemeRiverChart, SunburstChart, CustomChart
echarts.use([SVGRenderer, Echarts.HeatmapChart, GridComponent]);

const HeatMap = props => {
const {styles} = props?.data;
const {height = 320, width = 320} = styles;
const skiaRef = useRef(null);
useEffect(() => {
function getVirtualData(year) {
const date = +echarts.time.parse(year + '-01-01');
const end = +echarts.time.parse(+year + 1 + '-01-01');
const dayTime = 3600 * 24 * 1000;
const data = [];
for (let time = date; time < end; time += dayTime) {
data.push([echarts.time.format(time, '{yyyy}-{MM}-{dd}', false), Math.floor(Math.random() * 10000)]);
}
return data;
}
const option = {
title: {
top: 30,
left: 'center',
text: 'Daily Step Count',
},
tooltip: {},
visualMap: {
min: 0,
max: 10000,
type: 'piecewise',
orient: 'horizontal',
left: 'center',
top: 65,
},
calendar: {
top: 120,
left: 30,
right: 30,
cellSize: ['auto', 13],
range: '2016',
itemStyle: {
borderWidth: 0.5,
},
yearLabel: {show: false},
},
series: {
type: 'heatmap',
coordinateSystem: 'calendar',
data: getVirtualData('2016'),
},
};
let chart;
if (skiaRef.current) {
chart = echarts.init(skiaRef.current, 'light', {
renderer: 'svg',
width: width,
height: height,
});
chart.setOption(option);
}
return () => chart?.dispose();
}, []);

return ;
};

export default HeatMap;

const styles = StyleSheet.create({});

Expected behavior
Need to render heat map.

Desktop (please complete the following information):

  • iOS
  • 16.1

Smartphone (please complete the following information):

  • Device: iPhone 14 Pro
  • OS:16.1
  • Browser [e.g. stock browser, safari]
  • Version [e.g. 22]

Additional context
Add any other context about the problem here.

Multiple Instances of the same chart

I have a question regarding displaying multiple instances of the Line Chart with different datasets. Is there an example on how I can accomplish that. I tried passing different ref objects to SVGChart but it always takes the data properties of the second chart.

Please support Korean in the library!

Is your feature request related to a problem? Please describe.
Please support Korean in the wuba/react-native-echarts!

Describe the solution you'd like
If you use Korean, the letters are displayed strangely, so it would be nice to have Korean support.

Describe alternatives you've considered
I'm in a situation where I have to use another library because it doesn't support Korean, but I want to use wuba/react-native-echarts!

Additional context
image

MarkLine silent true still triggers tooltip

Based on the docs. silent = true should disable the mouse events.
Whether to ignore mouse events. The default value is false, for triggering and responding to mouse events.
Because I have a custom tooltip formatter if I touch the markLines im getting
ERROR TypeError: undefined is not a function, js engine: hermes

Here is the needed code

     tooltip: {
       trigger: "item",
       formatter: function (params) {
         return params.dataIndex === 0
           ? `${rangeLow.format("DD")}-${rangeLow.add(firstWeek.length-1, "day").format("DD MMM")} \n ${params.value.toFixed(1)}%` //prettier-ignore
           : params.dataIndex === 52
           ? `${rangeHigh.subtract(lastWeek.length-1, "day").format("DD")}-${rangeHigh.format("DD MMM")} \n ${params.value.toFixed(1)}%` //prettier-ignore
           : `${newRangeLow.add(params.dataIndex-1, "week").format("DD")}-${newRangeLow.add(params.dataIndex-1,"week").add(6,'day').format("DD MMM")} \n ${params.value.toFixed(1)}%` //prettier-ignore
       },
       confine: true,
     },
     xAxis: [
       {
         type: "category",
         data: Object.keys(resultObject),
         show: false,
       },
       {
         position: "bottom",
         type: "category",
         data: categories.map((category) => category.charAt(0)),
         xAxisIndex: 2,
         show: true,
         axisLine: {
           show: false,
         },
         axisTick: {
           show: false,
         },
       },
     ],
     yAxis: {
       show: false,
       type: "value",
     },
     series: [
       {
         data: Object.values(resultObject),
         type: "bar",
         itemStyle: {
           color: (seriesIndex) =>
             seriesIndex.dataIndex > 39 ? "#FF5630" : "#A19D9A",
         },
         markLine: {
           data: [
             // case A
             {
               silent: true,
               yAxis: yearlyAverage.toFixed(0),
               symbol: ["none", "none"],
               label: {
                 position: "insideStartTop",
               },
             },
             {
               silent: true,
               yAxis: last13WeeksAverage.toFixed(0),
               // symbol: ["none", "none"],
               label: {
                 position: "insideEndTop",
               },
             },
           ],
         },

Also a small demonstration with a video. First I touch on the white bars, then I touch the markLine

Screen.Recording.2023-08-18.at.3.44.42.PM.mov

P.S : symbol: ["none","none"] should removed both arrow and circle but doesnt. If i use one "none" only the circle gets removed.

Unable to use SVG in markline label.formatter

Code:

	markLine: {
							
	symbolKeepAspect: true,
	symbolSize: [20, 20],
	label: {
		position: 'insideEndBottom',
		distance: 10,
		formatter: function (params) {
			return `<svg class="svg-icon" viewBox="0 0 20 20">
				<path d="M15.475,6.692l-4.084-4.083C11.32,2.538,11.223,2.5,11.125,2.5h-6c-0.413,0-0.75,0.337-0.75,0.75v13.5c0,0.412,0.337,0.75,0.75,0.75h9.75c0.412,0,0.75-0.338,0.75-0.75V6.94C15.609,6.839,15.554,6.771,15.475,6.692 M11.5,3.779l2.843,2.846H11.5V3.779z M14.875,16.75h-9.75V3.25h5.625V7c0,0.206,0.168,0.375,0.375,0.375h3.75V16.75z"></path>
			</svg>`;
			},
		fontSize: 10,
		fontWeight: 'bold',
		borderWidth: 1,
		borderRadius: 5,
		padding: 5,
		rotate: 360,
		backgroundColor: '#fff',
	},

	data: [
		{
		xAxis: new Date().getTime(),
		},
							
	],
},

I cant get any svgs to work and would appreciate any help possible.

What I'm trying to make:

Screenshot 2023-09-14 at 11 37 17 AM

Using SkiaChart for this if that matters.

Problem with markLine not being displayed

Describe the bug
The markLine property cannot display the set dotted line

To Reproduce
Steps to reproduce the behavior:
const option = {
xAxis: {
type: 'category',
data: ['Mon', 'Tue', 'Wed', 'Thu', 'Fri', 'Sat', 'Sun'],
},
yAxis: {
type: 'value',
},
series: [
{
data: [150, 230, 224, 218, 135, 147, 260],
type: 'line',
markLine: {
silent: false,
data: [
{
name: '平均线',
type: 'average',
xAxis: new Date().getTime(),
},
{
name: 'Y 轴值为 100 的水平线',
yAxis: 110,
},
],
},
},
],
};
this.chart = echarts.init(this.skiaRef, 'light', {
renderer: 'svg',
width: winWidth,
height: height ?? 320,
});
this.chart.setOption(option);
render() {
return (<SvgChart ref={ele => (this.skiaRef = ele)} />)
}

Expected behavior
The markLine attribute can take effect

Screenshots
image

Desktop (please complete the following information):
Version
echarts 5.4.3
@wuba/react-native-echarts 1.2.4
@shopify/react-native-skia 0.1.210
react-native 0.71.3
react 18.2.0

Smartphone (please complete the following information):

  • Device: iPhoneX
  • OS: ios16.4

Additional context
Add any other context about the problem here.

不支持中文.....,图表加中文会显示不出来

Is your feature request related to a problem? Please describe.
A clear and concise description of what the problem is. Ex. I'm always frustrated when [...]

Describe the solution you'd like
A clear and concise description of what you want to happen.

Describe alternatives you've considered
A clear and concise description of any alternative solutions or features you've considered.

Additional context
Add any other context or screenshots about the feature request here.

pieChart 不支持graphic, legend 这些吗

Is your feature request related to a problem? Please describe.
A clear and concise description of what the problem is. Ex. I'm always frustrated when [...]

Describe the solution you'd like
A clear and concise description of what you want to happen.

Describe alternatives you've considered
A clear and concise description of any alternative solutions or features you've considered.

Additional context
Add any other context or screenshots about the feature request here.

[iOS][crash]RCTFatalException: Unhandled JS Exception: ReferenceError: Can't find variable: globalThis

Describe the bug
crash when init on ios 12 and 11

Smartphone (please complete the following information):

  • Device: iPhone XR etc.
  • OS: iOS 11、12
Maps to node_modules/@wuba/react-native-echarts/lib/module/SVGRenderer.js:7:0 (globalThis)

var _navigator;
import SVGPainter from 'zrender/lib/svg/Painter';
import { vNodeToString } from './SVGCore';
import { updateAttrs } from 'zrender/lib/svg/patch';
import { DOMParser } from '@xmldom/xmldom';
const isRn = ((_navigator = navigator) === null || _navigator === void 0 ? void 0 : _navigator.product) === 'ReactNative';
globalThis.DOMParser = DOMParser;
^
class CustomSVGPainter extends SVGPainter {
  constructor(root, storage, opts, id) {
    if (isRn) {
      var _this$_svgDom$setZren, _this$_svgDom;
      // @ts-ignore
      super(null, storage, opts);
      // @ts-ignore
      this._svgDom = this._oldVNode.elm = root.elm;
      // @ts-ignore
      (_this$_svgDom$setZren = (_this$_svgDom = this._svgDom).setZrenderId) === null || _this$_svgDom$setZren === void 0 ? void 0 : _this$_svgDom$setZren.call(_this$_svgDom, id);

Visual of graph breaks when changing from having data to none

Screen.Recording.2023-09-21.at.11.49.02.AM.mov
  if (TTBikeRef.current) {
      chart = echarts.init(TTBikeRef.current, "light", {
        renderer: "svg",
        width: E_WIDTH * 0.9,
        height: E_HEIGHT * customHeight,
      });
      chart.setOption(option);

My custom height will change depending of how many positions i have. (This happens to solve my legend vertical problem)

The problem is when I change graphs for example from Road to TT if i have data on Road my TT will be weird. See the video to understand it better. Thanks in advance

Live chart support

Hi,

Are there any plans to include live chart support through a data stream from an API?

Unable to resolve "@shopify/react-native-skia"

Im getting this error when a try to run the app with Expo in Android. I'm using the react-native-svg.

Android Bundling failed 5672ms
Unable to resolve "@shopify/react-native-skia" from "../../packages/app/node_modules/@wuba/react-native-echarts/src/skiaChart.tsx"

[Solved] Not displayed at all if use npm.

Describe the bug
Nothing will be rendered if zrender version is not same as the echarts' zrender version.
I think it is better to write about zrender version in "Getting Started".

To Reproduce
Steps to reproduce the behavior:

  1. Create fresh react-native project.
  2. Follow "Getting Started→Installation", but use npm instead of yarn
  3. Do exactly as "Write a simple line chart"
  4. No any graph will be displayed.

Expected behavior
Graph should be rendered.

Desktop (please complete the following information):

  • OS: Mac M1 Ventura 13.4

How to Solve the problem

  1. use yarn instead of npm
  2. specify zrender version in package.json
    if echarts version is 5.4.1, you need to add zrender 5.4.1
    if echarts version is 5.4.2, you need to add zrender 5.4.3

Error: Unable to resolve module @shopify/react-native-skia from

react-native-echarts V1.0.0
node: 18.15.0
react: 18.1.0
expo: ~47.0.9
导入方式:
import SvgChart, {SVGRenderer} from '@wuba/react-native-echarts/svgChart'; import {SVGRenderer, SkiaChart} from '@wuba/react-native-echarts';

问题原因:刚开始发现svg形式在web上不能用,android可以,就在web开发上用了SkiaChart,skiaChart可以在web上成功运行,但在android报错Error: Unable to resolve module @shopify/react-native-skia from

根据https://shopify.github.io/react-native-skia/docs/getting-started/web执行了如下命令
expo install @shopify/react-native-skia

现在运行起来后报错,执行不了
`Error: Unable to resolve module ./debugger-ui/debuggerWorker.aca173c4 from D:\workspaces\xfa\one-app/.:
None of these files exist:

  • debugger-ui\debuggerWorker.aca173c4(.native|.native.ts|.ts|.native.tsx|.tsx|.native.js|.js|.native.jsx|.jsx|.native.json|.json)`

请问是什么原因导致的问题?

Cannot read property 'trigger' of null

我在使用过程中多点几次就会出现这个错误: Cannot read property 'trigger' of null
"react-native":" 0.72.3"
"echarts": "^5.4.3",
"@wuba/react-native-echarts": "^1.2.2"

swiping the chart cause InteractionManager.runAfterInteractions not called

Describe the bug
滑动图表导致 InteractionManager.runAfterInteractions 回调未调用

To Reproduce
Steps to reproduce the behavior:

  1. 打开 /node_modules/react-native/Libraries/Interaction/InteractionManager.js 修改 DEBUG 变量值为 const DEBUG: true = true; 为了打开 InteractionManager 日志输出;
  2. 使用SVGRenderer 创建一个 PieChart 图表;
  3. 单指滑动图表;
  4. 查看 log, 只见 InteractionManager: create interaction handle, 并未见 InteractionManager: clear interaction handle.
  5. 由于 InteractionManager 未清除 interaction handle, 所以导致之后所有 InteractionManager.runAfterInteractions 都不会执行回调;

Expected behavior
InteractionManager.runAfterInteractions 回调正常调用

Screenshots
react-native-echarts/src/components/PanResponderHandler.tsx

image

Desktop (please complete the following information):
yarn react-native info

System:
    OS: macOS 12.5
    CPU: (10) x64 Apple M1 Pro
    Memory: 27.81 MB / 16.00 GB
    Shell: 5.8.1 - /bin/zsh
  Binaries:
    Node: 10.13.0 - /var/folders/jf/cxqjd8792n56l9qb0hd1x9zm0000gn/T/yarn--1688960306407-0.10676307975997412/node
    Yarn: 1.22.19 - /var/folders/jf/cxqjd8792n56l9qb0hd1x9zm0000gn/T/yarn--1688960306407-0.10676307975997412/yarn
    npm: 6.4.1 - ~/.nvm/versions/node/v10.13.0/bin/npm
    Watchman: 2023.05.22.00 - /opt/homebrew/bin/watchman
  Managers:
    CocoaPods: 1.11.3 - /opt/homebrew/bin/pod
  SDKs:
    iOS SDK:
      Platforms: DriverKit 22.1, iOS 16.1, macOS 13.0, tvOS 16.1, watchOS 9.1
    Android SDK:
      Android NDK: 20.1.5948944
  IDEs:
    Android Studio: 2022.2 AI-222.4459.24.2221.9862592
    Xcode: 14.1/14B47b - /usr/bin/xcodebuild
  Languages:
    Java: 11.0.18 - /Users/lwl/.sdkman/candidates/java/current/bin/javac
    Python: 3.7.9 - /Users/lwl/.pyenv/shims/python
  npmPackages:
    @react-native-community/cli: Not Found
    react: 16.11.0 => 16.11.0
    react-native: 0.62.3 => 0.62.3
  npmGlobalPackages:
    *react-native*: Not Found

Smartphone (please complete the following information):

== Devices ==
-- iOS 16.1 --
    iPhone 11 (F9A8C42D-B78E-4F38-B47A-6A1C13D969A6) (Booted)

Additional context
"@wuba/react-native-echarts": "^1.2.1"

Strange "shaking" behaviour for coordinateSystem + roundCap bar charts for higher than 100% percent values

Describe the bug
When creating a polar coordinateSystem bar chart with roundCap set to true for a value on the series, that dataset will appear to shake during animation.

To Reproduce
Steps to reproduce the behavior:

  1. Create a simple react-native-echarts skeleton bar chart
  2. Modify the series to include coordinateSystem: 'polar' and roundCap: true
  3. Include a data value in the series higher than the max value specified in angleAxis.max: 100 such as data: [140]
  4. Ensure animations are enabled
  5. Load the graph

Expected behavior
The animation reaches it's final destination without causing the element to shake.

Screenshots/Videos
iOS

RPReplay_Final1696256842.mp4

Android

qemu-system-x86_64_vweiv0kB7l.mp4

Smartphone (please complete the following information):

  • Device: iPhone 12 Pro Max

  • OS: iOS 16.6

  • Browser: Safari

  • Versions:
    "@wuba/react-native-echarts": "^1.2.4",
    "echarts": "^5.4.3",

  • Device: Android Emulator (Pixel 5 API 30)

  • OS: Android 11.0 Google APIs

  • Browser N/A

  • Versions:
    "@wuba/react-native-echarts": "^1.2.4",
    "echarts": "^5.4.3",

Additional context
This appears to occur across iOS/Android/Web on both Skia and SVG. But does not seem to happen on the non react-native library. If there are any suggestions/alternatives methods for a better way to create this style of graph that can replicate the second snack that would be fantastic.

Expo Snacks: (animationDuration can be changed but the issue still occurs)
https://snack.expo.dev/@davidtjones/6ffc24
https://snack.expo.dev/@davidtjones/close-to-production-example

Apache ECharts Example (Not experiencing the problem here):
Apache ECharts example

Thank you very much for working on this library, it works incredibly well. If I can provide any more information I'll be happy to help.

visualMap and ZoomDataComponent wrong working together ?

Demo working fine: DEMO

I copy exact the demo's option object into example code in RN. and problem come like the video below.
i don't really know the problem come from echart issues or my wrong implementing ?

"@wuba/react-native-echarts": "^1.2.3",
"echarts": "^5.4.3",
"react-native": "0.72.3"

Screen.Recording.2023-09-18.at.13.24.59.mov

Infinite re-render with callback ref

Describe the bug
Passing a callback ref to SkiaChart or SvgChart cause component to be infinite re-rendered.
This might be due to missing deps array for useImperativeHandle

To Reproduce
Steps to reproduce the behavior:

  1. Pass a callback ref to SkiaChart or SvgChart
  2. React error

Expected behavior
Re-render only if necessary

SvgChart不支持markPoint?

SvgChart option 增加 markPoint 不显示

const option = {
animation: true,
tooltip: {
show: false,
},
grid: {
top: "20%",
left: 17,
right: 17,
bottom: "20%",
},
xAxis: [
{
type: "time",
axisLabel: {
fontSize: 10,
align: "center",
showMaxLabel: true,
formatter: "{MM}.{dd}",
},
axisPointer: {
type: "shadow",
},
axisLine: {
show: true,
lineStyle: {
color: "#CCD2E3",
align: "left",
cap: "round",
},
},
splitLine: {
show: true,
interval: 0,
lineStyle: {
type: "dashed",
},
},
axisTick: {
show: false,
},
},
],
yAxis: [
{
show: false,
type: "value",
min: 0,
max: 100,
interval: 20,
axisTick: {
lineStyle: {
color: "rgba(104, 183, 219, 0.2)",
},
},
axisLabel: {
formatter: "{value}",
fontSize: 10,
color: "#333",
},
},
],
series: [
{
name: "效率",
type: "line",
symbol: "circle",
connectNulls: true,
symbolSize: 6,
itemStyle: {
color: "#77C176",
},
labelLine: {
lineStyle: {
color: "#f00",
},
},
lineStyle: {
width: 1,
color: "#77C176",
},
label: {
show: true,
position: "top",
distance: 8,
formatter: "{@[1]}%",
fontSize: 10,
color: "#77C176",
fontWeight: "400",
lineHeight: 11,
},
markPoint: {
emphasis: {
disabled: true,
},
animation: false,
data: [
{
name: "markPoint",
value: "",
xAxis: "2022-04-24",
yAxis: 0,
symbol: "circle",
symbolSize: [10, 10],
itemStyle: { color: "#FFC700" },
},
],
},
data: [
["2022-04-18", 10],
["2022-04-19", 20],
["2022-04-20", "unchecked"],
["2022-04-21", "x"],
["2022-04-22", 100],
["2022-04-23", "checkable"],
["2022-04-24", "today"],
],
},
],
};

"@wuba/react-native-echarts": "^1.0.0"
"echarts": "^5.4.2",

Custom(ize) gestures

Is your feature request related to a problem? Please describe.
Today, it is impossible to customize the behavior of defined gestures.

Describe the solution you'd like

For react-native-gesture-handler:

  • Listen to gesture events
  • Modify the properties of defined gestures (Example: wait for a long pressure before activating the Pan gesture, so as not to block scrolling in a ScrollView)
  • Add new gestures that are listened to in race of defined gestures
  • Overload defined gestures (which requires the user to forward events to zrender correctly, kind of tricky)

For custom gesture logic:

  • Apart from listening events, it will be difficult to achieve the other points

Common:

  • Being able to disable gestures (a simpler solution instead of overloading defined gestures, user will also be responsible for event forwarding)

Describe alternatives you've considered

  • Allow user to use the react-native-gesture-handler API onto existing gestures

In Pie Chart : SvgChart doesn't renders scrollable legend properly in Android

I am using import SvgChart, {SVGRenderer} from '@wuba/react-native-echarts/svgChart'; to display a bar chart in the mobile application.

I have used a bar chart in my mobile application. but when I use a Bar chart using the type:'scroll' attribute with limited 8 items it is working fine, each bar chart functionality is working fine. But when I add 10 more items to the bar chart and then scroll arrows are displayed on the screen but the list is displayed for a fraction of a second and then disappears from the screen and then if I press the next or previous arrow keys to view the next list items is shows list items for the fraction of seconds and again disappears.

Expected behavior
The pie chart should display the list of items on the screen, list items should not disappear from the screen.

Screenshots

Limited data size:
Screenshot_1688982443

Data size of more than 15

bar_chart_scroll_issue.mp4

Cannot update textStyle in tooltip with formatter

Hi! I'm trying to customize tooltip in series with type: 'custom' using formatted function, but I'm not able to change styles of text

    type: 'custom',
    data: [7000],
    tooltip: {
      formatter: (params: CallbackDataParams) => {
        return `Data: ${params.data}`;
      },
      textStyle: {
        fontSize: 20,
      },
    },

The result:

image

Recommend Projects

  • React photo React

    A declarative, efficient, and flexible JavaScript library for building user interfaces.

  • Vue.js photo Vue.js

    🖖 Vue.js is a progressive, incrementally-adoptable JavaScript framework for building UI on the web.

  • Typescript photo Typescript

    TypeScript is a superset of JavaScript that compiles to clean JavaScript output.

  • TensorFlow photo TensorFlow

    An Open Source Machine Learning Framework for Everyone

  • Django photo Django

    The Web framework for perfectionists with deadlines.

  • D3 photo D3

    Bring data to life with SVG, Canvas and HTML. 📊📈🎉

Recommend Topics

  • javascript

    JavaScript (JS) is a lightweight interpreted programming language with first-class functions.

  • web

    Some thing interesting about web. New door for the world.

  • server

    A server is a program made to process requests and deliver data to clients.

  • Machine learning

    Machine learning is a way of modeling and interpreting data that allows a piece of software to respond intelligently.

  • Game

    Some thing interesting about game, make everyone happy.

Recommend Org

  • Facebook photo Facebook

    We are working to build community through open source technology. NB: members must have two-factor auth.

  • Microsoft photo Microsoft

    Open source projects and samples from Microsoft.

  • Google photo Google

    Google ❤️ Open Source for everyone.

  • D3 photo D3

    Data-Driven Documents codes.