This library is React Native wrapper of popular Native charting library MPAndroidChart and Charts
Inspired by react-native-mp-android-chart and react-native-ios-charts
React Native Charts Wrapper is built on MPAndroidChart(v3.1.0) & Charts(v3.3.0), support both android & iOS.
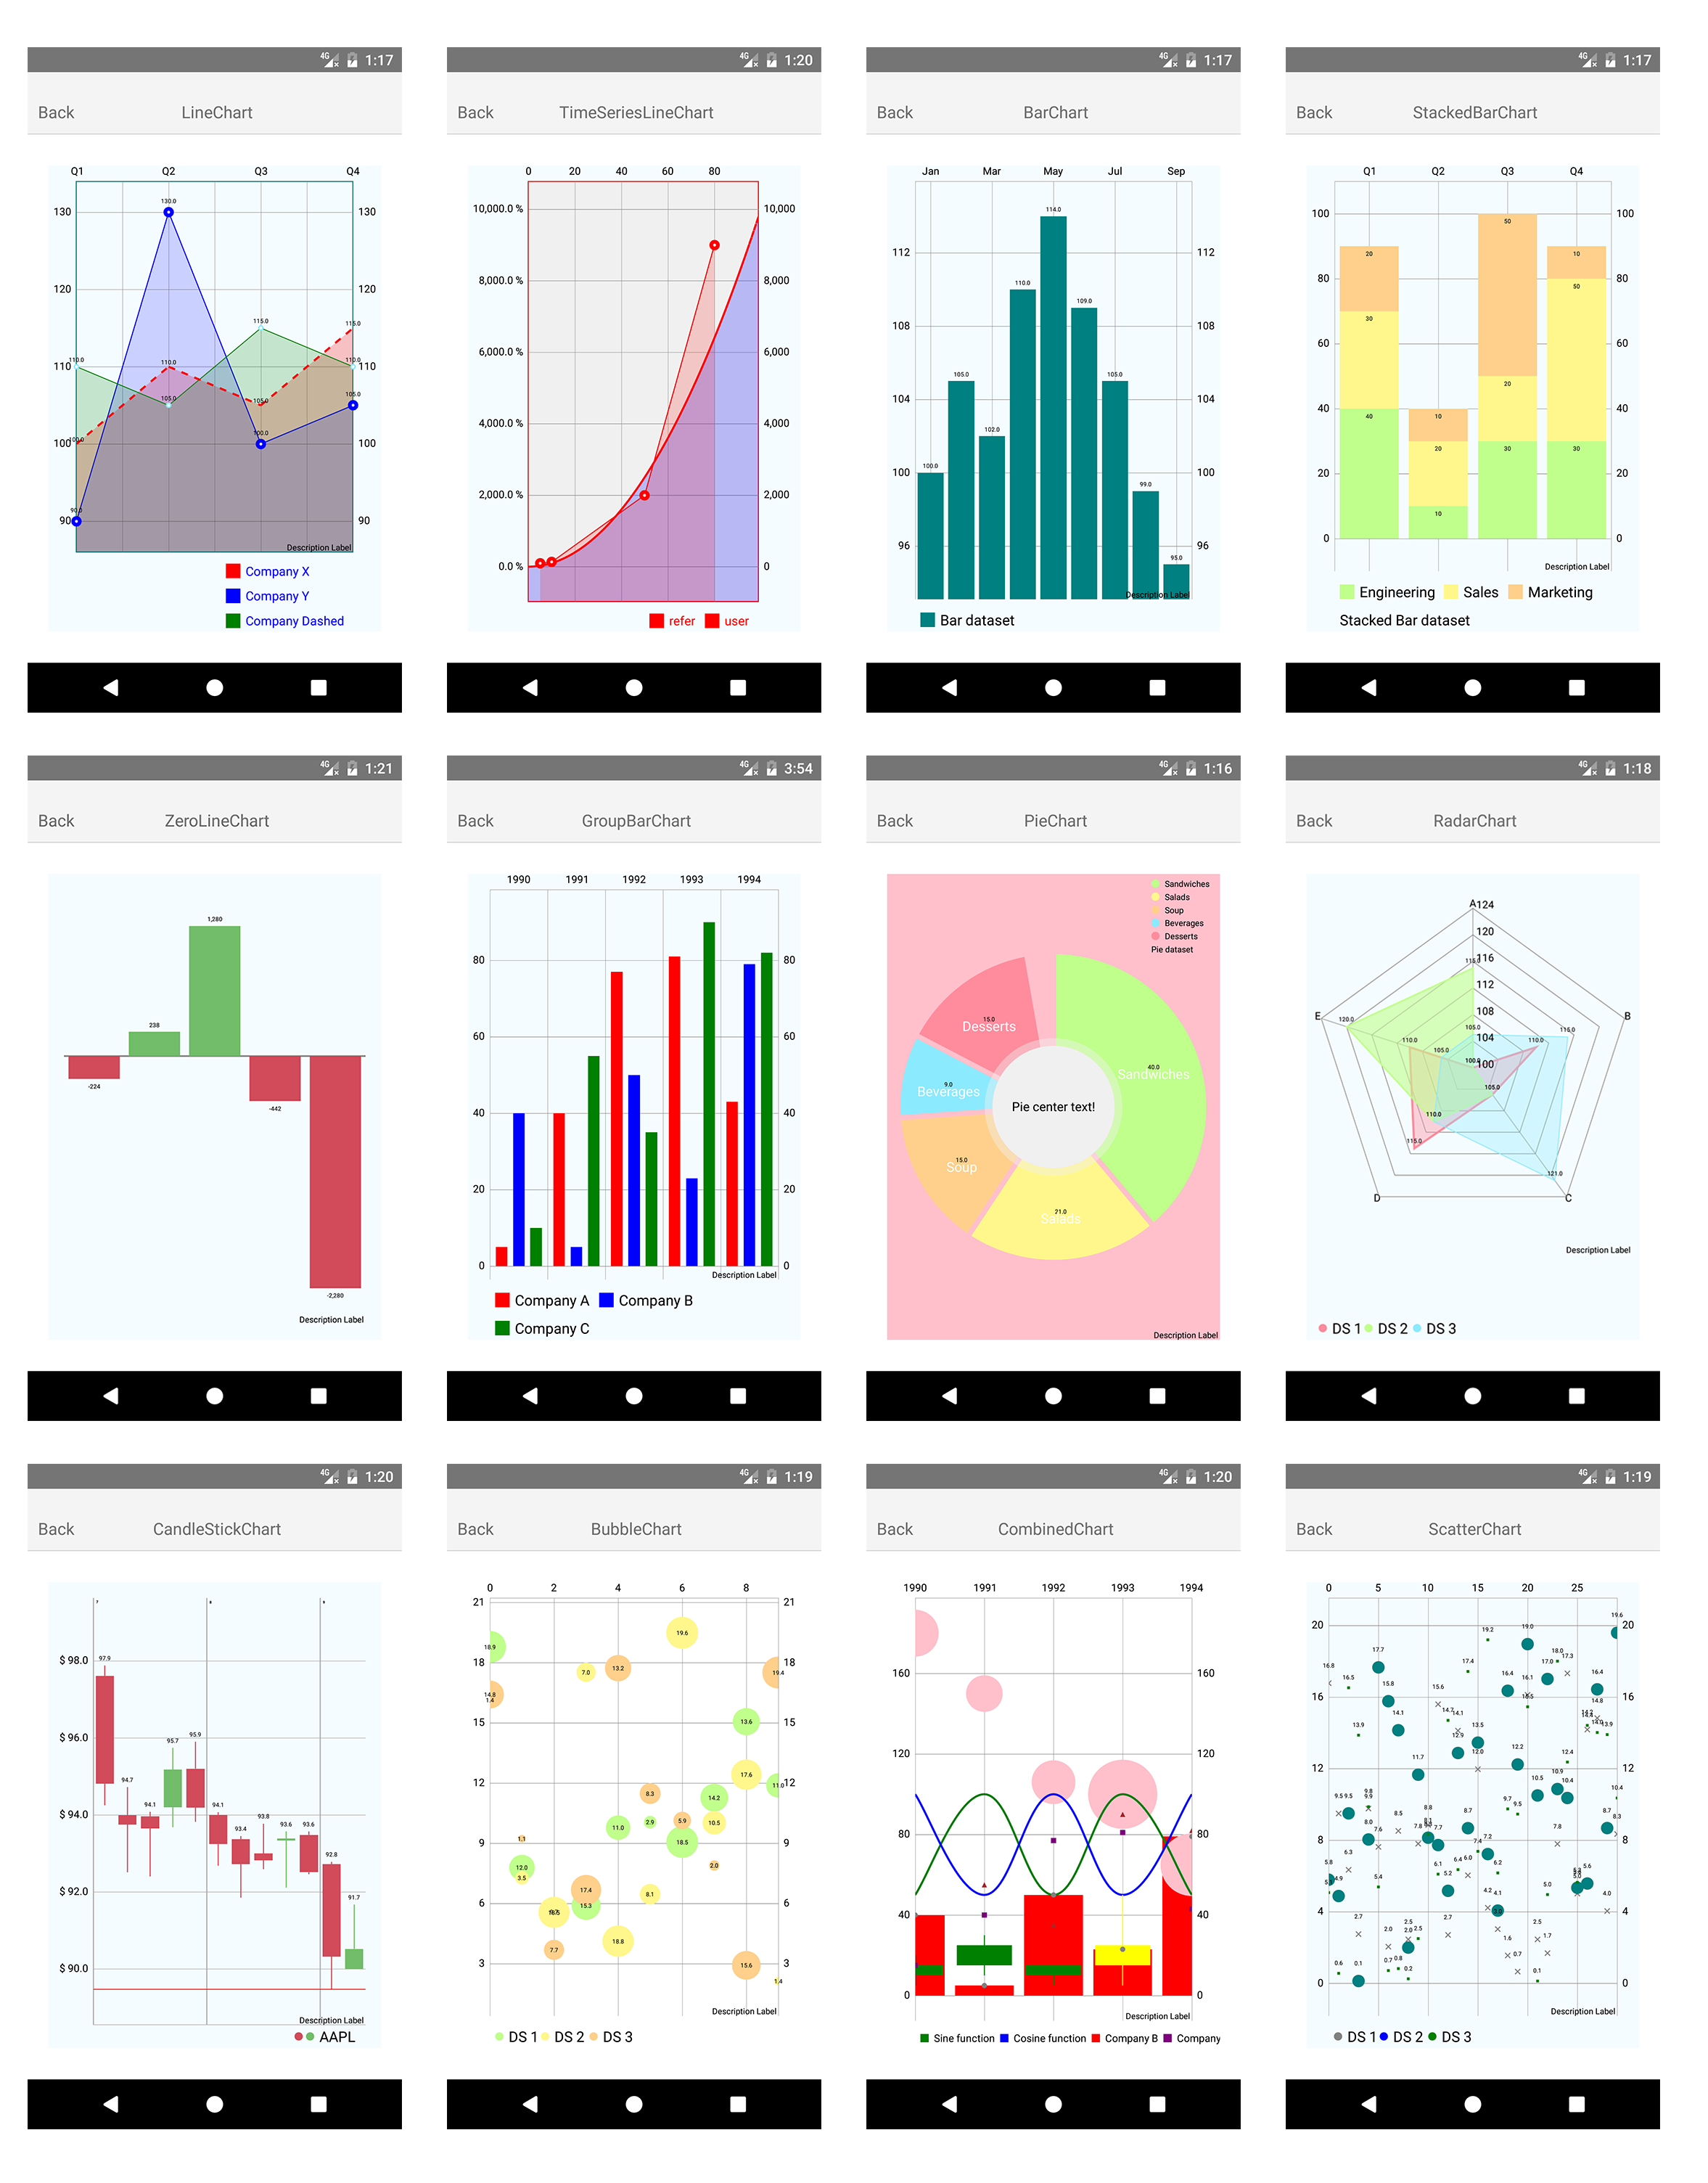
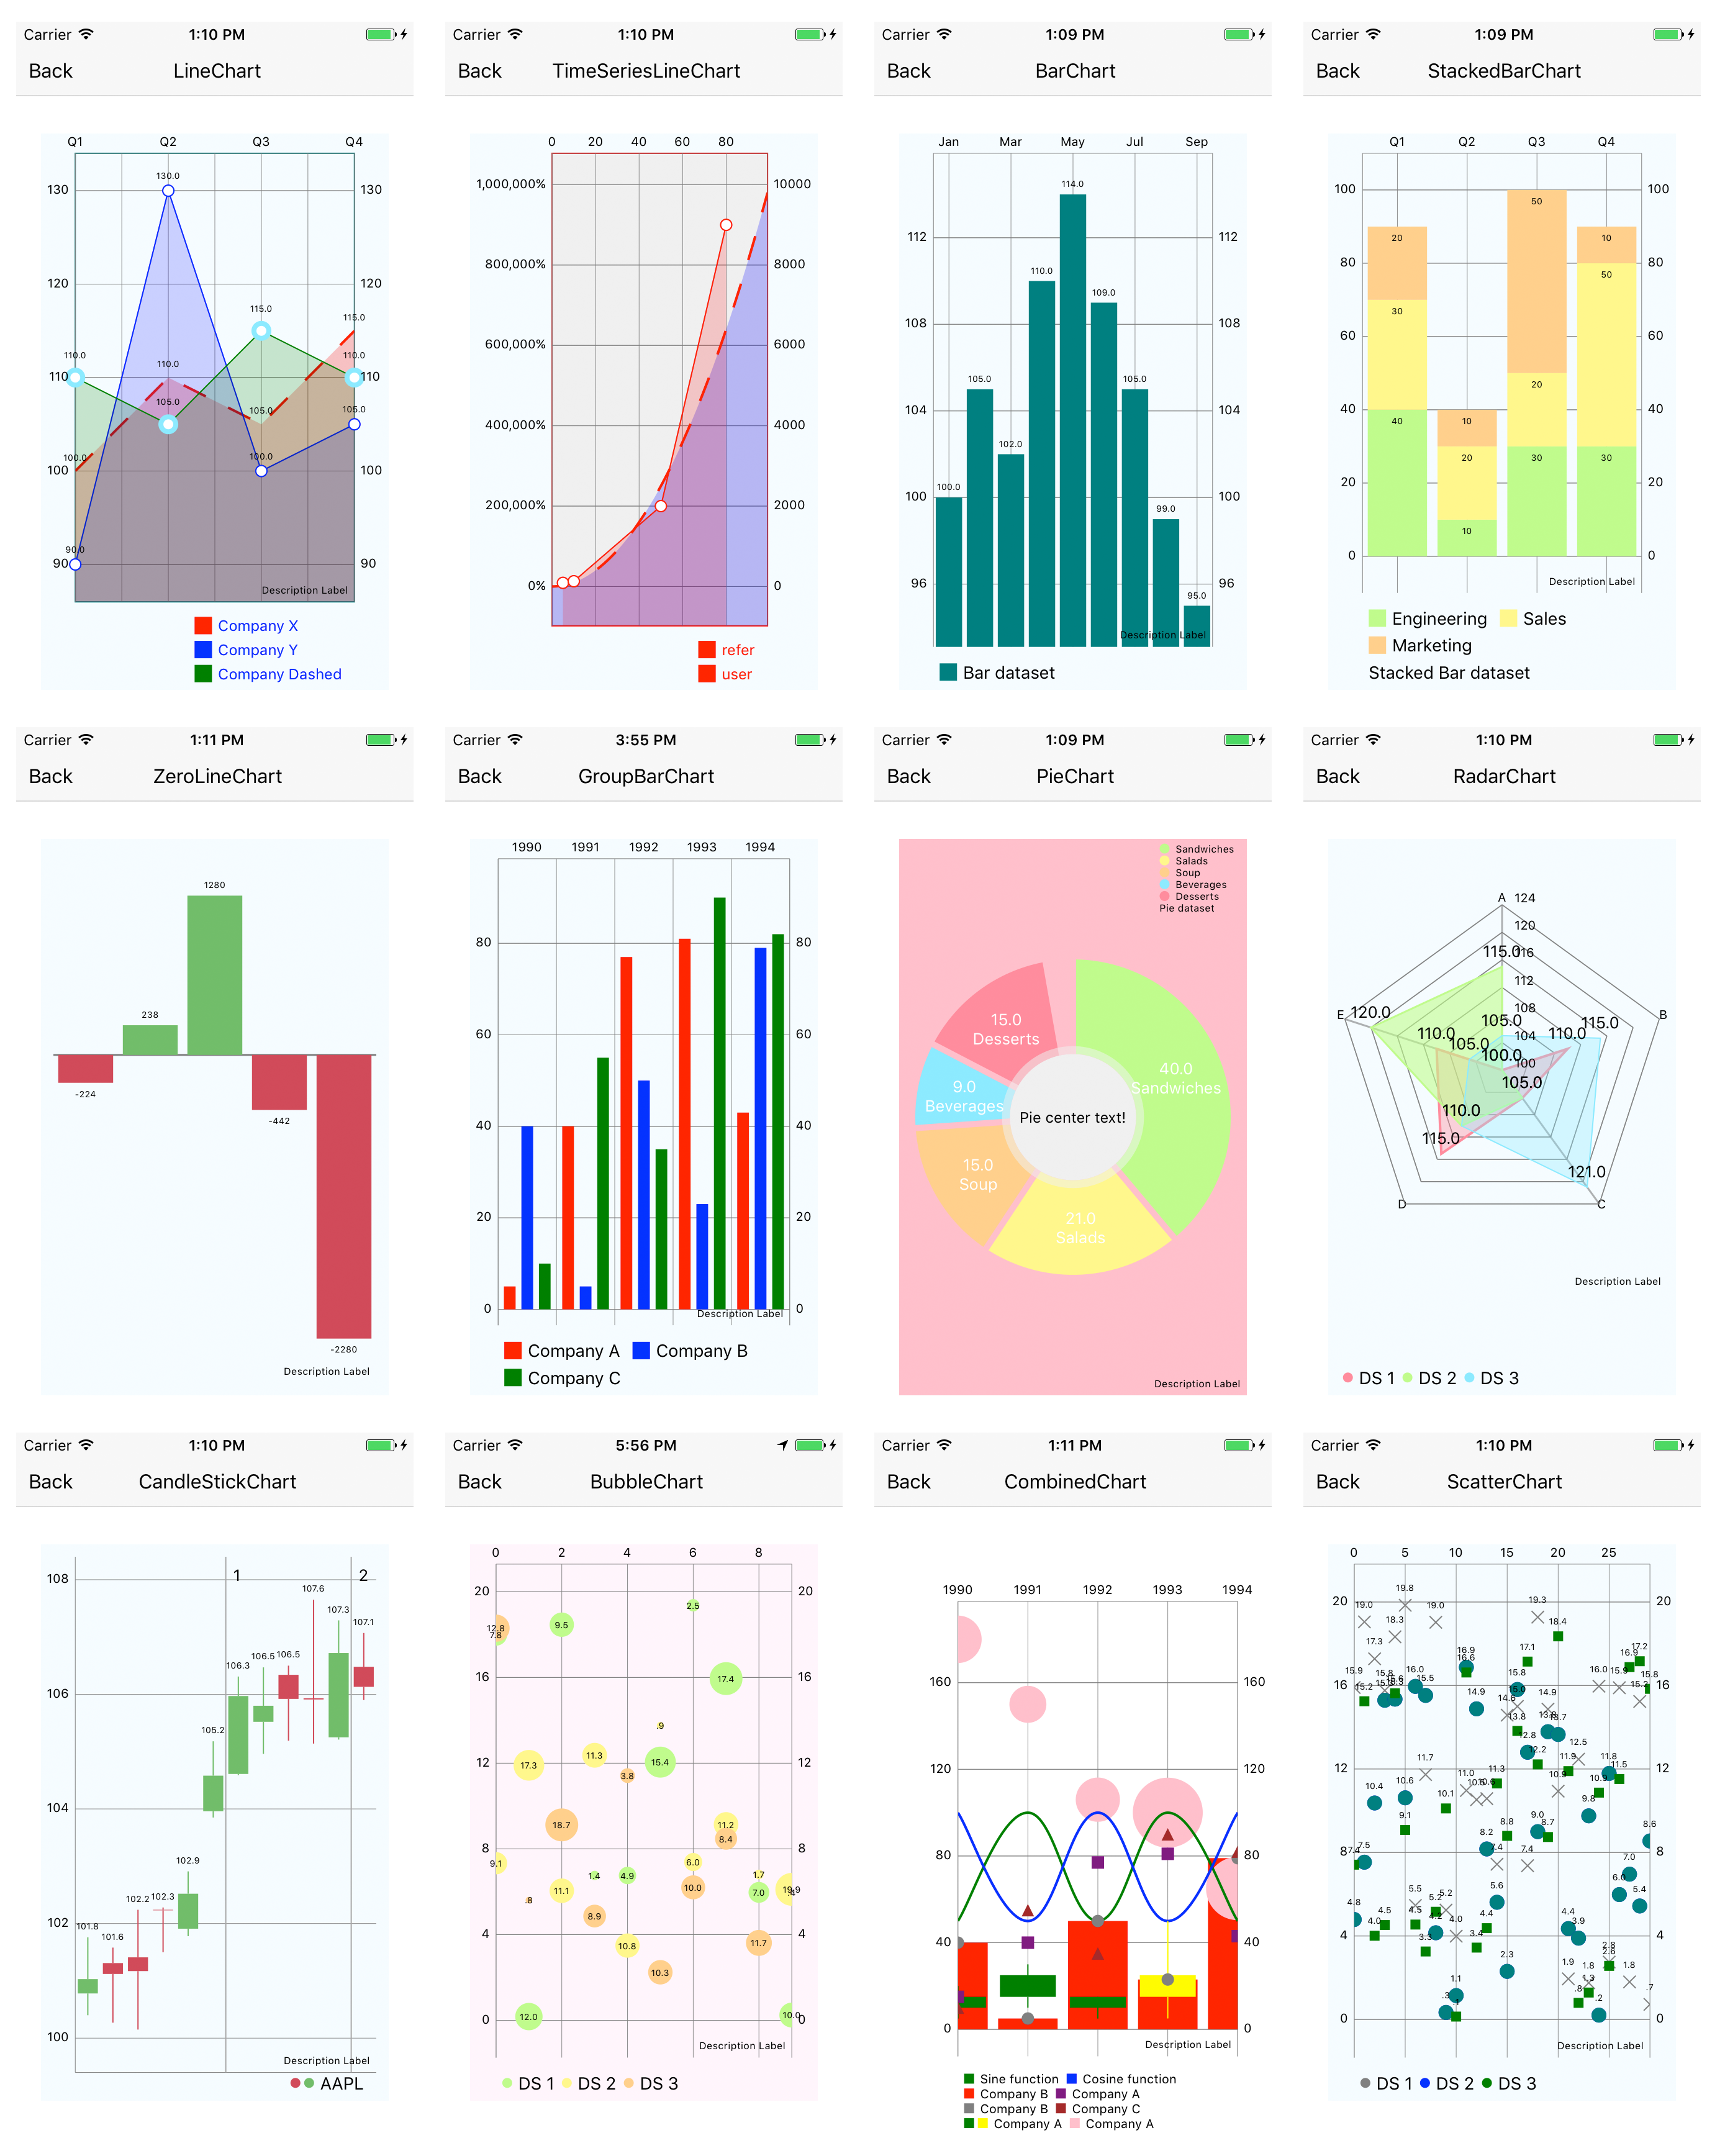
- Bar(Stack,Group)
- Line
- Scatter
- Bubble
- Pie
- Radar
- Combined
- CandleStick
- expo init demo
- cd demo
- expo install react-native-charts-wrapper
- eas build
- npx react-native init demo
- cd demo
- npm install --save react-native-charts-wrapper
- cd ios && pod install
- npx react-native run-ios/run-android
import React from 'react';
import {
AppRegistry,
StyleSheet,
Text,
View, processColor
} from 'react-native';
import {LineChart} from 'react-native-charts-wrapper';
export default class App extends React.Component {
render() {
return (
<View style={{flex: 1}}>
<View style={styles.container}>
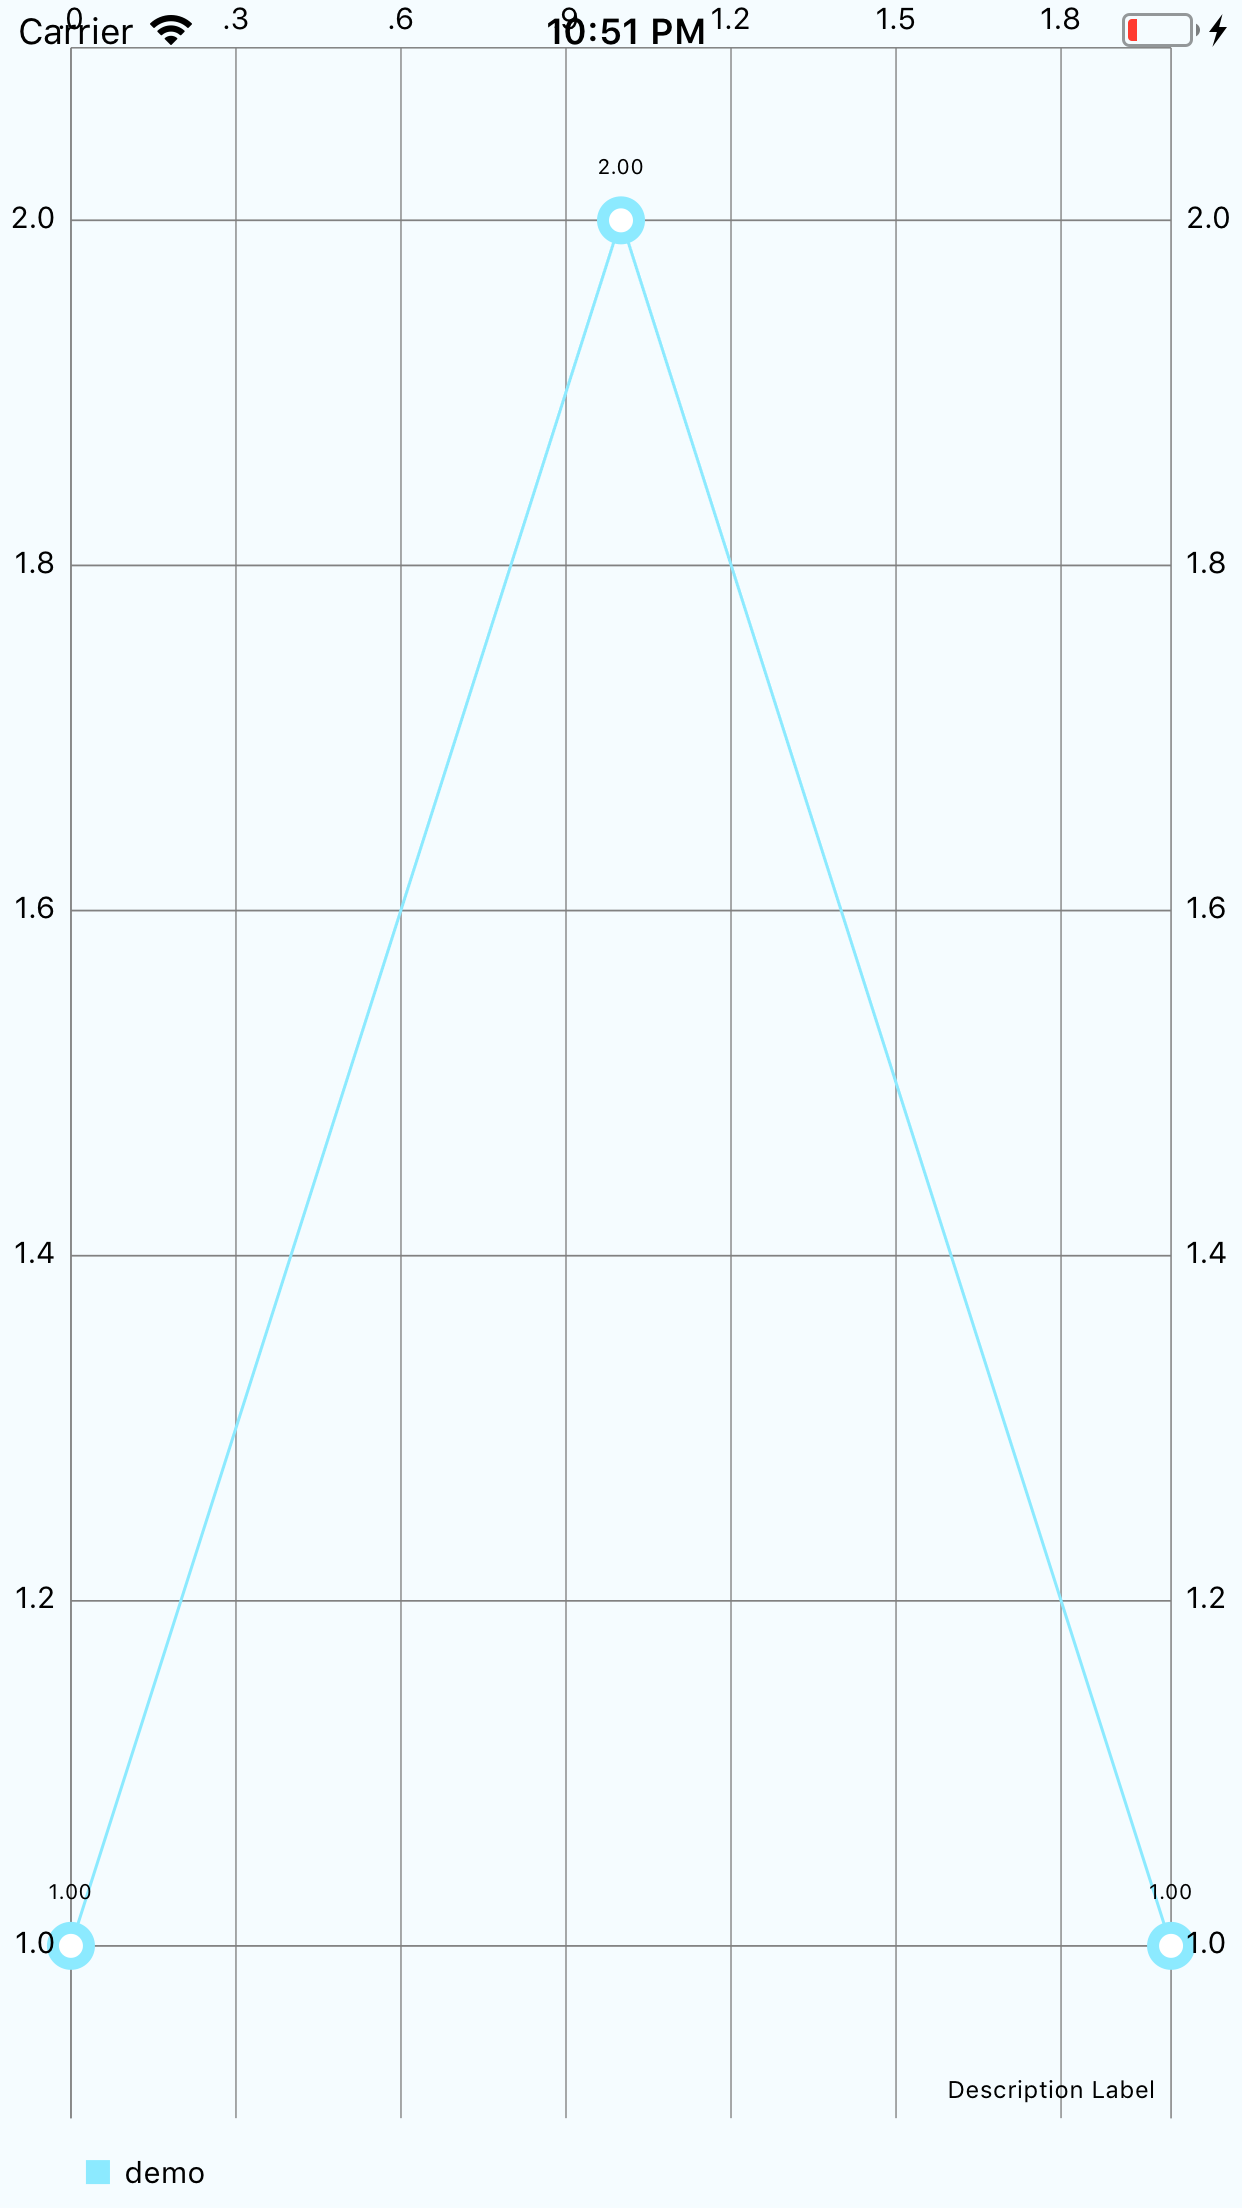
<LineChart style={styles.chart}
data={{dataSets:[{label: "demo", values: [{y: 1}, {y: 2}, {y: 1}]}]}}
/>
</View>
</View>
);
}
}
const styles = StyleSheet.create({
container: {
flex: 1,
backgroundColor: '#F5FCFF'
},
chart: {
flex: 1
}
});
There are 8 supported charts with many configuration options. Almost all configuration available in base MPAndroidChart library are available through this wrapper. More details on available configuration can be found on their wiki.
Example of how charts are used and how to apply configuration can be found in example.
Android and IOS have different convention:
- color's alpha in android is 0-255, in ios is 0-1
- percent in android is 0-100, in ios is 0-1
- animation.duration in MpAndroidChart is milliseconds, in Charts is seconds.
- their enum case name is always different, for example XAxisPosition, in MpAndroidChart is BOTH_SIDED, in Charts is bothSided.
Here we use android Convention
Always use processColor to set color
-
Complete Form
  data : {
      ...
      dataSets: [
          {
              values: [
                  {x: 5, y: 90},
                  {x: 10, y: 130},
                  {x: 50, y: 2000, marker: "eat more"},
                  {x: 80, y: 9000, marker: "eat less"}
              ]
          },
          ...
      ]
  }Ï
marker is optional, if x is omitted, index will be used.
-
Simplified Form
  data: {
      ...
      dataSets: [
          {
              values: [5, 40, 77, 81, 43]
          },
          ....
      ]
  }
index will used as x.
check Example->TimeSeriesLineChart for details
onSelect
Triggered when a chart value is selected. The event passed back will include the coordinates of the touch as well as the data (including marker label) selected.
onChange
Triggered for various supported events on each platform. Due to the different nature of gesture handling on each platform as well as the different implementations of the underlying chart libraries, the same events are not supported on every platform. For full details on the supported events, see the table below:
| Event Name | Description | iOS | Android |
|---|---|---|---|
chartScaled |
When a chart is scaled/zoomed via a pinch zoom gesture. | ✅ | ✅ |
chartTranslated |
When a chart is moved/translated via a drag gesture. | ✅ | ✅ |
chartPanEnd |
When a chart pan gesture ends. | ✅ | ❌ |
chartGestureStart |
When a chart gesture starts. | ❌ | ✅ |
chartGestureEnd |
When a chart gesture ends. | ❌ | ✅ |
chartLongPress |
When a chart is long pressed. | ❌ | ✅ |
chartSingleTap |
When a chart is single tapped. | ❌ | ✅ |
chartFling |
When a chart recieves a fling gesture. | ❌ | ✅ |
doubleTapped |
When a chart is double tapped | ❌ | ✅ |
check Example->MultipleChart for details.
Support direct function call.
You can use chart.moveViewToX(...) or other functions directly.
check Example->MovingWindowChart for details.
supported functions:
-
highlights([...])
it can be used to highlight entries programmatically, or clear already highlighted entries if you pass empty array to it: highlights([])
-
moveViewTo/moveViewToX/moveViewToAnimated/centerViewTo/centerViewToAnimated
-
fitScreen
-
setDataAndLockIndex
It will rescale and move to the begining of your data when new data is set by default, this is not expected when you want to load more data when user scrolls.
setDataAndLockIndex will remain x/y/zoom when you load more data.
Because of the implementation of MpAndroidChart, if the action of setDataAndLockIndex is triggered by user dragging,
then the range of new data (xMax - xMin) should be equal to original data(this basicly means size of new data equals to old one), otherwise the calculation of position transition won't be accurate,
use may find the chart suddenly blink to another position.
This restriction only exists in android, in iOS, we have no such problem.You can check the example InfiniteScrollLineChartScreen.
Several extra properties are introduced:
-
group&identifier&syncX&syncY
They are useful when you want to implement linkage charts.
Charts will sync its operation to other charts in the same group. All these sync jobs are done at native side.
You can check the example LinkageChartScreen.
Another way of syncing charts is to use onChange, but the performace is poor. You can check the example MultipleChartScreen.
There is a stock kLine chart in example, it combines group&identifier and setDataAndLockIndex together.
Support custom marker content.
check Example->TimeSeriesLineChart for details.
size of chart
you can set chart to fixed width & height, or flex:1
The MIT License
Copyright (c) 2017 wuxudong
Copyright (c) 2016 Martin Skec
Copyright (c) 2016 Jose E. Padilla
Permission is hereby granted, free of charge, to any person obtaining a copy of this software and associated documentation files (the "Software"), to deal in the Software without restriction, including without limitation the rights to use, copy, modify, merge, publish, distribute, sublicense, and/or sell copies of the Software, and to permit persons to whom the Software is furnished to do so, subject to the following conditions:
The above copyright notice and this permission notice shall be included in all copies or substantial portions of the Software.
THE SOFTWARE IS PROVIDED "AS IS", WITHOUT WARRANTY OF ANY KIND, EXPRESS OR IMPLIED, INCLUDING BUT NOT LIMITED TO THE WARRANTIES OF MERCHANTABILITY, FITNESS FOR A PARTICULAR PURPOSE AND NONINFRINGEMENT. IN NO EVENT SHALL THE AUTHORS OR COPYRIGHT HOLDERS BE LIABLE FOR ANY CLAIM, DAMAGES OR OTHER LIABILITY, WHETHER IN AN ACTION OF CONTRACT, TORT OR OTHERWISE, ARISING FROM, OUT OF OR IN CONNECTION WITH THE SOFTWARE OR THE USE OR OTHER DEALINGS IN THE SOFTWARE.


![dependabot[bot] avatar](https://avatars.githubusercontent.com/in/29110?v=4 "dependabot[bot]")


