ggRough
Read this first
{ggrough} is in a dormant state. Please be aware that this project doesn't work with recent releases of {ggplot2} (although the needed changes might not be big and some people have tried to fix them). If you came here, there are other more recent projects that you might find interesting (e.g. {roughnet}, {roughsf}, r-sketchy and maybe more). I set the repo in 'read-only' mode for now (feel free to fork). Hopefully, there will be a time in the future when I can dedicate more time to work on it: there have been many improvements to {patchwork} that would solve some of the existing shortcomings. I still believe that a nice way to create sketchy visualisations would be a neat addition to the ggplot2 ecosystem, and they have been a great help in my teaching practice.
What is ggrough?
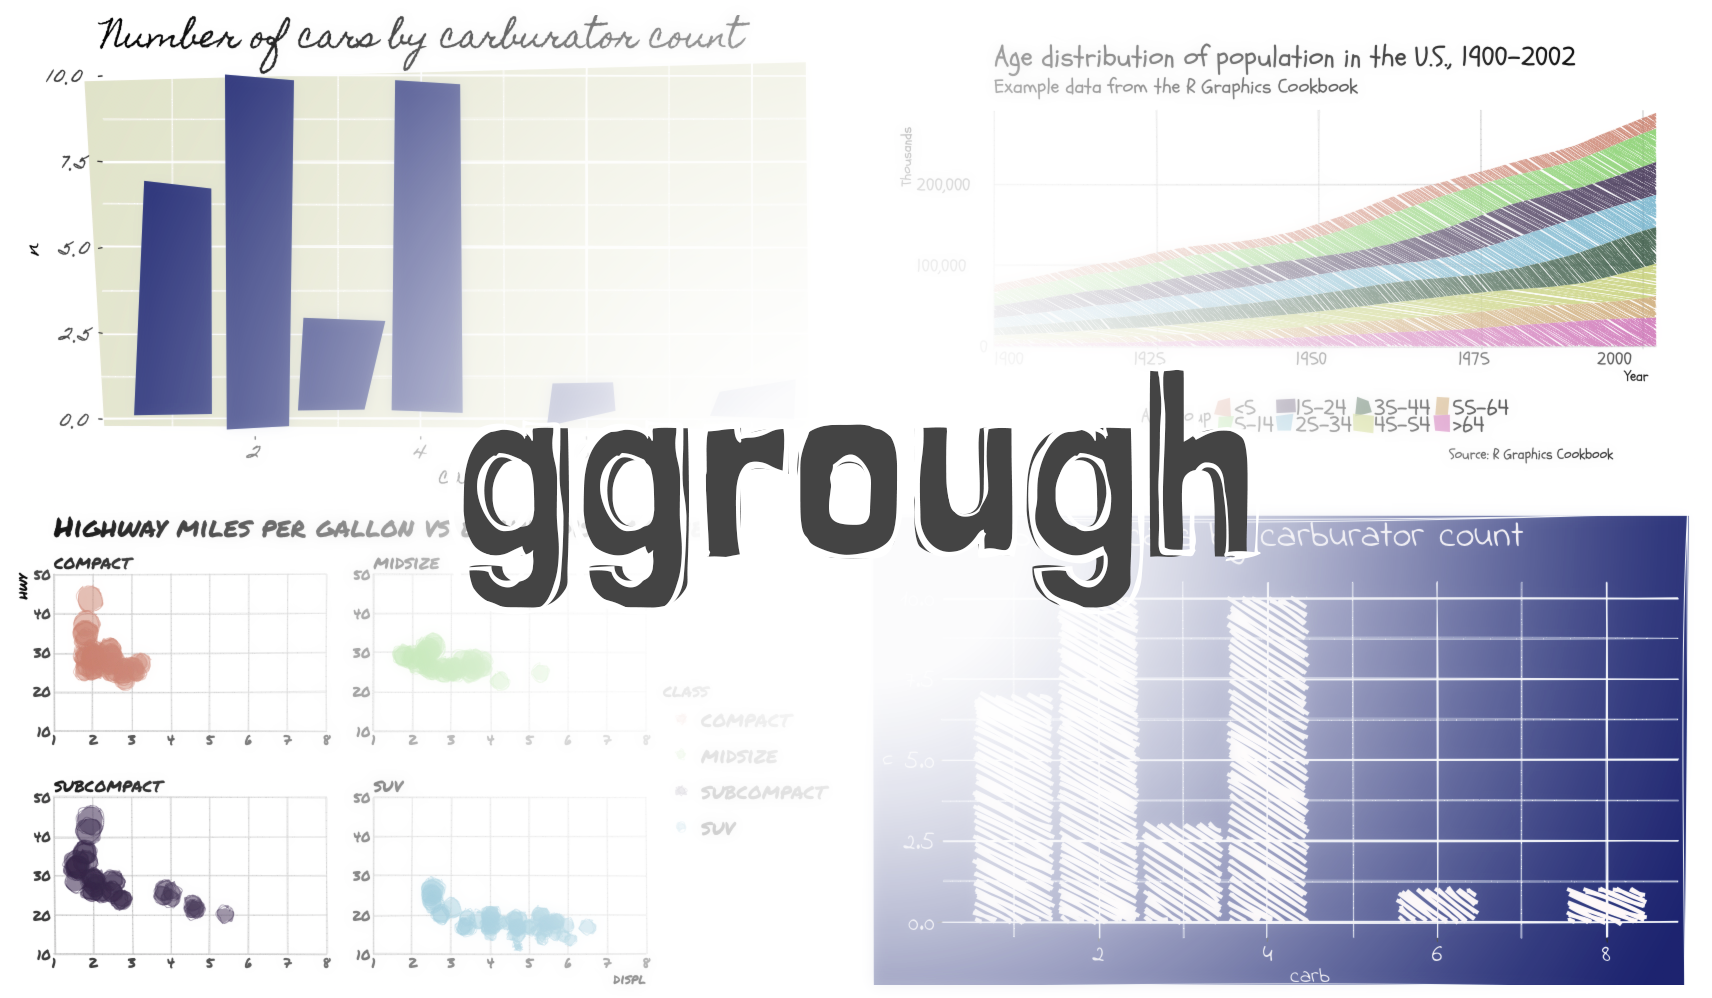
ggrough is an R package that converts your
ggplot2 plots to rough/sketchy charts,
using the excellent javascript roughjs library.
library(ggplot2)
count(mtcars, carb) %>%
  ggplot(aes(carb, n)) +
  geom_col() +
  labs(title="Number of cars by carburator count") +
  theme_grey(base_size = 16) -> p
p
library(ggrough)
options <- list(
  Background=list(roughness=8),
  GeomCol=list(fill_style="zigzag", angle_noise=0.5, fill_weight=2))
get_rough_chart(p, options)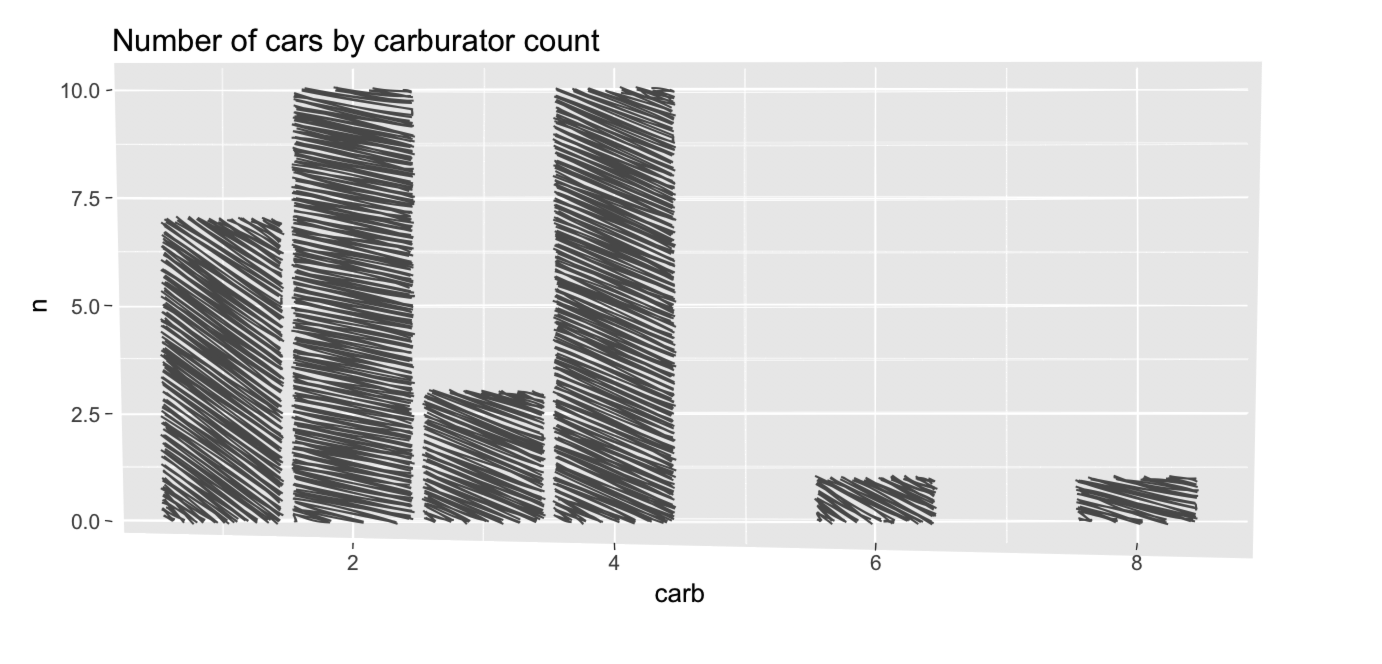
How to install
install.packages("devtools") # if you have not installed "devtools" package
devtools::install_github("xvrdm/ggrough")
How to use
Call get_rough_chart(), using your ggplot2 chart as the first
argument. See this page for more ggrough examples and all the available
options to customize your
output.
Word of caution
ggrough is a work in progress and still has big bugs.
Contributions are welcome!
ggrough works “ok” with RStudio Viewer. However you need to redraw
your chart everytime you change the size of the Viewer tab and the
charts will redraw when you try to copy it via Export -> Save As Image. The latter can be annoying since some roughjs settings can add
a lot of randomness.
ggrough doesn’t work well with Rmarkdown files yet. For example, it
can only generate one chart per document. If you have multiple charts it
overlays them on top of each other.
Under the hood
ggrough is an htmlwidget. It converts your
ggplot2 chart to SVG using the package
svglite then parse the different
elements (<rect>, <path>, <circle>…) to create a chart in a HTML
Canvas
element[1] with roughjs.
An article explaining how ggrough works is in the making, to help
potential contributors get started.
Thanks
This package is only possible thanks to the massive work of:
- Kent Russell —
twitter:timelyportfolio and
Bob Rudis — twitter:hrbrmstr for the
enormous educational content they created or shared about
htmlwidgetandggplot2. - Preet Shihn — twitter:preetster and
all the contributors of
roughjs. - Hadley Wickham —
twitter:hadleywickham and all
the contributors of
ggplot2. - Lionel Henry —
twitter:_lionelhenry and all the
contributors of
svglite
roughjscan also render to SVG. This will be supported byggroughin the future