In this assignment for Coursera's Algorthmic Thinking course we were to create two functions for clustering data into subsets of similar items. We were then to analyze the performance of the functions in three areas:
- Efficiency
- Automation
- Quality
For the purposes of having data to perform operations on, we used data that correlated cancer risk by zip code in the United States.
The two algorithms being analyzed were hierarchical clustering and k-means clustering.
The first function we were to create was one which performed the hierarchical clustering of data by first initializing all starting data points as a cluster, and then iteratively finding the two clusters with the closest centers and merging them. This is done until we have only the number of desired clusters remaining.
The second method involved initializing the desired number of clusters as empty clusters. For our purposes, we initialized the the desired empty clusters at locations that correlated to the highest population counties. The data is then clustered to those initial points by distance and the center is re-calculated. After this, the steps of clustering and re-centering is done a desired number of iterations.
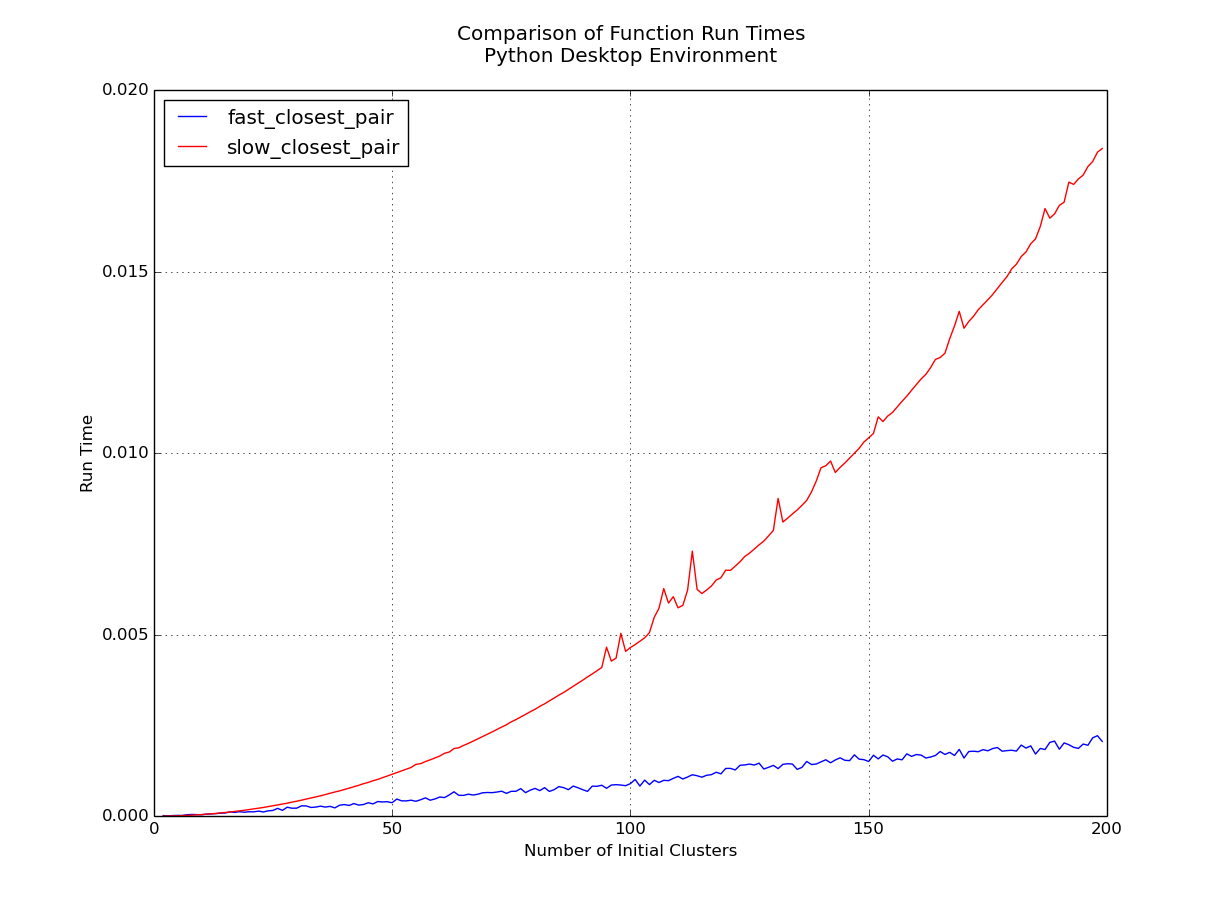
Clear winner here is the k-means clustering function. Asymptotically we can say that it's running at O(n) while the hierarchical algorithm is running at O(n2log2n).
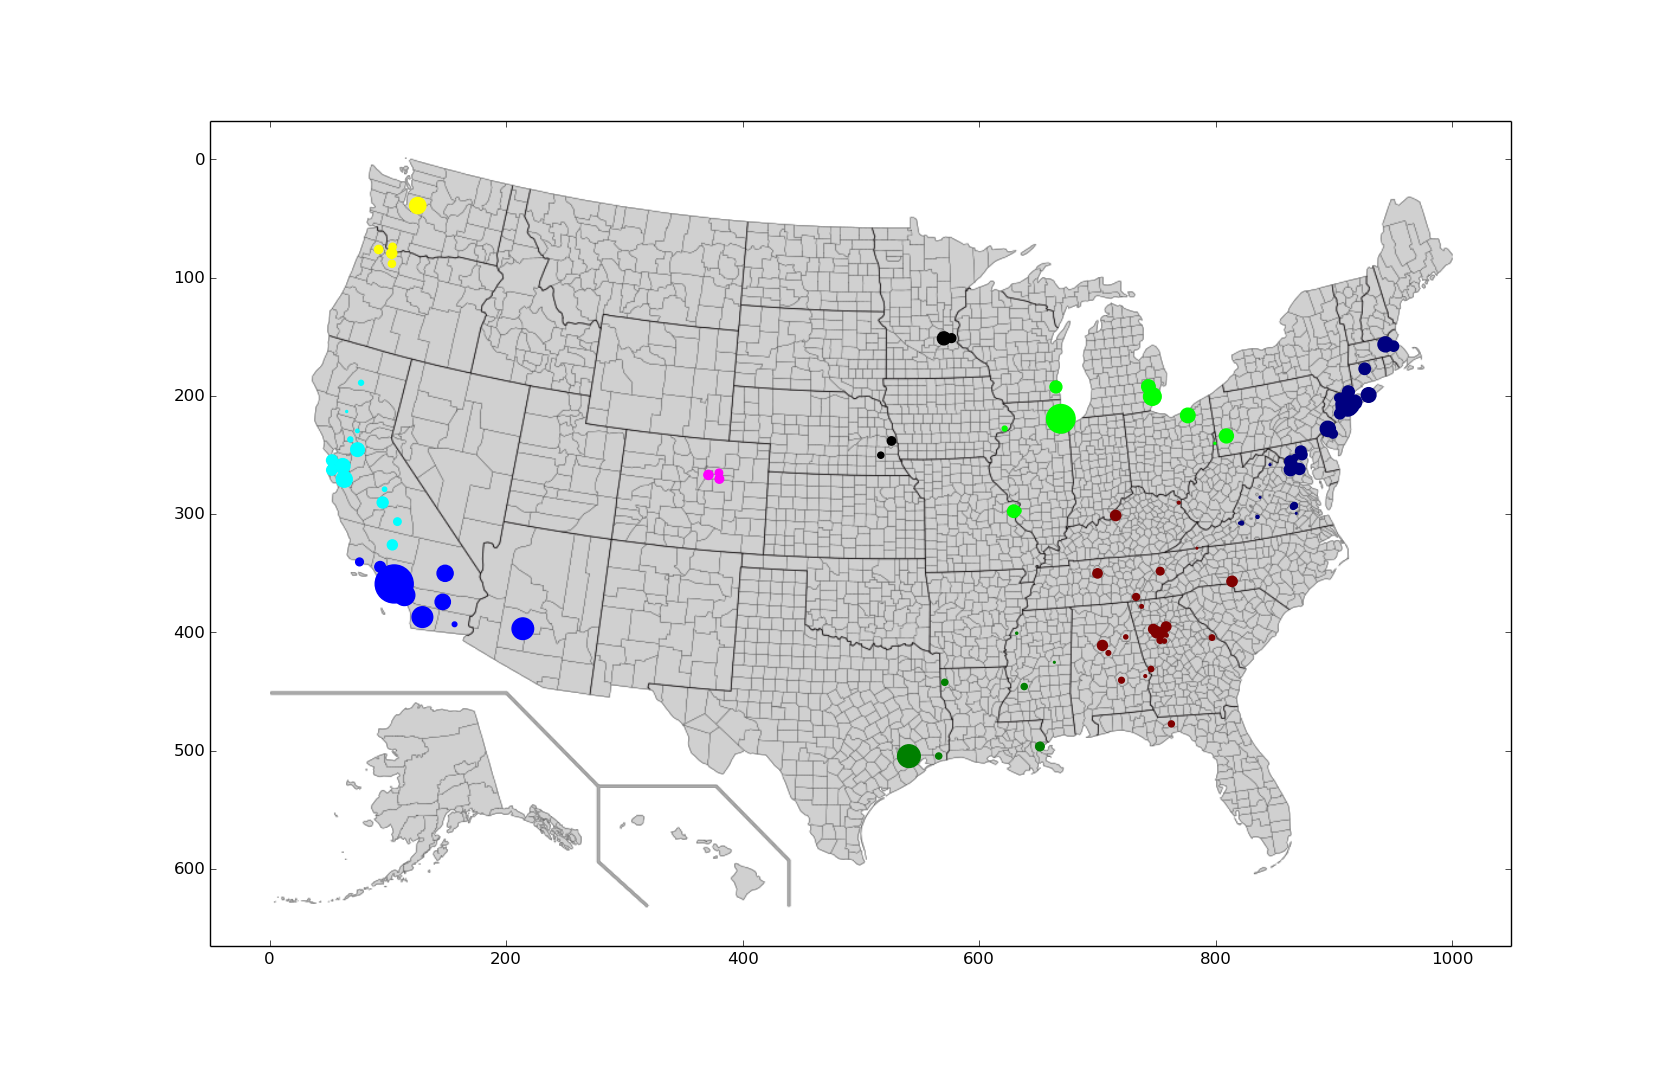
Plot of hierarchical data for the 111 counties with the highest cancer rates clustered into nine regions:
Plot of k-means data for the 111 counties with the highest cancer rates clustered into nine regions
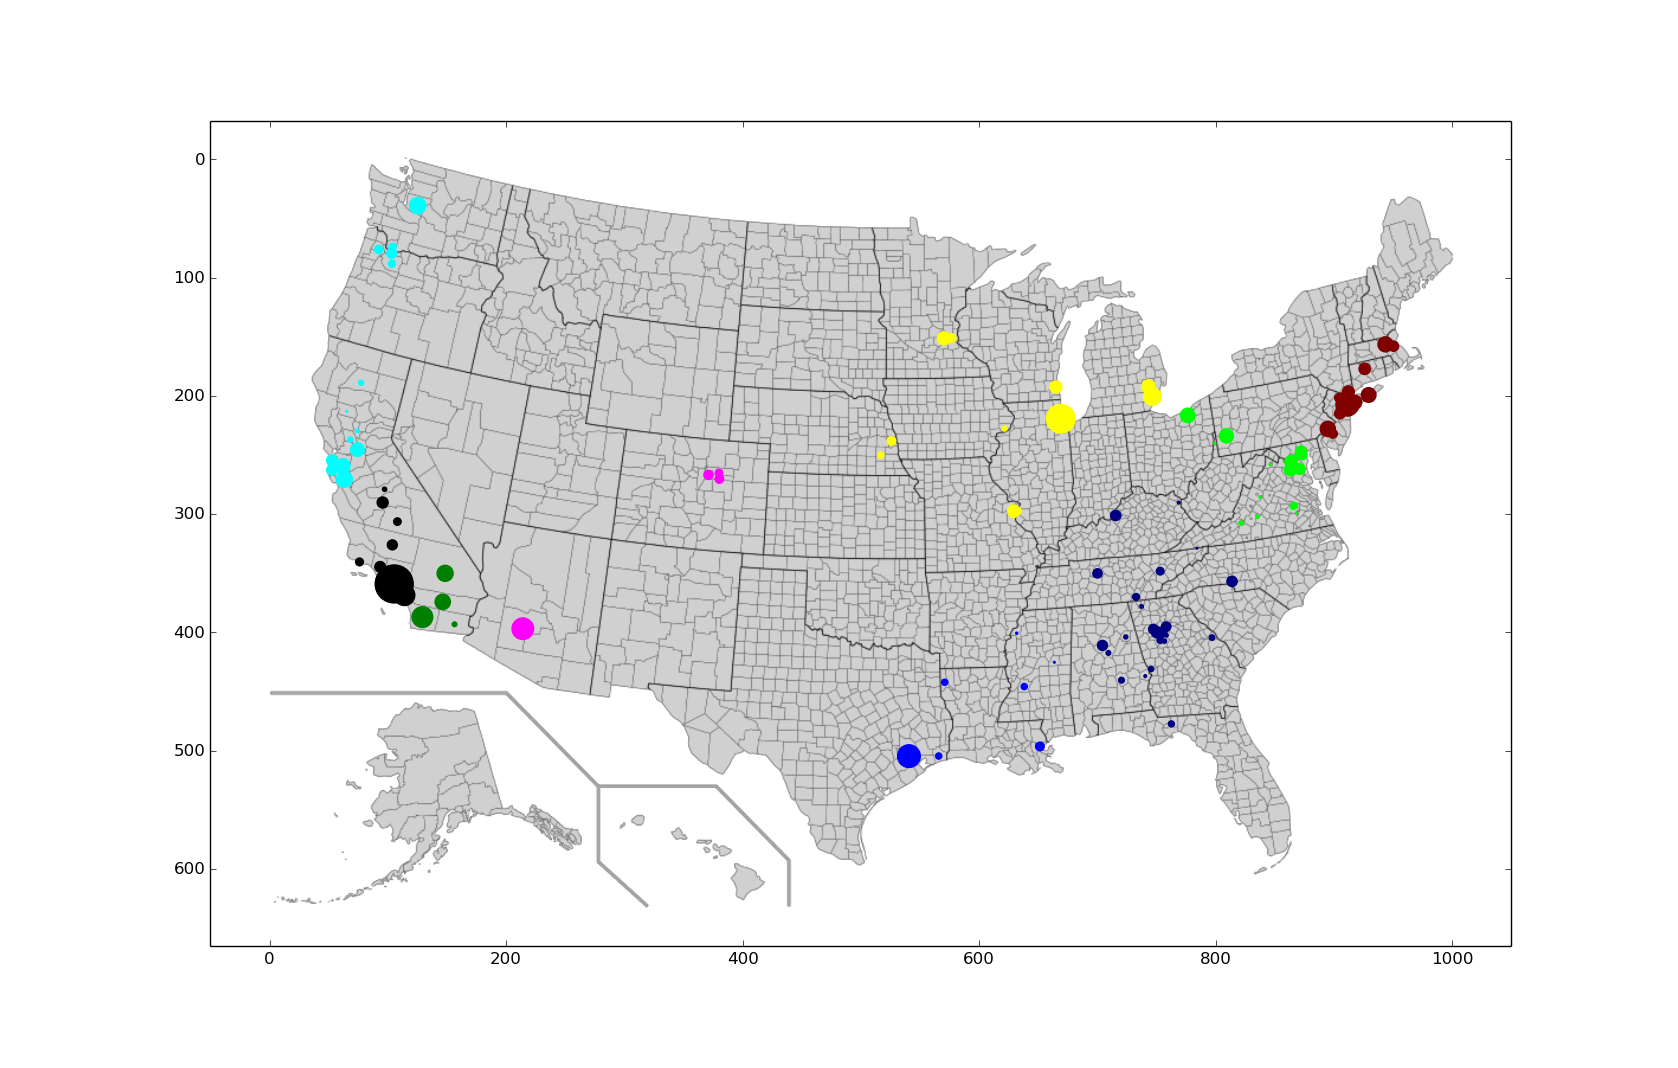
Looking at the west coast we can already see some issues with the k-means graph clustering because of the initial given population centers in southern California should be one cluster and not two. Mathematically, we can compute the distortion as the sum of the error for each cluster. So, for the two plots we find that:
- Hierarchical Distortion: 1.752 x 10¹¹
- K-means Distortion: 2.712 x 10¹¹
Which leads me to believe that k-means requires a greater level of trial-and-error from a human trying to find a good set of starting points, whereas hierarchical can be left to run on its own, at least for this small dataset.
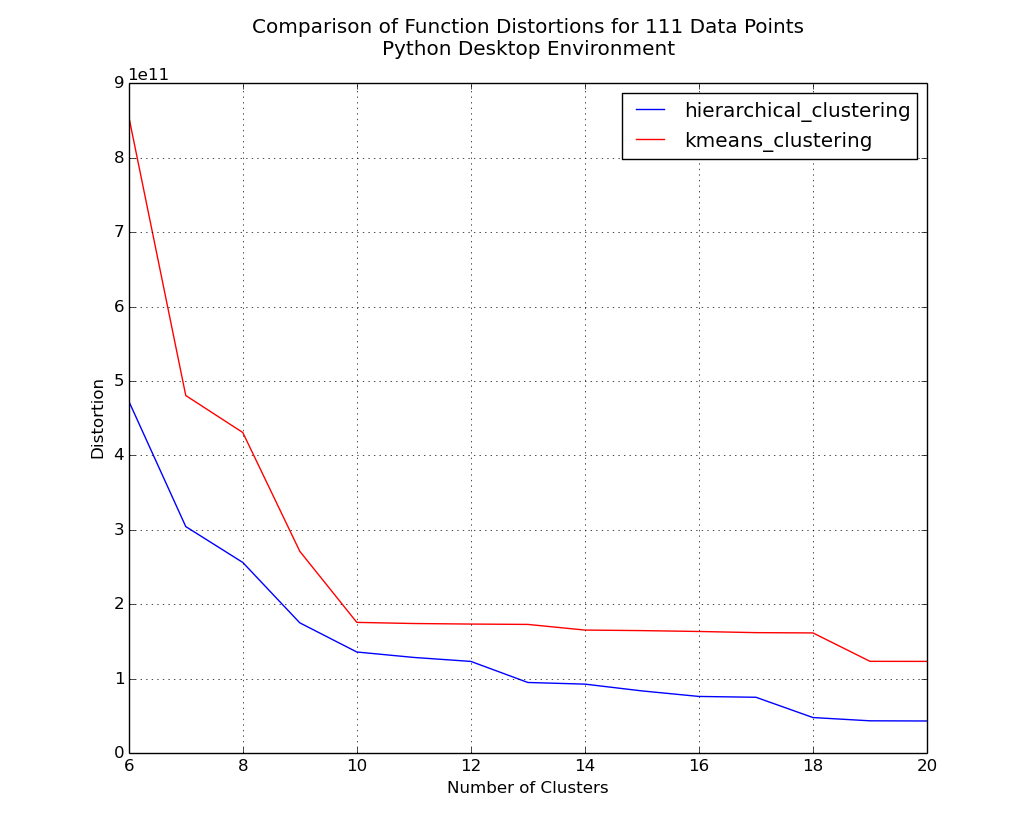
Plot of distortions for 6 to 20 clusters on 111 counties.
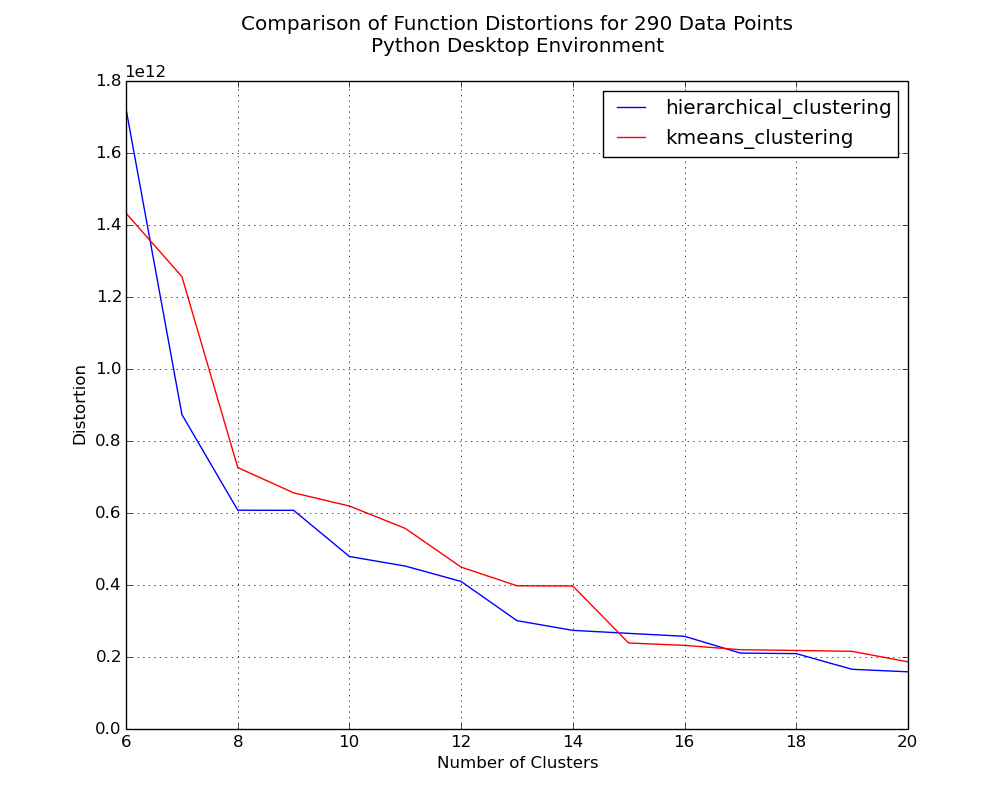
Plot of distortions for 6 to 20 clusters on 290 counties.
Plot of distortions for 6 to 20 clusters on 896 counties.

Initially, the hierarchical method clearly has the lower distortion, but as the dataset size increases we see that strength virtually evaporate. Considering that I think scalability is important, I think that both the aspect of function speed and the positive trend in distortion values as dataset size increases would lead me to choose k-means as the superior clustering method.

