Giter VIP home page Giter VIP logo

altair's Introduction

Vega-Altair

github actions typedlib_mypy JOSS Paper PyPI - Downloads

Vega-Altair is a declarative statistical visualization library for Python. With Vega-Altair, you can spend more time understanding your data and its meaning. Vega-Altair's API is simple, friendly and consistent and built on top of the powerful Vega-Lite JSON specification. This elegant simplicity produces beautiful and effective visualizations with a minimal amount of code.

Vega-Altair was originally developed by Jake Vanderplas and Brian Granger in close collaboration with the UW Interactive Data Lab. The Vega-Altair open source project is not affiliated with Altair Engineering, Inc.

Documentation

See Vega-Altair's Documentation Site as well as the Tutorial Notebooks. You can run the notebooks directly in your browser by clicking on one of the following badges:

Binder Colab

Example

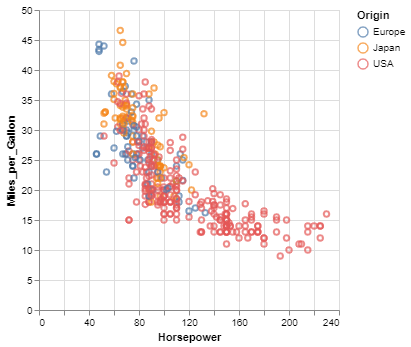
Here is an example using Vega-Altair to quickly visualize and display a dataset with the native Vega-Lite renderer in the JupyterLab:

import altair as alt

# load a simple dataset as a pandas DataFrame
from vega_datasets import data
cars = data.cars()

alt.Chart(cars).mark_point().encode(
    x='Horsepower',
    y='Miles_per_Gallon',
    color='Origin',
)

Vega-Altair Visualization

One of the unique features of Vega-Altair, inherited from Vega-Lite, is a declarative grammar of not just visualization, but interaction. With a few modifications to the example above we can create a linked histogram that is filtered based on a selection of the scatter plot.

import altair as alt
from vega_datasets import data

source = data.cars()

brush = alt.selection_interval()

points = alt.Chart(source).mark_point().encode(
    x='Horsepower',
    y='Miles_per_Gallon',
    color=alt.condition(brush, 'Origin', alt.value('lightgray'))
).add_params(
    brush
)

bars = alt.Chart(source).mark_bar().encode(
    y='Origin',
    color='Origin',
    x='count(Origin)'
).transform_filter(
    brush
)

points & bars

Vega-Altair Visualization Gif

Features

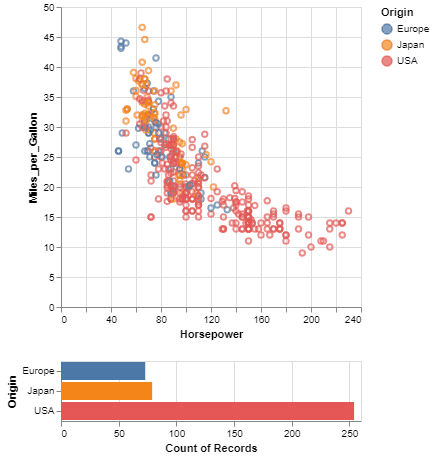
  • Carefully-designed, declarative Python API.
  • Auto-generated internal Python API that guarantees visualizations are type-checked and in full conformance with the Vega-Lite specification.
  • Display visualizations in JupyterLab, Jupyter Notebook, Visual Studio Code, on GitHub and nbviewer, and many more.
  • Export visualizations to various formats such as PNG/SVG images, stand-alone HTML pages and the Online Vega-Lite Editor.
  • Serialize visualizations as JSON files.

Installation

Vega-Altair can be installed with:

pip install altair

If you are using the conda package manager, the equivalent is:

conda install altair -c conda-forge

For full installation instructions, please see the documentation.

Getting Help

If you have a question that is not addressed in the documentation, you can post it on StackOverflow using the altair tag. For bugs and feature requests, please open a Github Issue.

Development

Hatch project Ruff pytest

You can find the instructions on how to install the package for development in the documentation.

To run the tests and linters, use

hatch test

For information on how to contribute your developments back to the Vega-Altair repository, see CONTRIBUTING.md

Citing Vega-Altair

JOSS Paper

If you use Vega-Altair in academic work, please consider citing https://joss.theoj.org/papers/10.21105/joss.01057 as

@article{VanderPlas2018,
    doi = {10.21105/joss.01057},
    url = {https://doi.org/10.21105/joss.01057},
    year = {2018},
    publisher = {The Open Journal},
    volume = {3},
    number = {32},
    pages = {1057},
    author = {Jacob VanderPlas and Brian Granger and Jeffrey Heer and Dominik Moritz and Kanit Wongsuphasawat and Arvind Satyanarayan and Eitan Lees and Ilia Timofeev and Ben Welsh and Scott Sievert},
    title = {Altair: Interactive Statistical Visualizations for Python},
    journal = {Journal of Open Source Software}
}

Please additionally consider citing the Vega-Lite project, which Vega-Altair is based on: https://dl.acm.org/doi/10.1109/TVCG.2016.2599030

@article{Satyanarayan2017,
    author={Satyanarayan, Arvind and Moritz, Dominik and Wongsuphasawat, Kanit and Heer, Jeffrey},
    title={Vega-Lite: A Grammar of Interactive Graphics},
    journal={IEEE transactions on visualization and computer graphics},
    year={2017},
    volume={23},
    number={1},
    pages={341-350},
    publisher={IEEE}
} 

altair's People

Stargazers

 avatar  avatar  avatar  avatar  avatar  avatar  avatar  avatar  avatar  avatar  avatar  avatar  avatar  avatar  avatar  avatar  avatar  avatar  avatar  avatar  avatar  avatar  avatar  avatar  avatar  avatar  avatar  avatar  avatar  avatar  avatar  avatar  avatar  avatar  avatar  avatar  avatar  avatar  avatar  avatar  avatar  avatar  avatar  avatar  avatar  avatar  avatar  avatar  avatar  avatar  avatar  avatar  avatar  avatar  avatar  avatar  avatar  avatar  avatar  avatar  avatar  avatar  avatar  avatar  avatar  avatar  avatar  avatar  avatar  avatar  avatar  avatar  avatar  avatar  avatar  avatar  avatar  avatar  avatar  avatar  avatar  avatar  avatar  avatar  avatar  avatar  avatar  avatar  avatar  avatar  avatar  avatar  avatar  avatar  avatar  avatar  avatar  avatar  avatar  avatar

Watchers

 avatar  avatar  avatar  avatar  avatar  avatar  avatar  avatar  avatar  avatar  avatar  avatar  avatar  avatar  avatar  avatar  avatar  avatar  avatar  avatar  avatar  avatar  avatar  avatar  avatar  avatar  avatar  avatar  avatar  avatar  avatar  avatar  avatar  avatar  avatar  avatar  avatar  avatar  avatar  avatar  avatar  avatar  avatar  avatar  avatar  avatar  avatar  avatar  avatar  avatar  avatar  avatar  avatar  avatar  avatar  avatar  avatar  avatar  avatar  avatar  avatar  avatar  avatar  avatar  avatar  avatar  avatar  avatar  avatar  avatar  avatar  avatar  avatar  avatar  avatar  avatar  avatar  avatar  avatar  avatar  avatar  avatar  avatar  avatar  avatar  avatar  avatar  avatar  avatar  avatar  avatar  avatar  avatar  avatar  avatar  avatar  avatar  avatar  avatar  avatar

altair's Issues

[API] Should encode() overwrite or update?

Consider this:

layer = Layer(data)
layer.encode(x='Horsepower')
layer.encode(y='Miles_per_Gallon')

Currently, this result is identical to

Layer(data).encode(y='Miles_per_Gallon')

this is because every time encode is called, it overwrites the current encoding.

I think it might be less confusing to change encode so that it instead updates the encoding, such that the above would be equivalent to

layer = Layer(data).encode(
   x='Horsepower',
   y='Miles_per_Gallon'
)

Thoughts?

Make the defaults of our custom Enum types is None

All of our default values should be None when we don't define anything. Right now, the default values for custom Enum types are empty strings rather than None. This is forcing is to add extra logic.

Auto-generate top-level objects?

We might think about auto-generating the top-level objects. The main benefit would be the ability to explicitly define keywords in the methods for better tab-completion. Also, if we do it well it will be less work to keep things up-to-date as the Vega-Lite schema evolves.

On the other hand, maintaining templates is probably harder than maintaining code in the long-run.

config_*() methods overwrite previous attributes

Here is the current behavior:

from altair import Chart, load_dataset
cars = load_dataset('cars')

chart = Chart(cars)
chart.configure_axis(axisWidth=500)
chart.configure_axis(axisColor='red')
chart.to_dict()['config']
# {'axis': {'axisColor': 'red'}}

Note that axisWidth is overwritten by the second method call. I'm not sure whether it makes more sense to have it this way, or to have it so that additional method calls add properties to those which were previously defined.

rc1 comment.

As per @ellisonbg testing RC1 and commenting, apologies for shortness, I'll assume you want efficiencies and quick review for SciPy.

It looks really great ! Here are what goes through my mind as explore. Sorry if it's all over the place.

Altair requires the following dependencies:

numpy
pandas
py.test

If this is true, it should be in setup.py install_requires, or don't say it.
You also requires traitlets in setup.py , which is an indirect dependency, I suggest removing.

I suggest making a

extras_require = dict(
 'test' = [...],
 'notebook' = [...]
 'jupyter' = [...]
)

if you want to.

Does it needs jupyter nbextension enable vega --py --sys-prefix as said during the installation step (a word on that might be good)

Installation when smoothly ; It works.

  • I was confuse the docs in notebooks, I was searching for docs/notebook.
  • I'm confused by the dotted line around graph, and the fact that save freeze the graph as PNG (but I might have bad ipywidgets)
  • The colors and style looks great.
  • The PNGs looks blurry to me
    • I registed altair.readtehdocs.io, made Brian and Jake maintainer/owner.
  • .encode(...) has a strong bytes/unicode meaning to me.
  • Same case kwargs feel weird timeUnit, labelAngle
  • Examples implicitely display things as they are last cells statements, I guess people might get confused.
  • I still like the color.
  • rename notebook with leading number, Introduction / index are not the firsts.

Config naming confusion

Now that all of our classes are inheriting from traitlets Configurable, they have a config property. What we didn't notice is that Viz objects in the VL spec also have a config property. These two notions of config are completely separate, but have the same property names, which conflixts. To get around this I have called the VL config property Viz/vlconfig but make sure that it still gets serialized to config in to_dict. I am not too fond of this, but don't have a better idea at this point. Any ideas?

@jakevdp @wrobstory @tacaswell

Version 1.0 Release Roadmap

We're getting close to release I think. Here's what I have in mind:

  • Merge new schema interface (#116)
  • Merge new configure interface (#123)
  • update code generation to use new configure interface (#127)
  • Rename Layer to Chart (#125)
  • Update Vega-Lite schema to 1.0.10+ and update wrappers (#128)
  • Address bugs #90 & #91
  • Maybe add auto-generation of Encoding/Facet?
  • Maybe add auto-generation of Chart and other higher-level wrappers? (decorator solution instead: see #129 & ellisonbg@bc9b1c6)
  • Implement other top-level objects exposed in vega-lite 1.0.10+?
  • Add + syntax for creating LayeredChart (#137)
  • Add regression notebook (#138)
  • Do another ipyvega release with vega-lite 1.0.12
  • One more pass through docs and examples; in particular add examples of FacetedChart and LayeredChart (#137)
  • Create conda-forge recipe (#89)

Syntax Questions / Comments

I skim through the notebooks in the notebooks folder.

  1. I wonder why Scatterplot.ipynb and SimpleBarChart.ipynb have x=, y= in the encode() function. (x=X('Horsepower')) seems somewhat redundant compared to BasicExample.ipynb, which do not require x= prefix. That said, x= might be useful in the sense that people shouldn't assign multiple fieldDefs to the same channel except detail.
Layer(data).encode(     x=X('Horsepower'),     y=Y('Miles_per_Gallon') ).point()
  1. Note that using Layer as the base object might introduce future conflict with our layer composition operator.

Serialization of lists is broken

Right now, some attributes of the different objects can be lists. Right now, those don't serialize. We probably want to create a serialize function that can be called recursively to better deal with this situation.

Redo Unit Tests

With the rewrite for the 1.0 spec, the unit tests are failing.

@ellisonbg โ€“ can I work on this while you're scraping the example plots this morning?

population dataset not encodable as JSON

Something is going on here... I'm having trouble figuring out what the problem is:

>>> from altair import *
>>> population = load_dataset('population')
>>> Layer(population)
---------------------------------------------------------------------------
TypeError                                 Traceback (most recent call last)
/Users/jakevdp/anaconda/envs/python3.5/lib/python3.5/site-packages/IPython/core/formatters.py in __call__(self, obj)
    907             method = _safe_get_formatter_method(obj, self.print_method)
    908             if method is not None:
--> 909                 method()
    910                 return True
    911 

/Users/jakevdp/anaconda/envs/python3.5/lib/python3.5/site-packages/vega-0.3.0-py3.5.egg/vega/base.py in _ipython_display_(self)
     47         )
     48         publish_display_data(
---> 49             {'application/javascript': self._generate_js(id)},
     50             metadata={'jupyter-vega': '#{0}'.format(id)}
     51         )

/Users/jakevdp/anaconda/envs/python3.5/lib/python3.5/site-packages/vega-0.3.0-py3.5.egg/vega/base.py in _generate_js(self, id)
     34         payload = template.format(
     35             selector=selector,
---> 36             spec=json.dumps(self.spec),
     37             type=self.render_type
     38         )

/Users/jakevdp/anaconda/envs/python3.5/lib/python3.5/json/__init__.py in dumps(obj, skipkeys, ensure_ascii, check_circular, allow_nan, cls, indent, separators, default, sort_keys, **kw)
    228         cls is None and indent is None and separators is None and
    229         default is None and not sort_keys and not kw):
--> 230         return _default_encoder.encode(obj)
    231     if cls is None:
    232         cls = JSONEncoder

/Users/jakevdp/anaconda/envs/python3.5/lib/python3.5/json/encoder.py in encode(self, o)
    197         # exceptions aren't as detailed.  The list call should be roughly
    198         # equivalent to the PySequence_Fast that ''.join() would do.
--> 199         chunks = self.iterencode(o, _one_shot=True)
    200         if not isinstance(chunks, (list, tuple)):
    201             chunks = list(chunks)

/Users/jakevdp/anaconda/envs/python3.5/lib/python3.5/json/encoder.py in iterencode(self, o, _one_shot)
    255                 self.key_separator, self.item_separator, self.sort_keys,
    256                 self.skipkeys, _one_shot)
--> 257         return _iterencode(o, 0)
    258 
    259 def _make_iterencode(markers, _default, _encoder, _indent, _floatstr,

/Users/jakevdp/anaconda/envs/python3.5/lib/python3.5/json/encoder.py in default(self, o)
    178 
    179         """
--> 180         raise TypeError(repr(o) + " is not JSON serializable")
    181 
    182     def encode(self, o):

TypeError: 1850 is not JSON serializable

API question: should we implement encode_x(), etc.?

Currently we have two ways of specifying configurations, which are equivalent:
Chart().configure(cell=CellConfig(**kwargs)) and
Chart().configure_cell(**kwargs).

On the other hand, for encodings we have
Chart().encode(x=X('name', **kwds)) or Chart().encode(x='name'), where in the second shorthand there is no way to specify additional keywords.

I wonder if it wouldn't be convenient to have, by analogy with the configure methods, Chart().encode_x('name', **kwds)?

On the one hand, there are situations where it would be very useful โ€“ especially for tab-completion of arguments within the function. It also creates some symmetry with the configure_* methods, and users might expect to be able to do this. On the other hand, it would add yet another way of solving the same probelm, and is not particularly convenient for the most common case of defining several encodings at once.

Thoughts?

How to structure narrative docs for altair

Vega-Lite itself now has very nice narrative docs. I am wondering how we want to handle the narrative docs for altair. Some options:

  • Just add the equivalent altair/python code to the main Vega-Lite documentation and have that be the main single source of narrative documentation.
  • Create notebooks for the examples that are in the Vega-Lite documentation to help with that.
  • Keep it all completely separate.
  • Offer tutorials on specific dataset in altair, similar to how seaborn has the nice one on the titanic dataset.

@domoritz

Implement data transformation module

For Python based renderers, the main challenge is starting from the initial data from and then transforming the data into something that can be more directly plotting onto subplots in the various plotting libraries. The data transformation logic will be the same for any Python based renderer (Matplotlib, Bokeh, Plotly, bqplot) so it should probably live in Altair. Plus the mpl.py module has a start on this.

From our talking to Jeff Heer, the data transformation logic is as follows:

  1. Binning. Any column that should be binned creates a new column of binned data and the data is then grouped by that binned column.
  2. Grouping. Next the binned columns and all columns associated with shelves (row, col, color, size, etc.) are grouped.
  3. Aggregation. Any aggregations are then applied.

Here is an issues on the vega-lite repo where we have asked about how this logic happens:

vega/vega-lite#584

Allow columns to be specified by passing a pandas Series

From @Carreau in #140

Chart(cars).mark_circle().encode(
    x='Horsepower',
    y='Miles_per_Gallon',
    color='Origin',
    size='Acceleration'
)

would it be possible at some future point to use:

    x='Horsepower',
    y='Miles_per_Gallon',
    color='Origin',
    size=cars.Acceleration
)

to be smart and figure back the name of the column ?

Altair throws error for calculated attributes

e.g.

from altair import *
population = load_dataset('population')
for col in population:
    population[col] = population[col].astype(float)

transform = Transform(filter='datum.year==2000',
                      calculate=[Formula(field='gender',
                                         expr='datum.sex == 2 ? "Female" : "Male"')])

Layer(population, transform=Transform(filter="datum.year==2000")).encode(
    x='age:O',
    y='sum(people)',
    color=Color('gender')
).bar()


---------------------------------------------------------------------------
ValueError                                Traceback (most recent call last)
/Users/jakevdp/anaconda/envs/python3.5/lib/python3.5/site-packages/IPython/core/formatters.py in __call__(self, obj)
    907             method = _safe_get_formatter_method(obj, self.print_method)
    908             if method is not None:
--> 909                 method()
    910                 return True
    911 

/Users/jakevdp/anaconda/envs/python3.5/lib/python3.5/site-packages/altair-0.0.1-py3.5.egg/altair/api.py in _ipython_display_(self)
    424         from IPython.display import display
    425         from vega import VegaLite
--> 426         display(VegaLite(self.to_dict()))
    427 
    428     def display(self):

/Users/jakevdp/anaconda/envs/python3.5/lib/python3.5/site-packages/altair-0.0.1-py3.5.egg/altair/api.py in to_dict(self, data)
    362 
    363     def to_dict(self, data=True):
--> 364         D = super(Layer, self).to_dict()
    365         if data:
    366             if isinstance(self.data, Data):

/Users/jakevdp/anaconda/envs/python3.5/lib/python3.5/site-packages/altair-0.0.1-py3.5.egg/altair/schema/baseobject.py in to_dict(self)
     25                 if v is not None:
     26                     if isinstance(v, BaseObject):
---> 27                         result[k] = v.to_dict()
     28                     else:
     29                         result[k] = v

/Users/jakevdp/anaconda/envs/python3.5/lib/python3.5/site-packages/altair-0.0.1-py3.5.egg/altair/api.py in to_dict(self)
     65             return None
     66         if not self.type:
---> 67             raise ValueError("No vegalite data type defined for {0}".format(self.field))
     68         return super(_ChannelMixin, self).to_dict()
     69 

ValueError: No vegalite data type defined for gender

Cannot import the lightning renderer

I'm getting latest altair and installing it following instructions. I'm running the server like so:

The version of the notebook server is 3.2.0-8b0eef4 and is running on:
Python 2.7.10 |Anaconda 2.3.0 (x86_64)| (default, May 28 2015, 17:04:42) 
[GCC 4.2.1 (Apple Inc. build 5577)]

When I try to run the BasicExample notebook with alt.use_renderer('lightning'), I get the following exception:

---------------------------------------------------------------------------
NameError                                 Traceback (most recent call last)
<ipython-input-2-6d2e0a8f478e> in <module>()
----> 1 alt.use_renderer('lightning')

/Users/alexgg/anaconda/lib/python2.7/site-packages/altair-0.0.1-py2.7.egg/altair/api.pyc in use_renderer(r)
    437     else:
    438         if r in _renderers:
--> 439             _renderer = _renderers[r]()
    440         else:
    441             raise ValueError('renderer could not be found: {0}').format(r)

/Users/alexgg/anaconda/lib/python2.7/site-packages/altair-0.0.1-py2.7.egg/altair/api.pyc in _get_lightning_renderer()
    413 
    414 def _get_lightning_renderer():
--> 415     from .lgn import LightningRenderer
    416     return LightningRenderer()
    417 

build/bdist.macosx-10.5-x86_64/egg/altair/lgn.py in <module>()

build/bdist.macosx-10.5-x86_64/egg/altair/lightning.py in <module>()

NameError: name 'Lightning' is not defined

Any ideas?
Thanks!

Treat `Q` columns as `O` when groupby'd

Right now in vega-lite, all columns that are not aggregated are groupby'd. This includes Q columns, which leads to rather unexpected visualizations where a quantity column is grouped by value. I brought this up on the vega-lite repo and the consensus is to treat such Q columns as O in this case and warn. Here is the discussion:

vega/vega-lite#688

Lightning renderer broken inside `ipywidgets.Output`

When trying to get the lightening renderer to work with the new IPython widget, it breaks in many ways. In particular, it won't render at all inside ipywidget.Output. This may be related to:

  • How lightning uses IFrames
  • The lack of a unique id on the div (should have a uuid).
  • Other?

Auto-generate datasets

I noticed that there are some new datasets available for vega-lite. We should try to auto-generate them from the vega-datasets repo. I would probably generate a datasets.json file, put it in the package, and read it into the _datasets variable in the current datasets.py.

A couple other dataset-related thoughts:

  • maybe use lru_cache to cache datasets in memory so they're not downloaded twice within a session
  • maybe auto-generate dataset functions like load_cars() so that they can be tab-completed, with description in the doc-string

Simplify Data URLs

To create a visualization currently from a URL we use:

Chart(Data(url='http://some.url/some/path.json', format='json')).mark_point()

I think we could pretty easily shorten this to

Chart('http://some.url/some/path.json').mark_point()

without introducing any ambiguity.

[Discussion] Object API

As I'm coding up the tutorial & examples, it strikes me that there's a confusing inconsistency in the API.

Consider this:

from altair import *
data = load_dataset('cars')
Layer(data).encode(
    X('Horsepower', bin=Bin(maxbins=10)),
    y='count(*):Q'
).bar()

The encode() interface has some nice properties: that is, you can pass attributes either as an unnamed argument (e.g. X(...)) or as a named argument (e.g. y=...). The benefit here is that it makes the API intuitive and reduces duplication of information (vs. e.g. x=X(...)).

When building these plots, I found it confusing that nested arguments don't allow the same flexibility. That is, I'd like to be able to write X('Horsepower', Bin(maxbins=10)) or perhaps also X('Horsepower', bin={'maxbins':10}). Could we override the __init__() method of traitlets to somehow do this sort of inference on input arguments?

cc/@ellisonbg

(Unrelated: the above snippet is how we spell "histogram" in Altair; we might think about a convenience method to wrap this).

Traitlets silently ignore typos

>>> from altair.schema import Config
>>> Config(backgruond='blue').to_dict()
{}
>>> Config(background='blue').to_dict()
{'background': 'blue'}

Is there an easy way to tell traitlets to validate init arguments?

NaN fields produce errors with the lightning renderer - may affect other renderers too?

Using Altair to render the following pandas df:

records_text = '{"clientid":"8","querytime":"18:54:20","market":"en-US","deviceplatform":"Android","devicemake":"Samsung","devicemodel":"SCH-i500","state":"California","country":"United States","querydwelltime":13.9204007,"sessionid":0,"sessionpagevieworder":0}\n{"clientid":"23","querytime":"19:19:44","market":"en-US","deviceplatform":"Android","devicemake":"HTC","devicemodel":"Incredible","state":"Pennsylvania","country":"United States","sessionid":0,"sessionpagevieworder":0}'
json_array = "[{}]".format(",".join(records_text.split("\n")))
import json
d = json.loads(json_array)
result = pd.DataFrame(d)
result

the NaN for querydwelltime produces the following error:

Javascript error adding output!
TypeError: Cannot read property 'prop' of undefined
See your browser Javascript console for more details.

The vegalite spec produced by Altair is:

{'config': {'width': 600, 'gridOpacity': 0.08, 'gridColor': u'black', 'height': 400}, 'marktype': 'point', 'data': {'formatType': 'json', 'values': [{u'deviceplatform': u'Android', u'devicemodel': u'SCH-i500', u'country': u'United States', u'sessionpagevieworder': 0, u'state': u'California', u'clientid': u'8', u'sessionid': 0, u'querytime': u'18:54:20', u'devicemake': u'Samsung', u'market': u'en-US', u'querydwelltime': 13.9204007}, {u'deviceplatform': u'Android', u'devicemodel': u'Incredible', u'country': u'United States', u'sessionpagevieworder': 0, u'state': u'Pennsylvania', u'clientid': u'23', u'sessionid': 0, u'querytime': u'19:19:44', u'devicemake': u'HTC', u'market': u'en-US', u'querydwelltime': nan}]}}

For commentary and possible fixes, this issue is tracked by lightning renderer in:
lightning-viz/lightning-python#34

This issue is also documented in sparkmagic at: jupyter-incubator/sparkmagic#39

cc @mathisonian

API: should ``Layer()`` not derive from ``BaseObject``?

Since Layer is the main interface, it would be nice if tab completion on the object only listed relevant pieces of the API so that you can quickly find what plot types are available (e.g. point(), bar(), text(), etc.)

Currently, since it derives from BaseObject the namespace is polluted with all sorts of traitlet stuff that the user probably doesn't care about.

I'd propose something like this:

class LayerObject(BaseObject):
    # traitlet-related stuff goes here
    def __init__(self, *args, **kwargs):
        super(LayerObject, self).__init__(**kwargs)

    # etc.

class Layer(object):
    # non-traitlet-related Layer methods here
    def __init__(self, *args, **kwargs):
        if len(args)==1:
            self.data = args[0]
        self._layerobject = LayerObject(**kwargs)

    def point(self):
        self.mark = 'point'
        return self

    # etc.

The only problem would be if we ever want to pass Layer to some other class this would complicate things. What do you think?

Add html render?

I think I've hacked together a combo of vega 1.x + vega-lite that I think will embed rendered html based on the specs we generate ๐Ÿ™ . Worth adding here alongside the render, maybe as a render_html? Probably just for intermediate testing purposes, while we wait for vega-lite 2.x support and/or incorporation it into other interactive libraries (e.g. Lightning).

Warning on `df==None`

When the data attribute of a Viz class changed, traitlets does a df==None test to see if the value has changed. This raises a warning.

Test type inference

When the Layer.data attribute is set, we trigger logic to infer the vegalite type of the channels based on what field (column) they are pointing to. Likewise, if data is set to None, the type inference should be reset.

We need to write tests to make sure all of this is working.

Implement full validation

The vega-lite spec has contraints about column types, shelves and aggregation. We should implement those in traitlets.

Update README

We haven't updated the README for the new APIs and renderer appoach. Would also be great to have a simple example on the main README (the PNG and python code).

zero-valued traitlet attributes get ignored

>>> CellConfig(strokeWidth=1).to_dict()
{'strokeWidth': 1.0}
>>> CellConfig(strokeWidth=0).to_dict()
{}

This should be {'strokeWidth': 0.0}. From a quick glance at the code, I'm not sure where this is being lost...

Spec for boxplots

Starting to think about how to express a box plot with this type of spec. For this discussion, let's say we have two columns: amount:Q and state:N.

Option 1 (boxplot implies computing the summary stats):

Vis(df).encode(x='state:N', y='amount:Q').boxplot()

Option 2 (explicit summary stats call):

Vis(df).encode(x='state:N', y='summarize(amount):Q').boxplot()

The big change from the existing vega-lite spec is that a box plot requires more than a scalar aggregation of the y data (mean, var, etc.). Questions:

  • Should aggregations be able to emit non-scalars?
  • Should marks be able to comsume non-scalars (either entire data sets or non-scalar aggregations)?

Additional aliases

There are a few other class names that we alias in api.py:

  • AxisProperties->Axis
  • BinProperties->Bin
  • LegendProperties->Legend
  • VgFormula->Formula

Two action items related to these:

  • The Python code generation currently uses the unaliased names.
  • We might want to autogenerate the aliased classes rather than handcoding them in api.py

Recommend Projects

  • React photo React

    A declarative, efficient, and flexible JavaScript library for building user interfaces.

  • Vue.js photo Vue.js

    ๐Ÿ–– Vue.js is a progressive, incrementally-adoptable JavaScript framework for building UI on the web.

  • Typescript photo Typescript

    TypeScript is a superset of JavaScript that compiles to clean JavaScript output.

  • TensorFlow photo TensorFlow

    An Open Source Machine Learning Framework for Everyone

  • Django photo Django

    The Web framework for perfectionists with deadlines.

  • D3 photo D3

    Bring data to life with SVG, Canvas and HTML. ๐Ÿ“Š๐Ÿ“ˆ๐ŸŽ‰

Recommend Topics

  • javascript

    JavaScript (JS) is a lightweight interpreted programming language with first-class functions.

  • web

    Some thing interesting about web. New door for the world.

  • server

    A server is a program made to process requests and deliver data to clients.

  • Machine learning

    Machine learning is a way of modeling and interpreting data that allows a piece of software to respond intelligently.

  • Game

    Some thing interesting about game, make everyone happy.

Recommend Org

  • Facebook photo Facebook

    We are working to build community through open source technology. NB: members must have two-factor auth.

  • Microsoft photo Microsoft

    Open source projects and samples from Microsoft.

  • Google photo Google

    Google โค๏ธ Open Source for everyone.

  • D3 photo D3

    Data-Driven Documents codes.