badgertechnologies / bitclean Goto Github PK
View Code? Open in Web Editor NEWBitclean is the sister application to Sharpclean built to improve the map clean up process
Bitclean is the sister application to Sharpclean built to improve the map clean up process


DO THIS before the issue regarding actually adding stuff into the ChartConfiguration window
Right now the windows version displays the chart configuration options and the list of loaded data along with statistics. I think it's cleaner and easier to read/debug if the configuration options are in a separate window entirely.
You should create a new windows form named "Chart Configuration", add the option to the toolstrip as Charts > "Configure...", and open the ChartConfiguration window in the respective on_click() function.
Here's a great start:
https://stackoverflow.com/a/7099254/6200616
Checkout some guides on adding toolstrip stuff, it's pretty simple if you use the designer.
Some of this might be done already, so just check that it's there and add these if not. You might even need to just rename the option for consistency. Make sure to add the [option-name]_click() function for each of these options too in Diagnostics.cs
toolstrip should read:
file > "load data..."
charts > "configure..."
charts > "generate"
learning > "run sifter"
You'll need to understand how toolstrips work in the designer and how adding *_click() functions work. This is all made pretty easy by Visual Studio, here's a good start:
The GTK# version has the sifter in a sort-of working state. Basically just copy and paste this into the windows forms version. It's plain C# algorithms so you'll just need to fix the extra data types that were added to make it work, again reference GTK# *types.cs files for this.
Diagnostics.cs calls the sifter from Learning > "run sifter" so this toolstrip item needs to be there first. Then the RunSifter_Click() function should look something like this:
#GTK::diagnostics.cs:
    protected void RunSifter(object sender, EventArgs e)
    {
        if (dustcount == 0)
            return;

        AttributeStatistics[] stats =
        {
            dustSizeStats,
            dustEdgeratioStats,
            dustDensityStats
        };

        Sifter sifter = new Sifter(stats);
    }
I think examining data will be much easier if there's a way to choose what function you want to use and then you can give it the parameters you want for post processing data. Then opening the chart will display the data after it's been processed through the function you selected.
This will require GUI wizardry more than anything.
Example:
Open chart configuration > select Linear function > text entry boxes display for the (a) slope, (b) offset.
Open chart configuration > select Logistic function > text entry boxes display for the (a) alpha parameter, (b) beta parameter, (c) c parameter, (d) offset parameter.
And on for each function (besides piece-wise though it'd be cool if we could do this too)
Again for WinForms:
This may imply you need to finish catching up to the GTK# version -- check the other issue board for progress and information on that.
Right now only .bmp's can be loaded/saved in the winforms version. We should extend the functionality to include .png and .jpeg as well.
Definitely get to know the MainWindow.cs functions and data members as well as how flexible .NET's image loading/saving stuff is.
Here's a good start for loading the image:
Master::MainWindow.cs
private void LoadImageFile_Click(object sender, EventArgs e)
{
	using (OpenFileDialog openFD = new OpenFileDialog())
	{
		// set dialog settings
		// TODO - allow user to select .png/.jpeg files too
		openFD.Title = "Select an image file";
		openFD.InitialDirectory = filemanager.ImageDirectory;
		openFD.Filter = "bmp files (*.bmp)|*.bmp";
		openFD.RestoreDirectory = true;

		// ... some code ...

		try {
			// ... code ...

			// load bmp
			// TODO: figure out how to load .png and .jpegs too
			bmp = new Bitmap(Image.FromFile(filemanager.ImagePath));

			// ... rest of function ...
I've all but abandoned the brain in lieu of the sifter, however it has potential.
This will require some knowledge of neural networks and machine learning. A very preliminary configuration is implemented and working, but it's useless and doesn't actually learn anything.
The next step is designing something useful. Good luck, force be with you pack a lunch.
Each time there's an error or something was not done properly, we want to notify the user. This is already done in most cases by printing something to the console, but we need to switch this to something readable when running a deployed executable.
Example:
User tries to run bitclean when an image is not loaded yet -> display an error.
I think it'd be helpful to display the name of the file currently loaded somewhere. Sharpclean parses the file location to figure out the store name / number so something similar could be nice.
Example:
File loaded
search file path for strings matching "stop n shop", "sns", "ss", "gm", "giant martin", etc and the store number
if found, display that, if not just display the file name.
By now you should have a new windows form called ChartConfiguration and a toolstrip menu item under Charts > "configure..." that calls the on_click function.
For this issue I highly recommend being comfortable with how the designer works, what's happening with each button in diagnostics.cs, and referencing the GTK# version to see what has changed (the syntax is a little different but the general design can be exactly the same).
Now lets remove all of the chart configuration stuff from the diagnostics window.
The configuration options are just a series of radio buttons, check boxes, buttons, etc. So we want to scrape all of that functionality out of the diagnostics window and eventually (in part 3) add it back to the new ChartConfiguration.cs file.
You can go to the designer in VS, right click the configuration stuff, and literally delete it from the project. This will remove references from the Diagnostics.designer.cs, but not the Diagnostics.cs file. This is what we want because now you can look at all of the unreferenced errors and delete/rework those lines of code. This is where it's necessary to understand how everything works in this window.
Notice how in the GTK# version there's a few different files named [something]types.cs.
This is a solution to issues with the metatypes.cs file being too large and cluttered. I just broke up the types into different categories and placed them in their own file. It does absolutely nothing to the code besides changing what files should be referenced but unlike c# handles this for you.
There may be some weird issues with the namespaces.
There's only two categories, systemtypes.cs and uitypes.cs. See the file organization issue for what file goes where. Reference GTK# for what structures/classes to place in each file.
In Main Window, Diagnostics > "plot" toolstrip option should be "open diagnostics..." for consistency.
We should allow the user to run bitclean like sharpclean -- using a .pgm file to be cleaned.
This won't be very hard - just check the file extension for ".pgm" OR if it's a ".bmp/png/jpeg" then we can still check if the image is only black/white when we iterate through the pixels in the imageops functions. Using this we can send a special argument to the toolbox to run the old sharpclean version (essentially the same thing but no hue calculations).
Currently the user cannot choose what axis are affected by the preprocessing and post processing functions -- both axis are assumed for preprocessing and only yaxis can be post processed.
Will need to display these options in the configuration window and fix the chart data processing functions.
Win Forms:
This probably implies the configuration window should be created and chart data processing is fixed before approaching this.
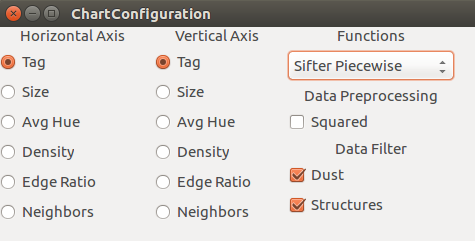
This is the final piece of the chart configuration trilogy.
By now hopefully you're real comfortable with how this stuff works. You'll need to make the window look like the following image, and include the functionality to make these options work and update the configuration options object (more on that below).
Then you need to "tie" the configuration to the actual chart window. Check out GTK# for methods to do this.
GTK#::Diagnostics.cs:
    protected void OpenChartConfiguration(object sender, EventArgs e)
    {
        UI.ChartConfiguration configwindow = new UI.ChartConfiguration(ref configuration);
        configwindow.Show();
    }

    protected void GenerateChart(object sender, EventArgs e)
    {
        List<object[]> objectdata = new List<object[]>();

        // create data for data points
        foreach (ChartObject chartObject in objects)
        {
            object[] data = {
                chartObject.tag,
                chartObject.decision,
                chartObject.size,
                chartObject.avghue,
                chartObject.density,
                chartObject.edgeratio,
                chartObject.neighbors.Count
            };
            objectdata.Add(data);
        }
                                                                            // !!! //
        UI.Chart chart = new UI.Chart(objectdata, configuration, datatree.Columns);
        chart.Show();

    }
GTK#::UItypes.cs:
public class ChartOptions
{
    public string horizontalChoice, verticalChoice;
    public ActivationFunction function;
    public bool squared;
    public bool dust, structures;
}
The ref configuration parameter is modified by the chart configuration and then passed into the Chart window on creation. Now Chart can see the options the user selected and generate the data as needed.
A declarative, efficient, and flexible JavaScript library for building user interfaces.
🖖 Vue.js is a progressive, incrementally-adoptable JavaScript framework for building UI on the web.
TypeScript is a superset of JavaScript that compiles to clean JavaScript output.
An Open Source Machine Learning Framework for Everyone
The Web framework for perfectionists with deadlines.
A PHP framework for web artisans
Bring data to life with SVG, Canvas and HTML. 📊📈🎉
JavaScript (JS) is a lightweight interpreted programming language with first-class functions.
Some thing interesting about web. New door for the world.
A server is a program made to process requests and deliver data to clients.
Machine learning is a way of modeling and interpreting data that allows a piece of software to respond intelligently.
Some thing interesting about visualization, use data art
Some thing interesting about game, make everyone happy.
We are working to build community through open source technology. NB: members must have two-factor auth.
Open source projects and samples from Microsoft.
Google ❤️ Open Source for everyone.
Alibaba Open Source for everyone
Data-Driven Documents codes.
China tencent open source team.